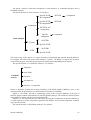
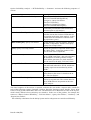
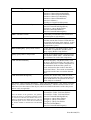
1
Downloaded from orbit.dtu.dk on: Dec 18, 2015 Failure database and tools for wind turbine availability and reliability analyses. The application of reliability data for selected wind turbines Kozine, Igor; Christensen, P.; Winther-Jensen, M. Publication date: 2000 Document Version Publisher final version (usually the publisher pdf) Link to publication Citation (APA): Kozine, I., Christensen, P., & Winther-Jensen, M. (2000). Failure database and tools for wind turbine availability and reliability analyses. The application of reliability data for selected wind turbines. (Denmark. Forskningscenter Risoe. Risoe-R; No. 1200(EN)). General rights Copyright and moral rights for the publications made accessible in the public portal are retained by the authors and/or other copyright owners and it is a condition of accessing publications that users recognise and abide by the legal requirements associated with these rights. • Users may download and print one copy of any publication from the public portal for the purpose of private study or research. • You may not further distribute the material or use it for any profit-making activity or commercial gain • You may freely distribute the URL identifying the publication in the public portal ? If you believe that this document breaches copyright please contact us providing details, and we will remove access to the work immediately and investigate your claim. Risø-R-1200(EN) Failure Database and Tools for Wind Turbine Availability and Reliability Analyses The Application of Reliability Data for Selected Wind Turbines Igor Kozine, Palle Christensen and Martin Winther-Jensen Risø National Laboratory, Roskilde January 2000 Abstract The objective of this project was to develop and establish a database for collecting reliability and reliability-related data, for assessing the reliability of wind turbine components and subsystems and wind turbines as a whole, as well as for assessing wind turbine availability while ranking the contributions at both the component and system levels. The project resulted in a software package combining a failure database with programs for predicting WTB availability and the reliability of all the components and systems, especially the safety system. The report consists of a description of the theoretical foundation of the reliability and availability analyses and of sections devoted to the development of the WTB reliability models as well as a description of the features of the database and software developed. The project comprises analysis of WTBs NM 600/44, 600/48, 750/44 and 750/48, all of which have similar safety systems. ISBN 87-550-2732-6 ISBN 87-550-2731-8 (internet) ISSN 0106-2840 Information Service Department, Risø, 2000 Contents 1 Introduction 5 2 Objectives 5 3 Theoretical Foundation 6 3.1 3.2 3.3 3.4 3.5 3.6 Definitions 6 Failure Analysis Approaches 6 Assumptions for Reliability Modelling 7 Availability Analysis of Permanently Working Components and Systems 8 Reliability Analysis of Permanently Working Components and Systems 11 Reliability Analysis of Components and Systems Working on Demand 12 4 Reliability Analysis of the Safety System 13 4.1 4.2 4.3 4.4 4.5 Basic Concepts of Event Tree Analysis 13 Assumptions for the Safety System 13 Event Tree Construction 14 Aggregated Model for Calculating the Probability of SS Failure 17 System Reliability Modelling 18 5 Conceptual Database Structure and Capabilities 21 6 Logical Data Model 21 7 Security Features 23 8 User Manual 24 9 Notes for the System Developers 26 References 30 APPENDIX I 31 APPENDIX II 39 Appendix III 41 Appendix IV 44 Appendix V 45 Risø-R-1200(EN) 3 4 Risø-R-1200(EN) 1 Introduction Although Danish wind turbines (WTBs) are manufactured to very high standards, a permanent need exists for manufacturers to maintain performance records for the turbines they sell. This is no different from the situation with other types of quality goods. Such performance records facilitate the undertaking of reliability analyses for the preparation of performance documentation for use by the manufacturers’ research and development departments and potential new customers. Reliability analyses can also be used to predict the performance of new designs. In order to be able to predict the reliability of a system one needs a reliability model and information about component fault frequencies. Failure data are usually available in most companies in the form of repair reports. Reliability modelling is a well-known tool in other areas and was introduced in the wind turbine industry by the EFP project “Safety Systems for Wind Turbines: Method for Evaluation of Failure Modes and Reliability” initiated in 1994. This project focussed on WTB Safety Systems, i.e. the systems preventing the turbine from going into over-speed under accidental circumstances. A need remained, though, to extend these reliability considerations to the whole wind turbine with the additional aim of predicting its availability, i.e. its ability to produce electricity when wind speeds are adequate. The need to embrace the whole wind turbine – including the safety system – by a comprehensive reliability and availability analysis has necessitated revision and reconstruction of the database and software developed within the framework of the EFP project. The present project comprises analysis of WTBs NM 600/44, 600/48, 750/44 and 750/48, all of which have similar safety systems. As these types of WTB differ from those analysed in the EFP project, it was necessary to revise the previously developed reliability models and establish new ones. The project resulted in a software package combining a failure database with programs for predicting WTB availability and the reliability of all the components and systems, especially the safety system. The report consists of a description of the theoretical foundation of the reliability and availability analyses and of sections devoted to the development of the WTB reliability models as well as a description of the features of the database and software developed. Those who are not interested in the mathematical details and who focus on the analysis of the results can skip the theoretical part and proceed with the understanding of how to use the database. The project was carried out by Risø National Laboratory in collaboration with NEG-MICON A/S. Funding was provided by the Danish Energy Agency (Project No. 51171/97-0021). 2 Objectives The objective of this project was to develop and establish a database for collecting reliability and reliability-related data, for assessing the reliability of WTB components and subsystems and WTBs as a whole, as well as for assessing WTB availability while ranking the contributions at both the component and system levels. The reliability analysis supposes development of the necessary reliability models, i.e. event trees and fault trees. All the calculations need to be embedded into a software package which together with the database is self-sufficient in performing all the analyses laid down in the methodology of the software system. Different levels of access and security features need to be provided to exclude non-authorized access to the data and the calculation results. Risø-R-1200(EN) 5 3 Theoretical Foundation 3.1 Definitions The most widely accepted definition of reliability is the ability of an item (product, system, etc.) to operate under designated operating conditions for a designated period of time or number of cycles [1]. This ability can be designated in terms of probability, with reliability being defined as follows [2]: Reliability is the probability that a product or a system will perform its intended functions satisfactorily (i.e. without failure and within specified performance limits) at a certain time, for a specified length of time, operating under specified environmental and usage conditions. Availability analysis is performed to verify that an item has a satisfactory probability of remaining operational so that it can achieve its intended objectives. An item’s availability can be considered as a combination of its reliability and maintainability. When no maintenance or repair is performed, reliability can be considered as instantaneous availability [1]. The following two definitions can be employed when defining availability [2]: Availability is the probability that a product or system will operate satisfactorily at any point in time, where the total time considered includes operating time, active repair time, administrative time and logistic time. An alternative definition [3] is that: Availability is the probability that a system will perform a specified function or mission under given conditions at a prescribed time. Maintainability is the probability that a product or system will conform to specified conditions within a given period of time when maintenance action is performed according to prescribed procedures and resources. 3.2 Failure Analysis Approaches Systems analysis approaches vary depending on the complexity of the system, the diversity of possible failure scenarios, and factors such as reparability/nonreparability, on-demand or permanent operation, etc. The following four approaches can be used for failure analysis of WTBs: 1. With systems regarded as simple with nonrepairable components, the manner in which they function is portrayed by connecting the units in a reliability block diagram [3]. All reliability block diagrams are classified as either series, parallel, k-out-of-n or cross-linked structures. These systems can be in one of two states: either operational or failed. To some extent such reliability diagrams can also be employed with repairable systems to assess the probability of failures between two down states and mean time between failures, as well as probabilities characterizing random time between two failures. 2. As system repair is generally initiated after a system has failed, a system is either operational or under repair. Hence, knowledge of system reliability is of less interest than knowledge of the system availability [3]. An availability analysis provides a characterization of system behaviour, enabling some features of maintainability to be modelled. 3. In multicomponent systems, one can rarely apply approaches 1 and 2, however, primarily because the number of components is too great and the interrelationships between the different subsystems are less trivial. Fault tree analysis is a method whereby a large number of events that interact to produce other events can be related using simple logical relationships (AND, OR, etc.), thereby enabling methodical construction of a structure representing the system. 4. Some systems can require a more comprehensive analysis with the involvement of different external conditions such as wind speed, lightning strikes, etc., in which case event tree analysis is the appropriate technique for assessing the probabilities of possible outcomes. 6 Risø-R-1200(EN) 3.3 Assumptions for Reliability Modelling All the systems of a WTB can be classified as either permanently working or working on demand. Permanently working systems encompass all systems except the safety system (SS). When undertaking reliability analysis it is convenient to allocate a third category: safety-related systems. Failure of safety-related systems affects not only the ability of the WTB to produce electricity but also the performance of the SS. The systems in question are the generator, the driveline and the gearbox. The failure of any of these systems causes loss of the possibility to bring the WTB to a safe halt. The reliability analysis of these three categories has specific features that are examined below. The reliability and availability analyses are two different types of failure analysis, each reflecting a different facet of WTB performance. These two analyses are provided based on the data collected in the database. The availability analysis takes into account all the failures that affect the WTB’s ability to produce electricity due to the time spent on repairing the WTB. It does not allow for the frequency of failures. In general, when the average repair cost is a fraction of the initial equipment cost and the latter is high and the duration of down time affects the volume of production losses, one is interested in considering system repair. In such a system, time between failures, repair time and percentage of operating time in an interval are of more interest when analysing system performance. The availability function A(t) is defined as the probability that the system is operational at time t. In contrast, the reliability function R(t) is the probability that the system has operated over the interval 0 to t. If repair is not permitted, then A(t) reduces to system reliability R(t). The reliability analysis thus takes into account the frequency of failure without considering the time spent for recovering the failed components. In performing these analyses the following assumption is employed: Failure of any component of a WTB (except the components constituting the safety system) leads to the WTB being shut down for repair of the component, during which time the WTB remains idle. This assumption defines the structure of the reliability block diagram and the fault tree. All the components can thus be considered to be connected in series, i.e. the block diagram is a series structure and all the events in the fault tree are connected through OR gates (Figures 1 and 2). Thus the WTB fails if any of n components fail or if component 1 fails or component 2 fails and so on. WTB 1 2 3 n Figure 1. Reliability block diagram of a WTB, n is the number of components in the WTB Risø-R-1200(EN) 7 WTB Fails OR 1 2 3 n Figure 2. Fault tree for WTB failure The SS failure analysis is twofold. Firstly, some SS failures affect WTB performance through extending the repair time. Such failures can be revealed (1) when the SS is activated on demand, or (2) during a periodic test control. If there is a failure in the SS and the WTB can be brought to a safe halt the repair time spent on recovering the SS simply decreases the availability of the WTB, thus contributing to the total unavailability. Such failures are taken into account in the availability analysis. Secondly, some SS failures might affect the WTB’s ability to be maintained in a safe mode. Such failures are of particular interest and their likelihood must be analysed by means of reliability analysis conducted using event tree and fault tree analyses. 3.4 Availability Analysis of Permanently Working Components and Systems Let Tij represent the (random) length of the jth operating period having mean Tˆi for the ith component, and Dij the (random) length of the jth replacement having mean D̂i for the ith component, where j=1,2,…; i=1,2,…,n, and n is the number of components in the system under consideration. Figure 3 illustrates such an alternating sequence of operating and replacement periods. 1 0 Ti1 Di1 Ti2 Di2 Ti3 Time, t Figure 3. Alternating failure and repair for component i. 8 Risø-R-1200(EN) To assess WTB availability the model assumes the following: (a) The system is in series and a system failure thus coincides with a component failure. (b) During replacement of a failed component all other components remain in “suspended animation”. When replacement of the failed component is completed, the remaining components abstract operation. At that instant they are not “as good as new”, but only as good as they were when the system stopped operating. As t becomes large, the availability function reaches the following steady-state value [2]: n Dˆ A = 1 + ∑ i ˆ i =1 Ti −1 n λ = 1 + ∑ i i =1 µ i −1 (1) where λi and µi are the mean failure rate and repair rate of the ith component, respectively. It is known (see, for example [2]) – or can be inferred from (1) independently by inserting the asNi 1 sessments of Dˆ i ≈ 1 Dij and Tˆi ≈ ∑ Ni N i j =1 Ni ∑T j =1 ij , where Ni is the number of failures of the ith com- ponent during [0,T] – that the average availability of a system in [0,T] is the expected proportion of time the system is operating during [0,T], i.e. A= T op T (2) In the specific case of a WTB, we are also interested in the average availability, A, of WTBs of the same type, where A is defined as N WTB A= 1 N WTB N WTB ∑A i =1 i = 1 N WTB ∑ Ti op i =1 T N WTB = 1 N WTB ∑T i =1 T op i (3) where NWTB is the total number of WTBs of the same type and Ti op is the total operation time of the ith WTB within the interval [0,T]. Equation (3) is only really valid if all NWTB are put into operation at the same time 0 and are in operation until the present time. In reality this is not the case, as the various starting dates are generally different and some of the WTBs can be put out of operation completely. Equation (3) thus has to be rewritten A= 1 N WTB N WTB Ti op ∑ i =1 Ti (4) where Ti is the total calendar time worked by the ith WTB. Equation (4) is used to assess the average availability of specific types of WTB. Knowledge of the availability of each type of WTB will enable identification of the most unreliable specific WTBs. Availabilities Ai are ranked in order of increasing Ai starting from the lowest Ai. A specific WTB occupying the first place is the most unreliable as regards availability. In order to identify the most unreliable subsystems and components it is useful to determine the unavailability U represented as Risø-R-1200(EN) 9 U= N WTB 1 N WTB ∑U i =1 N WTB 1 1 ∑ i =1 Ti N WTB i = 1 N WTB N WTB Ti down 1 = WTB ∑ Ti N i =1 N −1 down 1 ∑ Tij + Tikdown = WTB j =1 N Sys N WTB N Sys 1 ∑ i =1 Ti ∑T down ij j =1 N WTB Tikdown 1 + WTB ∑ Ti N i =1 = N WTB 1 ∑ i =1 Ti N Sys −1 ∑T j =1 down ij , (5) where Ti down is the total down time due to failures of the ith WTB within interval [0,T], N Sys is the number of systems in a WTB of a certain type, Tijdown is the total down time due to failures of the jth system in the ith WTB. The term N WTB Tikdown was extracted from the average unavailability to ∑ Ti i =1 1 N WTB calculate the contribution to this reliability characteristic made by the kth system. Comparing two sysN WTB ∑T tems k and m, their contributions differ by the terms i =1 down ik N WTB and ∑T i =1 down im . When ranking the sys- N WTB tems’ contribution to unavailability it is thus sufficient to rank the terms ∑T i =1 down ik . Ranking the sys- tems according to the summary down time will portray the weakest systems with respect to their contribution to the unavailability. Ranking by systems might be not informative enough to show what design improvements would have the greatest effect on WTB availability. Identifying the weakest components in a particular type of WTB can thus be very useful when trying to identify the most effective improvements. A measure of the contribution at a component level can be introduced using the following unavailability representation, which is similar to equation (5) should be done: U= N WTB 1 N WTB Ti down 1 = WTB ∑ Ti N i =1 N WTB 1 ∑ i =1 Ti N Comp ∑T down ij j =1 = N WTB Timdown 1 + WTB ∑ Ti N i =1 1 N WTB N WTB 1 ∑ i =1 Ti N Comp −1 ∑T j =1 down ij , (6) where NComp is the number of components in a WTB and Tijdown is the total down time due to failures of the jth system in ith WTB. Unlike (5) the term 1 N WTB N WTB ∑ i =1 Timdown was extracted from the average Ti unavailability in order to be able to calculate the contribution made to the unavailability by the mth component. As with the system contribution, it can be inferred that in order to rank the components N WTB according to their contribution to the unavailability it is sufficient to rank the terms ∑T i =1 down im . Another useful ranking characteristic is that expressing the contribution to the unavailability made by the system components, namely: 1 N WTB 1 N 10 WTB N WTB Tikdown 1 = WTB ∑ Ti N i =1 N WTB down Timk 1 + WTB ∑ Ti N i =1 N WTB 1 ∑ i =1 Ti N WTB 1 ∑ i =1 Ti N kComp ∑T j =1 N kComp −1 ∑T j =1 down ijk down ijk , = 1 N WTB 1 Nk −1 down down + T T = ∑ ∑ ijk imk T i =1 i j =1 N WTB Comp (7) Risø-R-1200(EN) where N kComp is the number of components in the kth specific system, Tijkdown is the total down time caused by the jth component situated in the kth system in the ith WTB. Thus, the coefficient of relative component contribution to the unavailability of a system can be calculated as the component’s contribution to the availability divided by the system contribution: N WTB U C mk down Timk ∑ Ti =1 = NiWTB = Tikdown ∑ Ti i =1 N WTB ∑T i =1 N WTB down imk (8) ∑T i =1 down ik 3.5 Reliability Analysis of Permanently Working Components and Systems Reliability assessments are measures of the frequency of failure, but without taking into account repair time. They characterize individual properties of components without relating to the performance of the system of which they are a part. A usual way of representing reliability is through the failure rates. The general formula for assessing the failure rate of a component is: λ= N N ∑T (9) where N is the number of failures of a component during interval [0,T], and NΣ is the total number of components under observation. As regards WTBs, (9) can be rewritten N WTB λi = ∑N j =1 ij (10) N WTB M i T Σ where Nij is the number of failures of the ith component of the jth WTB, Mi is the number of similar components in one WTB, and TΣ is the total operational time worked by NWTB WTBs of a given type. The parameter TΣ can be calculated in different ways depending on the nature of the available data. If failure data are collected for all wind turbines in operation from the point they entered service, then Σ N WTB T = ∑t j =1 j , where tj is the total time of operation of the jth wind turbine of a given type. In our case, the failure data are collected from a fixed time in the past tPast, which supposes that some failures have not been reported and that these unreported periods of time have to be excluded. Moreover, different WTB life histories have to be taken into account when calculating the total operational time (see Fig. 4) expressed as Σ T = (t Pr es − t Past ) N WTB − N fWTB ∑ (t i =1 − ti ) − f Pr es N sWTB ∑ (t i =1 s i − t Past ) (11) where tPast is the date of the first failure reported in the database, NfWTB is the number of wind turbines removed from operation within the interval [tPast, tPres], NsWTB is the number of wind turbines entered into service within the interval [tPast, tPres]. The remaining variables are explained in Fig. 4. Risø-R-1200(EN) 11 5 4 3 2 1 t1s t2s t3s t1f tPast t4s t2f t5s t4f tPres time Figure 4. Possible wind turbine life history tis – time of initiation of the ith wind turbine operation, tif – the cessation of the ith operation, tPast – the time data collection was initiated, tPres – present time The reliability, Pi(t), of the ith component at time t can be defined as follows: Pi (t ) = exp(−λi t ) ≅ 1 − λi t When all the components are connected in series, the reliability of the WTB is calculated by the expression P(t ) = ∏ Pi (t ) = ∏ (1 − λi t ) i (12) i There might be some practical difficulty associated with the use of equation (10) due to the fact that some of the component failures might not occur within the analysed time interval and because equation (10) thus gives the failure rate as zero, i.e. the component is ideal from the reliability point of view. No component can ever be completely reliable, however, If no failures have been reported for a component, the lower reliability can be estimated on the basis of the conservative assumption that a failure might possibly take place within the next small time interval, i.e. Nij = 1. Since the upper limit is not known for this case one can hypothetically (optimistically) assume that Nij = 0. The lower and upper reliabilities can consequently be determined using equation (12) by employing optimistic and pessimistic assumptions. 3.6 Reliability Analysis of Components and Systems Working on Demand Subsystems and components constituting the SS are not operational all the time but need to be activated when there is a demand to halt the rotor or to maintain it in a safe mode. The probability that they will work on demand, ϖ i , is expressed as ϖi = λi ΛDem where λi is the failure rate of the ith subsystem or component, ΛDem is the average number of demands per year. λi is determined using equation (10). In the present case, the number of demands per year is defined as: 12 Risø-R-1200(EN) N Dem = λGrid loss + λGenerator + λ Drive line + λGearbox + λ ws > 25 , where λGrid loss , λGenerator , λ Drive line , and λGearbox are determined using equation (10), and λGrid loss and λws >25 are the average rates of grid loss and wind speed exceeding 25 m/s, respectively, determined from external sources. 4 Reliability Analysis of the Safety System 4.1 Basic Concepts of Event Tree Analysis Event trees are inductive logic methods for identifying the various possible outcomes of a given initiating event. The initiating event of an event tree is either a system failure or an external event that can end in an undesired outcome. The effect of an initiating event on a system depends on what might happen next and the sequence of occurrences. As a result, several possible scenarios can be developed that could possibly have severe impact on the system and the environment. From a theoretical point of view the probability that a specific system will fail is conditional on the initiating events. To analyse a SS, which is activated on demand, we have first to identify all possible initiating events. The probability of its failure can then be calculated as P ( SS ) = ∑ P( SS / I i ) P ( I i ) i where SS designates the failure of the SS and Ii is the ith initiating event. All the initiating events Ii together constitute the partitioning of the set of all possible initiating events. This means that P( I i ) = 1 , i.e. all possible initiating events are included in the analysis. Sometimes it is unrealistic ∑ i to consider all the events and instead only those making the greatest contribution to the final probability are taken into account. This is usual practice when analysing the reliability and risk of large-scale technical systems such as chemical plants or nuclear power plants. Initiating events can be considered under different external conditions (in our case – different wind speeds). In this case, we have to calculate the resultant probability conditional on all possible combinations of the initiating events and the conditions IiCj. The final equation for calculating the probability that the SS will fail is thus P( SS ) = ∑∑ P( SS / I i C j ) P( I i C j ) = ∑∑ P( SS / I i C j ) P( I i )P(C j ) j i j (13) i 4.2 Assumptions for the Safety System The mission of the SS is different from the rest of a WTB in that it is activated on demand in order to bring the WTB to a safe condition, i.e. one in which the rotor is either completely halted or is rotating at a permissible rotation speed. SS reliability can thus be defined as: The reliability of a WTB safety system is the probability that the safety system is able to bring the WTB to a safe condition on demand under given conditions for a specified time interval. As pointed out above, a characteristic of WTBs is that some of the components and systems are permanently operational and at the same time affect the performance of the SS. The components in question are the generator, the gearbox, and the driveline connecting the gearbox and the generator. When the demand arises to stop a WTB the generator connected to the electrical grid acts as an additional SS Risø-R-1200(EN) 13 subsystem and the reliability of the SS thus depends on the reliability of the SS. A failure of the gearbox affects the reliability of the SS such that rotation of the rotor cannot be halted by the grid connected to the generator and the mechanical brake cannot be engaged. Failure of the driveline disrupts the “grid–generator” connection, thereby increasing the probability of SS failure. Six groups of demands activating the SS can be identified: 1) a component failure in the WTB, 2) grid loss, 3) generator failure, 4) driveline failure, 5) gearbox failure, and 6) wind speed exceeding 25 m/sec. These events are assumed to be mutually exclusive, i.e. any two of them cannot happen simultaneously. This further implies that while the WTB is being brought to a stop state, the other initiating events (demands) cannot take place. This simplification is necessary to simplify the reliability models and is practically justifiable. Different weather conditions (wind speed) can require different functionality of the SS, and must therefore be taken into account when working out scenarios for possible SS failures. The following five wind speed ranges are chosen for the reliability analysis: 1) ws<5 m/s, 2) 5 m/s≤ws<10 m/s, 3) 10 m/s≤ws<20 m/s, 4) 20 m/s≤ws<25 m/s, and 5) ws≥25 m/s. The lowest range, ws<5 m/s, is of no interest in the present context since a WTB cannot experience over-speed under such conditions. The highest range, ws≥25 m/s, is regarded as an initiating event. The following six different scenarios will thus be analysed: Initiating event Wind speed Designation Component failure, I1 5 m/s≤ws<10 m/s, C1 10 m/s≤ws<20 m/s, C2 20 m/s≤ws<25 m/s, C3 I1C1 I1C2 I1C3 Grid loss, I2 5 m/s≤ws<10 m/s, C1 10 m/s≤ws<20 m/s, C2 20 m/s≤ws<25 m/s, C3 I2C1 I2C2 I2C3 Generator failure, I3 5 m/s≤ws<10 m/s, C1 10 m/s≤ws<20 m/s, C2 20 m/s≤ws<25 m/s, C3 I3C1 I3C2 I3C3 Drive-line failure, I4 5 m/s≤ws<10 m/s, C1 10 m/s≤ws<20 m/s, C2 20 m/s≤ws<25 m/s, C3 I4C1 I4C2 I4C3 Gearbox failure, I5 5 m/s≤ws<10 m/s, C1 10 m/s≤ws<20 m/s, C2 20 m/s≤ws<25 m/s, C3 I5C1 I5C2 I5C3 ws≥25 m/s, I6 I6 4.3 Event Tree Construction In working out the event trees we were concerned with identifying the sequences ending in SS failure states. Sequences that end in success states were therefore generally omitted. Since we are analysing 6 systems that might affect SS reliability, each of which can have two states (success and failure), the total number of states is 26=64. As only a few are failure states there is no need to depict them all. On the event trees shown in Appendix I, sequences ending in failure states are shown by bold lines with the logical function representation written above them. In this context, “AB” denotes that “the sequence takes place if system A is in a success state and system B is in a success state” while “ A B ” 14 Risø-R-1200(EN) denotes that “the sequence takes place if system A is in a success state and system B is in a failure state”. On the event trees, the systems involved are denoted as follows: A B Magnetic valve Pop-out valve system C 1 tip brake deploys D E F 2 tip brakes deploy 3 tip brakes deploy Mechanical brake It should be noted that the event trees for the initiating events “Grid loss”, “Generator failure” and “Driveline failure” will be identical because the occurrence of any of these events means that the WTB cannot be maintained in a safe mode by the “grid–generator” connection. In conclusion, it is only necessary to develop seven event trees to model the (un)reliability of the SS. Initiating event “Component failure” This initiating event implies that when there is a demand to stop a WTB due to a component failure in the WTB, both the generator and the grid are operational. Thus under all wind speeds (except ws≥25 m/s, which will be considered separately) the WTB will be kept safe by the generator connected to the electrical grid. Hence under these circumstances an undesired outcome will not occur and all the three conditional probabilities P ( SS / I i C j ) will be equal to zero. Initiating event “Grid loss”/“Generator failure”/“Driveline failure” and wind speed “5 m/s≤ ≤ws<10 m/s” To ensure WTB safety under these conditions it must be possible for either one tip brake to deploy or the mechanical brake to deploy. The event tree depicting all possible failure scenarios for initiating event “Grid loss” and condition “5 m/s≤ws<10 m/s” is shown in Appendix I, Fig. 1. It can be seen that there are 5 different ways to reach a failure state. The summarizing logical formula for failure of the SS is thus SS /I2C1 = ABC F OR ABC F OR ABC F OR AB F OR ABC F which can be simplified as SS /I2C1 = C F ( AB OR A B OR AB OR A B ) OR A B F Furthermore, the expression in parentheses is a certain event that takes place with a probability of 1 and hence can be omitted. The final canonical expression for failure of the SS is thus SS /I2C1 = F ( A B OR C ) (14) i.e. “the SS fails if the mechanical brake fails and the magnetic valve fails and the pop-out system fails, or one tip brake cannot deploy”. Initiating event “Grid loss”/“Generator failure”/“Driveline failure” and wind speed “10 m/s≤ ≤ws<20 m/s” To ensure WTB safety under these conditions it must be possible for either one tip brake to deploy and the mechanical brake to deploy or for two tip brakes to deploy. The event tree depicting all possible failure scenarios for the initiating event “Grid loss” and wind speed “10 m/s≤ws<20 m/s” is shown in Appendix I, Fig. 2. It can be seen that there are 6 different ways to reach a failure state. The summarizing logical formula for failure of the SS failure is thus Risø-R-1200(EN) 15 SS /I2C2 = ABC D F OR ABC OR ABC D F OR ABC OR AB D F OR AB with the corresponding final canonical expression being SS /I2C2 = AB OR C OR D F (15) i.e. “the SS fails if the magnetic valve fails and the pop-out system fails, or one tip brake cannot deploy, or two tip brakes cannot deploy and the mechanical brake fails”. Initiating event “Grid loss”/“Generator failure”/“Driveline failure” and wind speed “20 m/s≤ ≤ws<25 m/s” To ensure WTB safety under these conditions it must be possible for either two tip brakes to deploy and the mechanical brake to deploy or for three tip brakes to deploy. The event tree for this case is shown in Appendix I, Fig. 3. Under these conditions there are 7 possible undesired outcomes. The final canonical expression for failure of the SS is SS /I2C3 = AB OR D OR E F (16) i.e. “the SS fails if the magnetic valve fails and the pop-out system fails, or two tip brakes cannot deploy or three tip brakes cannot deploy and the mechanical brake fails”. Initiating event “Gearbox failure” and wind speed “5 m/s≤ ≤ws<10 m/s” To ensure WTB safety under these conditions it is sufficient that one tip brake can deploy. The other subsystems of the SS are not available. The event tree for this case is shown in Appendix I, Fig. 4. The final canonical expression for failure of the SS is SS /I5C1 = AB OR C (17) i.e. “the SS fails if the magnetic valve fails and the pop-out system fails, or one tip brake cannot deploy”. Initiating event “Gearbox failure” and wind speed “10 m/s≤ ≤ws<20 m/s” To ensure WTB safety under these conditions it must be possible for two tip brakes to deploy. The other subsystems of the SS are not available. The event tree for this case is shown in Appendix I, Fig. 5. The final canonical expression for failure of the SS is SS /I5C2 = AB OR C OR D (18) i.e. “the SS fails if the magnetic valve fails and the pop-out system fails, or one tip brake cannot deploy or two tip brakes cannot deploy”. Initiating event “Gearbox failure” and wind speed “20 m/s≤ ≤ws<25 m/s” To ensure WTB safety under these conditions it must be possible for three tip brakes to deploy. The other subsystems of the SS are not available. The event tree for this case is shown in Appendix I, Fig. 6. The final canonical expression for failure of the SS is 16 Risø-R-1200(EN) SS /I5C3 = AB OR C OR D OR E (19) i.e. “the SS fails if the magnetic valve fails and the pop-out system fails, or one tip brake cannot deploy, or two tip brakes cannot deploy, or three tips cannot deploy”. Initiating event “ws≥ ≥25 m/s” To ensure WTB safety at wind speeds exceeding 25 m/s it must be possible for three tip brakes to deploy. The event tree developed for this case is given in Appendix I, Fig. 7. The final canonical logical expression for the SS failure is SS /I4 = AB OR E (20) i.e. “the SS fails if the magnetic valve fails and the pop-out system fails, or three tip brakes cannot deploy”. 4.4 Aggregated Model for Calculating the Probability of SS Failure The effect of any of three initiating events I2 (Grid loss), I3 (Generator failure), and I4 (Coupling failure) is similar in the sense that the WTB loses one of the possibilities to be maintained in a safe mode by the connection “grid-generator”. The probability of SS failure can thus be expressed as P( SS ) = P( SS / I 2 OR I 3 OR I 4 ) + P( SS / I 5 ) + P( SS / I 6 ) (21) Each term in (21) is calculated on the basis of equations 14–20 as follows P( SS / I 2 OR I 3 OR I 4 ) = [ P( I 2 ) + P( I 3 ) + P( I 4 )][ P(C1 ) P( ABF OR CF ) + P(C 2 ) P( AB OR C OR DF ) + P(C 3 ) P( AB OR D OR EF )] P( SS / I 5 ) = P( I 5 )[ P(C1 ) P( AB OR C ) + P(C 2 ) P( AB OR C OR D) + P(C 3 ) P( AB OR C OR D OR E )] P( SS / I 6 ) = P( I 6 ) P( AB OR E ) In order to determine the final expression for calculating the probability that the SS will fail it is necessary to take into account the fact that the intersections of some of the events in the above expressions are not empty. The probabilities of those non-empty intersections must appear with a “minus” sign. Some of the intersecting events do not appear implicitly, i.e. C ∩ D = C (two tip brakes cannot deploy if none can deploy) and D ∩ E = D (all three tips cannot deploy if two cannot deploy either). The above conditional probabilities can be written as Risø-R-1200(EN) 17 P( SS / I 2 OR I 3 OR I 4 ) = [ P( I 2 ) + P( I 3 ) + P( I 4 )][ P(C1 )( P( A) P( B) P( F ) + P( C) P( F ) − P( F )) + P(C 2 )( P( A)P(B) + P( C ) + P( D) P( F ) − P( C ) P( F )) + P(C 3 )( P( A)P(B) + P( D) + P( E ) P( F ) − P( D) P( F ))] P( SS / I 5 ) = P( I 5 )[ P(C1 )( P( A) P( B) + P(C )) + P(C 2 )( P( A) P( B) + P( D)) + P(C 3 )( P( A) P( B) + P( E ))] P( SS / I 6 ) = P( I 6 )[ P( A) P( B ) + P( E )] The final expression for calculating the probability that the SS will fail is P( SS ) = [ P( I 2 ) + P( I 3 ) + P( I 4 )][ P(C1 )( P( A) P( B) P( F ) + P( C) P( F ) − P( F )) + P(C 2 )( P( A)P(B) + P( C ) + P( D) P( F ) − P( C ) P( F )) + P(C 3 )( P( A)P(B) + (22) P( D) + P( E ) P( F ) − P( D) P( F ))] + P( I 5 )[ P(C1 )( P( A) P( B) + P(C )) + P(C 2 )( P( A) P( B) + P( D)) + P(C 3 )( P( A) P( B) + P( E ))] + P( I 6 )[( P( A) P( B) + P( E )] Probabilities P (C ), P ( D ), and P ( E ) have to be calculated differently from the rest of the probabilities and we have to employ the binomial distribution of probabilities. P(C ) is the probability of an event where one tip brake cannot deploy. If we denote one tip brake failure by T and take into account that there are three tip brakes, then P(C ) = P(T ) 3 D is an event where two tip brakes cannot deploy. This event takes place if none of the tip brakes can deploy or any two out of the three tip brakes cannot deploy. Assuming binomial distribution, P( D) = P(T ) 3 + 3P (T ) 2 (1 − P(T )) E is an event where all three tip brakes cannot deploy together. This event takes place if none of the tip brakes can deploy, or any two of the three tip brakes cannot deploy, or all three tip brakes cannot deploy simultaneously. Thus, P( E ) = P(T ) 3 + 3P(T ) 2 (1 − P(T )) + 3P(T )(1 − P(T )) 2 4.5 System Reliability Modelling Some of the events in equation (22) are trivial and their probabilities can be defined directly from the data collected in the database, or, in the case of wind conditions, from external sources of information. These events or conditions do not need to be broken down and no failure models are required for them. The probability of the grid loss, P(I2), and probabilities P(C1), P(C2), and P(C3) thus cannot be determined from the data stored in the database, but only from other data, and hence have to be stored in the database in the form of constants that can be periodically updated when more precise data become available. 18 Risø-R-1200(EN) Generator failure, P(I3) The generator consists of the following components, the failure of each of which will cause generator failure: Bolte RPM sensor Støddæmper Kobling Lejer Temperatursensor Terminaler Kabler Slanger Pumpe Vanddækning From the reliability standpoint, all of the components are connected in series, i.e. the generator fails if the “bolte” fails or “RPM sensor” fails or the “støddæmper” fails, etc. The probability of generator failure is thus P(Generator failure ) = 1 - P(bolte) × P(RPM sensor) × P(støddæmper) ×…, (23) where all the terms are the probabilities that the individual components are in non-failure state. Gearbox failure, P(I5) The gearbox consists of the following components, the failure of each of which will cause generator failure: Bolte Støddæmper Split bushing Lejer, pakninger Olie Suspension Temperatursensor Oliekøler Olievarmer Overtryksventil Slanger Slæbering Pumpe The probability of gearbox failure is thus calculated using an equation similar to equation (23). Risø-R-1200(EN) 19 Mechanical brake failure, P( F ) The mechanical brake consists of the following components, the failure of each of which will cause generator failure: Bolte Bremseskiver Bremseklodser Filter Hydraulikstation Hydraulikslanger Ikke-returnventil Magnetventil Motor Microswitch Olie Overløbssventil Trykswitch Bremsescoop Akkumulator The probability of mechanical brake failure is thus calculated using an equation similar to equation (23). Tip brake failure, P( T ) A tip brake consists of the following components, the failure of each of which will cause generator failure. Bolte Vinge tip guides Vinge cylinder Vinge tip spring Vinge tip Vinge root Wire Surface Forkant/bagkant Sensor Lynbeskyttelse Hydraulic system, P ( A) and P ( B ) The deployment of the tip brakes is activated by the hydraulic system. To enable the tips brakes to deploy oil must flow through either the magnetic valve (Appendix II, Position 13) or the pop-out system (Appendix II, Positions 19 and 55). These are considered independent subsystems of the SS. The magnetic valve is processed in the database as one component and valve failure is designated A. The pop-out system is processed in the database as a two-component system that is considered to be in a state of failure if the “Sikkerhedsventil pop-out” fails and the “Sprængblik” fails, i.e. the components are connected in parallel from the reliability standpoint. This system failure is designated by B. 20 Risø-R-1200(EN) 5 Conceptual Database Structure and Capabilities Now that all the calculations necessary for the availability and reliability analyses have been defined and the event and fault trees developed, the database structure and capabilities can be defined. The following options are provided by the database: 1. Availability analysis Assessment of the average availability of a certain type of WTB and ranking of all specific WTBs within a certain type sample according to availability. Assessment of the contribution made by system unavailability to the average unavailability of a certain type of WTB and ranking the systems according to their contribution to unavailability. Assessment of the contribution made by component unavailability to the average unavailability of a certain type of WTB and ranking the components according to their contribution to unavailability. Assessment of the contribution made by component unavailability to the unavailability of the system to which the component belongs and ranking of the components according to their contribution to system unavailability. Assessment of interannual variation in availability. 2. Information services (data analysis) Screening, convoluting and reporting information in accordance with user requirements at the Component level, System level, and Whole WTB level 3. Reliability analysis • Reliability assessments of all components and systems and the reporting of them • Reliability analysis of the SS subsystems and the SS as a whole • Reliability analysis of the safety-related systems 6 Logical Data Model In order to meet the objectives and theoretical requirements, three basic tables (Tables 1-3) and several subsidiary tables were created (Appendix III). The basic tables comprise the actual database and contain the basic information needed to make a decision on WTB performance, especially availability and reliability. The main reason for dividing the database into a series of tables is to avoid the redundancy in the data. The links between tables are provided by Primary and Foreign keys. The table fields contain the option codes in those cases where it has been possible to classify them but not full names and definitions. Thus for the fields “System, Component, Failure causes, Detection methods, Responsibility, WTB modes” (see Table 1), all the options can be foreseen in advance and classified. The codes for these fields are consequently short. The decoding tables for these fields are the subsidiary tables. Except for the decoding function, these serve as menu options under data entry. Each type of WTB has its own set of three basic tables and separate entrance, i.e. a separate database. Risø-R-1200(EN) 21 Tables 2-3 were mainly created to provide for quantitative reliability calculations. The field “Date s f of start” thus contains numbers for t i (2), “Date of finish” for t i (2), and “Test interval” for assessing the (un)availability of periodically inspected components, “Number” for mi (1). The number of wind turbines in question, NWTB, is equal to the number of records in the WTB table. Foreign 1 Rec. no. 1 Main Table Foreign key 2 WTB ID Table 1 key 3 System 4 5 6 7 8 9 10 11 12 Component Comp ID Date kWh Work order Who made WTB mode Repair time Repair man j 13 Failure cause WTB Table Primary key 1 WTB ID 2 Date of start 14 15 Detect. method Responsibility 16 Repair action 17 Remark Table 2 3 Date of finish record 1 record k Component Table Primary key 1 Component 2 Component name 3 System Table 3 4 Test interval 5 Number 6 Price record 1 record n 22 Risø-R-1200(EN) 7 Security Features The database is secured and access to it requires a user account and a password. The security system encompasses both group accounts and user accounts. Each user account must belong to a group account. There are default user and group accounts and newly created user and group accounts. The following group accounts are relevant for the security of the current database: Groups: Admins (default) Users (default) NotAdmin Typists The user accounts are as follows: Users Member of group Admin (default) Users (default) Administrator Admins Users (default) Analyst NotAdmin Users (default) Typist1 Typists Users (default) The permitted operations within each group account are as follows: Group Not Admin Typists Permitted operations Tables:* Read Design Read Data Queries (all): Read Design Read Data Forms (all): Open/Run Reports (all): Open/Run Macros (all): Open/Run Modules (all): Open/Run Read Design Tables (all): Read Design Read Data Insert Data Forms (Components, Form0, Form1, Main Table, WTB) Open/Run Macros (all): Open/Run Read Design Risø-R-1200(EN) 23 *Some tables have more permitted operations, which are created and deleted when running the reliability calculations. These tables are not the objects of the logical model.Only one table “WTB” can be changed by a “NotAdmin” group user. These extra permitted operations are necessary to enable insertion of the current data into the field “Date of Finish” and to enable calculation of the total working experience. The “Admin” group is the default group. The “Administrator” group is not listed in the table of permitted operations since all operations are permitted, especially the assignment of new group and user accounts and the granting of permitted operations. The security system is organized in such a way that information about groups, users, registration IDs and passwords is saved in the workgroup information file. This file must be used with the database in order to be able to gain access to it. The current valid workgroup information file is RELIAB.MDW. When it was created, the following information was incorporated: Name: Wind Turbines Organization: NEG MICON Workgroup ID: Reliab. For more about the workgroup information file and the security system see Appendix IV or Help in MS Access. The current security settings are listed below. It is necessary to know them in order to be able to gain access and change them in the future. Newly created groups and users: Group: NotAdmin Registration ID: 999999 Group: Typists Registration ID: 111111 Administrator: Reg. ID: Igor Password: Kozine Analyst: Reg. ID: Palle Password: 123456 Typist1: Reg. ID: Lise Password: 234567 It should be remembered that the passwords and security data are case-sensitive. 8 User Manual The database interface is self-contained in the sense that it is not necessary to use the Access toolbars but it is sufficient to use the command buttons on the forms created. The structure of the interface is uncomplicated and hence does not need to be described in detail. Some general notes on the options provided are given below. The database is divided into two parts: Data Tables and Analyses. “Data Tables” allows viewing, editing and data insertion in the tables “Main Table”, “Components” and “WTB”, the contents of which have been described above in Section 5 “Logical Data Model”. These tables store all the information used in reliability analyses as well as some reliabilityrelated data. 24 Risø-R-1200(EN) The option “Analyses” offers three suboptions: 1) Data Analysis, 2) Availability Analysis, and 3) Reliability Analysis. The option structure of “Data Analysis” is as follows: Specific WTB & Component WTB ID Specific WTB, all components WTB ID Component Component All WTBs, all components Specific component Component Data Analysis All WTBs System Specific WTB All WTBs WTB Specific WTB The result of any of the options is a report consisting of predefined data selected from the database. For example, the result of the option “Data Analysis – System – All WTBs” is a report such as shown on the following page. The other options represent similar reports depending on the request. The option structure of “Availability Analysis” is as follows: 1 Dynamic 2 All WTBs Availability Analysis 3 Systems 4 Component 5 System → Component Option 1 “Dynamic” presents the average availability of the whole sample of WTBs by year, i.e. the option provides the possibility to see the interannual variation in availability. Option 2 “All WTBs” provides a summarizing report of the average availability of the type of WTB in question and the unavailability of each WTB within the type. The WTBs are ordered by their unavailabilities starting with the most unreliable WTB. Options 3, 4, and 5 provide the user with reports showing the contributions to the unavailability of 3) all the systems, 4) all the components reported in the database, and 5) all the components constituting a specified system. The option structure of “Reliability Analysis” is as follows: Risø-R-1200(EN) 25 Generator Gearbox Driveline Steering System External Event Nacelle Reliability Analysis WTB Reliability Tower SS Reliability Print Board Yawing System Main Shaft Cover The option “External Event” does not perform any calculations and is an information option informing the user of the rates of the external events used in the SS reliability calculations. These rates can be subject to periodic correction if more precise data become available. The option “WTB Reliability” calculates the reliability of any WTB system excluding the SS. Clicking any of the system name buttons will initialize the chain of the resulting reliability assessments of all the components constituting the system and the system as a whole. The option “SS Reliability” calculates the reliability on demand for all the subsystems of the SS and the SS as a whole. 9 Notes for the System Developers The relationships between the objects in the database are generally uncomplicated and the developer familiar with the basics of MS Access will easily be able to trace most of the actions performed. Nevertheless, there are some chains of related actions that can be difficult to fathom. The most complicated operations are those carried out for the reliability analyses. All the objects involved in these calculations are described below. 26 Risø-R-1200(EN) Option “Reliability Analysis → WTB Reliability → Generator” activates the following sequence of actions: MS Access Object Description Macro: Macro Generator Reliability DeleteObject: Table “Tab Gen Failure” RunCode: DateOfFinishEqualNow() OpenQuery: Query Gen Failure RunCode: Generator() OpenReport: Report Gen Failure RunCode: DateOfFinishOriginal() Table: Tab Gen Failure A subsidiary intermediate table deleted and recreated prior to each analysis. Code: DateOfFinishEqualNow() Inserts into the “WTB” table “Date of Finish” field the current date for those WTBs that are in operation at the time of the analysis. Action is needed for the calculation of the net working experience (years). Make-Table Query: Query Gen Failure Creates the table “Tab Gen Failure” based on the table “Components” and the select query “Query Gen Comp Failure”. Query: Query Gen Comp Failure Selects the generator component failures from the “Main Table”. Counts the number of failures for each of the components. Code: Generator() Based on the table “Tab Gen Failure” and the query “WTB Total Time”, this code calculates the reliabilities of all the generator components and the generator as a whole and transfers the results to the table “Tab Gen Failure”. Query: WTB Total Time Counts the number of WTBs under observation and listed in the table “WTB” and the net working experience accumulated by all the WTBs. Report: Report Gen Failure Reports all the calculated reliabilities and shows them on the screen. Is based on the table “Tab Gen Failure” Code: DateOfFinishOriginal() Restores the “WTB” table “Date of Finish” field to its original state. The current dates for those WTBs that are in operation at the time of the analysis. The listed sequence of the actions is repeated each time the user makes a request and is similar for each of the following systems: Generator, Gearbox, Driveline, Steering system, Nacelle, Tower, Print board, Yawing system, Main shaft, and Cover. The differences lie in the names of some of the objects, which clearly indicate what system they are related to. In the case of the gearbox, for example, the names are “Macro Gearbox Reliability”, “Tab Gear failure”, “Query Gear Failure”, “Gearbox()”, and “Report Gear Failure”. The reliability calculations for the Safety System and its subsystems are carried out differently. Risø-R-1200(EN) 27 MS Access Object Description Macro: Macro SS Rates RunMacro: Macro Brake Reliability RunMacro: Macro Magnet Reliability RunMacro: Macro Pop-Out Reliability RunMacro: Macro Tips Reliability RunMacro: Macro Demand Rates RunCode: SSRates() OpenReport: Report SS Subsystems Macro: Macro Brake Reliability DeleteObject: Table “Tab Brake Failure” RunCode: DateOfFinishEqualNow() OpenQuery: Query Brake Failure RunCode: MechanicalBrake() RunCode: DateOfFinishOriginal() Table: Tab Brake Failure A subsidiary intermediate table deleted and recreated prior to each analysis. Code: DateOfFinishEqualNow() Inserts into the “WTB” table “Date of Finish” field the current date for those WTBs that are in operation at the time of the analysis. Action is needed for the calculation of the net working experience (years). Make-Table Query: Query Brake Failure Creates the table “Tab Brake Failure” based on the table “Components” and the select query “Query Brake Comp Failure”. Query: Query Brake Comp Failure Selects the mechanical brake component failures from the “Main Table”. Counts the number of failures for each of the components. Code: MechanicalBrake() Based on the table “Tab Brake Failure” and the query “WTB Total Time” the code calculates the failure rates of all the components of the mechanical brake and the system as a whole and transfers the results to the table “Tab Gen Failure”. The results are intermediate and do not take into account the demand rates. Code: DateOfFinishOriginal() Restores the “WTB” table “Date of Finish” field to its original state. The current dates for those WTBs that are in operation at the time of the analysis are deleted. The macros “Macro Magnet Reliability”, “Macro Pop-Out Reliability”, and “Macro Tips Reliability” are similar in structure to “Macro Brake Reliability”, which is described above. The differences lie in the names of the objects, which are related to the names of the subsystems and are easily recognisable. Macro: Macro Demand Rates Since the failure of the generator, the gearbox, and the driveline are considered initiating events for activation of the SS, their failure rates are regarded as demand rates additional to the grid loss and wind speed >25 m/s. This macro activates all the actions needed to calculate the total demand rate. 28 DeleteObject: Table “Tab Drive Failure” DeleteObject: Table “Tab Gear Failure” DeleteObject: Table “Tab Gen Failure” RunCode: DateOfFinishEqualNow() OpenQuery: Query Drive Failure OpenQuery: Query Gear Failure OpenQuery: Query Gen Failure RunCode: DemandRate() RunCode: DateOfFinishOriginal() Risø-R-1200(EN) Table: Tab Drive Failure A subsidiary intermediate table deleted and recreated prior to each analysis. Tables “Tab Gear Failure” and “Tab Gen Failure” have the same design as “Tab Drive Failure” and finally will keep the results of the calculations of their failure rates. Code: DateOfFinishEqualNow() See above Make-Table Query: Query Drive Failure Creates the table “Tab Drive Failure” based on the table “Components” and the select query “Query Drive Comp Failure”. Query: Query Drive Comp Failure Selects the driveline component failures from the “Main Table”. Counts the number of failures for each of the components. Queries “Query Gear Failure” and “Query Gen Failure” have the same design as “Query Drive Failure”. Code: DemandRate() Based on the tables "Tab Gen Failure", "Tab Gear Failure", "Tab Drive Failure", and “External Events” and the query "WTB Total Time". Calculates the total demand rate and transfers the results to the table “Demand Rates”. Code: DateOfFinishOriginal() See above Code: SSRates() Based on the tables "Tab Brake Failure", "Tab Magnet Failure", "Tab Pop-Out Failure", "Tab Tips Failure", “External Events”, "SS Subsystem Reliab" and “Demand Rates”. Calculates the reliabilities of the SS subsystems and the SS as a whole on demand and transfers the results to the table "Tab SS Reliability". Report: Report SS Subsystems Reports the results of the SS reliability calculations based on the table "SS Subsystem Reliab". All the objects in the database are interlinked and any changes in the design will lead to failure of some of the connected actions. Only the content of the Tables 1, 2, 3 and those shown in Appendix III and the table “External Events” can be changed. The table “External Events” can be periodically updated when more precise data become available. The contents of all the other tables cannot be changed. An exception is the table “Components”. The components “Magnetventil”, “Sikkerhedsventil popout” and “Sprængblik” are referred to via their IDs in the queries “Query Magnet Comp Fail”, “Query Magnet Failure”, “Query Pop-Out Fail” and “Query Pop-Out Failure”. If due to some reason their ID numbers get changed, proper corrections must be done in the queries. Risø-R-1200(EN) 29 References 1. M. Modarres. What every engineer should know about reliability and risk analysis. Marcel Dekker, 1993. 2. L. Rademakers et al., Reliability Analysis Methods for Wind Turbines. Task 1 of the project: Probabilistic Safety Assessment for Wind Turbines. 3. N. J. McCormick. Reliability and Risk Analysis. Academic Press. 1981. 30 Risø-R-1200(EN) APPENDIX I Event Trees for Wind Turbine Failure States Risø-R-1200(EN) 31 Figure 1. Event tree for initiating event “Grid loss” and condition “5 m/s≤ws<10 m/s” Component failure A Oil flow by control system B Oil flow by centrifugal C 1 tip brake deploys D 2 tip brakes deploy E 3 tip brakes deploy F Mechanical brake Sequence formula ABC F A BC F ABC F AB F A BC F Success state Failure state Figure 2. Event tree for initiating event “Grid loss” and condition “10 m/s≤ws<20 m/s” Component failure A Oil flow by control system B Oil flow by centrifugal C 1 tip brake deploys D 2 tip brakes deploy F Mechanical brake Sequence formula ABC D F ABC A BC D F A BC ABC D F AB Figure 3. Event tree for initiating event “Grid loss” and condition “20 m/s≤ws<25 m/s” Component failure A Oil flow by control system B Oil flow by centrifugal D 2 tip brakes deploy E 3 tip brakes deploy F Mechanical brake Sequence formula ABD E F AB D A BD E F AB D ABD E F AB D AB Figure 4. Event tree for initiating event “Gearbox failure” and condition “5 m/s≤ws<10 m/s” Component failure A Oil flow by control system B Oil flow by centrifugal C 1 tip brake deploys D 2 tip brakes deploy E 3 tip brakes deploy Sequence formula ABC A BC ABC AB Figure 5. Event tree for initiating event “Gearbox failure” and condition “10 m/s≤ws<20 m/s” Component failure A Oil flow by control system B Oil flow by centrifugal C 1 tip brake deploys D 2 tip brakes deploy E 3 tip brakes deploy Sequence formula ABC D ABC ABC D ABC ABC D ABC AB Figure 6. Event tree for initiating event “Gearbox failure” and condition “20 m/s≤ws<25 m/s” Component failure A Oil flow by control system B Oil flow by centrifugal C 1 tip brake deploys D 2 tip brakes deploy E 3 tip brakes deploy Sequence formula ABCD E ABC D ABC ABCD E ABC D ABC ABCD E ABC D ABC AB Figure 7. Event tree for initiating event “ws≥25 m/s” ws≥25 m/s A Oil flow by control system B Oil flow by centrifugal E 3 tip brakes deploy Sequence formula AB E AB E AB E AB APPENDIX II Diagram of the Hydraulic System Risø-R-1200(EN) 39 40 Risø-R-1200(EN) Appendix III Subsidiary Tables Providing the System and Component Codes Risø-R-1200(EN) 41 Code S1 Net Styring S2 S3 S4 S5 S6 S7 S8 S9 S10 S11 S12 S13 S14 S15 S16 S17 S18 S19 S20 S21 Relækort Transformerkort TAC-Computer WP3000 WP2060 Kommunikation Nødstop Maksimalafbryder Relæer/kontaktorer Multistik Modem Lynbeskyttelse Brokopling Fasebatteri E-prom Motorværn Kontaktor Thyristor Sikringer Program Code N1 N2 N3 N4 N5 N6 Nacelle Bolte Vibrationssensor Topboks Kabler Kabeaflastnig Multistik Code B1 B2 B3 B4 B5 B6 B7 B8 B9 B10 B11 B12 B13 B14 B15 Mekanisk bremse Bolte Bremseskiver Bremseklodser Filter Hydraulikstation Hydraulikslanger Ikke-returnventil Magnetventil Motor Micro switch Olie Overløbssventil Trykswitch Bremsescoop Akkumulator Code V1 V2 V3 V4 V5 V6 V7 V8 V9 V10 V11 Vinger Bolte Vinge tip guides Vinge cylinder Vinge tip spring Vinge tip Vinge root Wire Surface Forkant/bagkant Sensor Lynbeskyttelse 42 Code T System Tårn S Styring P Printkort K Krøjesystem N Nacelle H Hovedaksel G Gearkasse B Makanisk Bremse D Tårn Code T1 T2 T3 T4 Bolte Laskeplader Snoede kabler Kabler Code P1 P2 P3 P4 Printkort RC-enhed Temperaturmodul Transformer Triggerkort Code K1 K2 K3 K4 K5 K6 K7 K8 Krøjesystem Krøjegear Bremse Lejer, pakninger Motor Tænder Sensor Aftasterlade Smørenipler Driveline Code G1 G2 G3 G4 G5 G6 G7 G8 G9 G10 G11 G12 G13 Gearkasse Bolte Støddæmper Split bushing Lejer, pakninger Olie Suspension Temperatursensor Oliekøler Olievarmer Overtryksventil Slanger Slæbering Pumpe E Generator Code D1 D2 D3 Driveline Bolte Kardanaksel Kobling I Inddækning Code I1 I2 I3 I4 Inddækning Luft cirkulation Vindfane Anemometer Temperatursensor A Nav Code A1 Nav Bolte R Rotor hydraulik V Vinger Code H1 H2 H3 H4 H5 H6 H7 H8 H9 H10 H11 Hovedaksel Bolte RPM sensor beslag Carbon bøsning Lejer, pakninger RPM sensor Slip ring Olie/fedt pumpe Hovedleje Klemmeelement Smørenipler Kobberbørste Code E1 E2 E3 E4 E5 E6 E7 E8 E9 E10 E11 Generator Bolte RPM sensor Støddæmper Kobling Lejer Temperatursensor Terminaler Kabler Slanger Pumpe Vanddækning Code R1 R2 R3 R4 R5 R6 R7 R8 R9 R10 R11 R12 R13 R14 Rotor Hydraulik Bolte Filter Hydraulikstation Hydraulikslanger Ikke returnventil Magnetventil Microswitch Olie Overløbsventil Tryk switch Sikkerhedsventil-pop out Accumulator Sprængblik Kabler Risø-R-1200(EN) Repair Action Code 1 2 Name Genanvendes 3 Genstartet via remote Genstartet i Vindmøllen 4 5 6 7 8 9 10 11 12 13 14 15 16 Hejsning Inspiceret Installeret Justeret Påført Påfyldt Renset Samling Spændt Udført Udluftet Udskiftet Repareret Detection Method 1 2 3 4 5 6 7 Name Planned maintenance Operator Overspeed Vibration Inverter temperature Inverter control Grid failures Risø-R-1200(EN) Responsibility Code 1 2 3 4 5 6 Name Konstruktion og udvikling Indkøb Montage Produktion Garanti-service Service Failure Causes Code A B C D E F G H I J K L M N O P Q R S T U V X Y Z Name Brandt Defekt Defekt/Lynnedslag Kontrolleret For stor Irret Knækket Justeret Løs Løbskørsel Monteret Rengjort Pitchet Renoveret Revnet Rusten Sidder fast Slidt Støjer Ude af justering Udført Udtaget Udskiftet Udluftet Utæt 43 Appendix IV Creating a new Microsoft Access workgroup information file When you install Microsoft Access, the Setup program automatically creates a Microsoft Access workgroup information file that is identified by the name and organization information you specify. Because this information is often easy to determine, it is possible for unauthorized users to create another version of this workgroup information file and consequently irrevocably assume the permitted operations of an administrator account (i.e. an Admins group user) in the workgroup defined by that workgroup information file. To prevent this, you should therefore create a new workgroup information file and specify a workgroup ID (WID). Thereafter only persons knowing the new WID will be able to create a copy of the workgroup information file. 1. Exit Microsoft Access. 2. To start the “Workgroup Administrator”, do one of the following, depending on which operating system you are using: • If you are using Windows 95, use “My Computer” or “Windows Explorer” to open the “System” subfolder in the Windows folder, and then double-click “Wrkgadm.exe”. • If you are using Windows NT Workstation 4.0, use “My Computer” or “Windows Explorer” to open the “System32” subfolder in the WinNT folder, and then double-click “Wrkgadm.exe”. • If you are using Windows NT Workstation 3.51, open “Program Manager”, and then double-click the “Workgroup Administrator” icon in the program group where you installed Microsoft Access. 3. In the “Workgroup Administrator” dialogue box, click “Create”, and then type your name and organization. 4. In the “Workgroup Owner Information” dialogue box, type any combination of up to 20 numbers and letters, and then click “OK”. Caution: Be sure to write down your exact name, organization, and workgroup ID, carefully distinguishing between upper-case and lower-case letters for all three entries and store the information in a safe place. If you have to re-create the workgroup information file, you must supply exactly the same name, organization, and workgroup ID. If you forget or lose these entries, you cannot recover them and might lose access to your databases. 5. Type a new name for the new workgroup information file, and then click “OK”. (By default, the workgroup information file is saved in the folder where you installed Microsoft Access. To save in a different location, type a new path or click “Browse” to specify the new path). The new workgroup information file is used the next time you start Microsoft Access. Any user and group accounts or passwords you create are saved in the new workgroup information file. To have others join the workgroup defined by your new workgroup information file, copy it to a shared folder (if you did not already save it in a shared folder in step 4), and then have each user run the “Workgroup Administrator” to join the new workgroup information file. 44 Risø-R-1200(EN) Appendix V Glossary of WTB construction and maintenance terms Aftasteplade Akkumulator Anemometer Bolte Bremse Bremseklodser Bremsescoop Bremseskive Brokobling Brændt Carbon bøsning Kardanaksel Defekt Defekt/Lynnedslag Fasebatteri Filter For stor Forkant/bagkant Garanti-service Gearkasse Genanvendes Genstartet i vindmøllen Genstartet via remote Hejsning Hovedaksel Hovedleje Hydraulikslanger Hydraulikstation Ikke-returventil Inddækning Indkøb Inspiceret Installeret Irret Justeret Kabelaflastning Kabler Klemmeelement Knækket Kobberbørste Kobling Kommunikation Konstruktion og udvikling Kontaktor Kontrolleret Krøjegear Krøjesystem Risø-R-1200(EN) Accumulator Anemometer Bolts Brake Brake shoes Brake scoop Brake disc Bridge coupling Burnt Carbon bushing Cardan shaft Defective Defective/Struck by lightning Phase battery Filter Too large Front edge/back edge Warranty service Gear box To be reused Restarted in the wind turbine Restart via remote Hoist Main shaft Main bearing Hydraulic hoses Hydraulic station Non return valve Cover Purchase dept. Inspected Installed Corroded Adjusted Cable relief Cables Clamp Broken Copper brush Coupling Communication Construction and development Power relay Controlled Yawing gear Yawing system 45 Laskeplader Lejer Lejer, pakninger Luftcirkulation Lynbeskyttelse Løbskkørsel Løs Magnetventil Maksimalafbryder Montage Monteret Motorværn Multistik Nacelle Nav Net Nødstop Olie Olie/fedt pumpe Oliekøler Olievarmer Overløbsventil Overtryksventil Pitchet Produktion Pumpe Påfyldt Påført RC-enhed Relæer/kontaktorer Relækort Rengjort Renoveret Renset Repareret Revnet Rotor Hydraulik RPM sensor beslag Rusten Samling Sidder fast Sikkerhedsventil-pop out Sikringer Slanger Slidt Slip ring Slæbering Smørenipler Snoede kabler Sprængblik Spændt Støddæmper Støjer 46 Fish plate Bearings Bearing seal Air circulation Lightning protection Over-speed Loose Magnet valve Maximum circuit breaker Mounting Mounted Protective motor relay Multipin connector Mains Emergency stop Oil Oil/grease pump Oil cooler Oil heater Overflow valve Pressure valve Pitched Production Pump Filled Placed RC unit Relays/Power relays Relay card Cleaned Renovated Cleaned Repaired Fracture Rotor hydraulics RPM sensor mounting Corroded Connection Stuck Safety valve, pop-out Fuses Hoses Worn out Slip ring Slip ring Grease nipples Twisted cables Tensioned Shock absorber Noisy Risø-R-1200(EN) TAC-computer Temperaturmodul Temperatursensor Terminaler Topboks Transformerkort Triggerkort Trykswitch Tænder Ude af justering Udført Udluftet Udskiftet Udtaget Utæt Vanddækning Vibrationssensor Vindfane Vinge cylinder Vinge root Vinge tip Vinge tip guides Vinge tip spring Wire WP2060 WP3000 Risø-R-1200(EN) TAC computer Temperature module Temperature sensor Terminals Top box Transformer card Trigger card Pressure switch Teeth Out of adjustment Carried out Ventilated Exchanged Removed Leaky Water cover Vibration sensor Wind vane Wing cylinder Wing root Wing tip Wing tip guides Wing tip spring Wire WP2060 WP3000 47 Bibliographic Data Sheet Risø-R-1200(EN) Title and authors Failure Database and Tools for Wind Availability and Reliability Analyses Igor Kozine, Palle Christensen and Martin Winther-Jensen ISBN ISSN 87-550-2732-6 87-550-2731-8 (internet) 0106-2840 Department or group Date Systems Analysis Department Safety, Reliability and Human Factors (SPM) January 2000 Groups own reg. number(s) Project/contract No(s) 1210066 Pages Tables Illustrations References 47 6 11 3 Abstract (max. 2000 characters) The objective of this project was to develop and establish a database for collecting reliability and reliability-related data, for assessing the reliability of wind turbine components and subsystems and wind turbines as a whole, as well as for assessing wind turbine availability while ranking the contributions at both the component and system levels. The project resulted in a software package combining a failure database with programs for predicting WTB availability and the reliability of all the components and systems, especially the safety system. The report consists of a description of the theoretical foundation of the reliability and availability analyses and of sections devoted to the development of the WTB reliability models as well as a description of the features of the database and software developed. The project comprises analysis of WTBs NM 600/44, 600/48, 750/44 and 750/48, all of which have similar safety systems. The database was established with Microsoft Access Database Management System, the software for reliability and availability assessments was created with Visual Basic. Available on request from Information Service Department, Risø National Laboratory, (Afdelingen for Informationsservice, Forskningscenter Risø), P.O.Box 49, DK-4000 Roskilde, Denmark. Telephone +45 4677 4004, Telefax +45 4677 4013 Figure 1. Event tree for initiating event “Grid loss” and condition “5 m/s≤ws<10 m/s” Component failure A Oil flow by control system B Oil flow by centrifugal C 1 tip brake deploys D 2 tip brakes deploy E 3 tip brakes deploy F Mechanical brake Sequence formula ABC F A BC F ABC F AB F A BC F Success state Failure state Figure 2. Event tree for initiating event “Grid loss” and condition “10 m/s≤ws<20 m/s” Component failure A Oil flow by control system B Oil flow by centrifugal C 1 tip brake deploys D 2 tip brakes deploy F Mechanical brake Sequence formula ABC D F ABC A BC D F A BC ABC D F AB Figure 3. Event tree for initiating event “Grid loss” and condition “20 m/s≤ws<25 m/s” Component failure A Oil flow by control system B Oil flow by centrifugal D 2 tip brakes deploy E 3 tip brakes deploy F Mechanical brake Sequence formula ABD E F AB D A BD E F AB D ABD E F AB D AB Figure 4. Event tree for initiating event “Gearbox failure” and condition “5 m/s≤ws<10 m/s” Component failure A Oil flow by control system B Oil flow by centrifugal C 1 tip brake deploys D 2 tip brakes deploy E 3 tip brakes deploy Sequence formula ABC A BC ABC AB Figure 5. Event tree for initiating event “Gearbox failure” and condition “10 m/s≤ws<20 m/s” Component failure A Oil flow by control system B Oil flow by centrifugal C 1 tip brake deploys D 2 tip brakes deploy E 3 tip brakes deploy Sequence formula ABC D ABC ABC D ABC ABC D ABC AB Figure 6. Event tree for initiating event “Gearbox failure” and condition “20 m/s≤ws<25 m/s” Component failure A Oil flow by control system B Oil flow by centrifugal C 1 tip brake deploys D 2 tip brakes deploy E 3 tip brakes deploy Sequence formula ABCD E ABC D ABC ABCD E ABC D ABC ABCD E ABC D ABC AB Figure 7. Event tree for initiating event “ws≥25 m/s” ws≥25 m/s A Oil flow by control system B Oil flow by centrifugal E 3 tip brakes deploy Sequence formula AB E AB E AB E AB