1
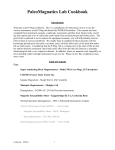
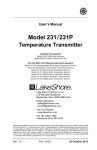
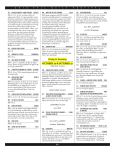
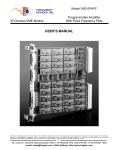
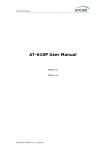
Innovation in Magnetic Field Measuring Instruments
Operation Manual for
DAS1 Magnetic Range Data Acquisition System
www.bartington.com
BARTINGTON INSTRUMENTS
Table of Contents
1. About this Manual
5
1.1. Symbols Glossary
5
2. Safe Use
5
3. Compatible Magnetometers
6
4. Introduction to the DAS1
6
4.1. Summary
6
4.2. System Architecture
6
4.3. Decaport Features
7
4.3.1. Front Panel
7
4.3.2. Rear panel
8
4.4. PXI Chassis Features
9
4.4.1. Rear panel
9
4.5. System Configuration Options
5. Installing the DAS1 System
9
10
5.1. Location of Equipment
10
5.1.1. Potentially Hazardous Locations
10
5.1.2. Mounting
10
5.1.3. Orientation
10
5.1.4. Ventilation
10
5.2. Connecting the Equipment
10
5.2.1. PXI Decaport Cabling
10
5.2.2. CPU Peripherals and Interfaces
11
5.2.3. Remote Computer Connection
11
5.2.4. Sensors
11
5.2.5. AC Mains Power Cables and Earthing
11
6. Using the DAS1 System
11
6.1. Switching the Equipment On and Off
11
Page 2 of 47OM2201/5
BARTINGTON INSTRUMENTS
6.2. Operating the System
12
6.2.1. Standard DAS1 Software
12
6.2.2. User-designed Software
12
7. Decaport Interface Module Technical Reference
12
7.1. Interface and Control
13
7.2. Other National Instruments Interfaces
13
7.3. Sensor Inputs
13
7.3.1. Balanced Input Connection
14
7.3.2. Unbalanced Input Connection
14
7.3.3. Input Connector Pin-Out
15
7.3.4. Setting Sensor Input Type
15
7.3.5. Sensor Test Enable
16
7.4. Sensor Outputs
16
7.4.1. Analogue Output Connections
7.5. Power Supply
16
18
7.5.1. Power Switch
18
7.5.2. Protection
18
7.5.3. Power Supply Monitor
18
7.5.4. Cable Leakage Current Test
20
7.5.5. Power Supply Control Signal Functions
21
7.6. Low Pass Filters
23
7.7. Auxiliary I/O connector
24
7.7.1. Analogue Outputs
24
7.7.2. APFI (Trigger) Inputs
24
7.8. PXI Interface Connections by Pin
25
8. PXI Documentation
31
9. Software User Manual
31
9.1. Windows
31
Page 3 of 47OM2201/5
BARTINGTON INSTRUMENTS
9.1.1. Running Background Applications
31
9.1.2. Data Save format
32
9.2. Forced Zero Offset Compensation
32
9.3. Sample Rate Considerations
33
9.4. Oversampling
34
9.5. Anti-aliasing Filter
34
9.6. Setup Screens
34
9.6.1. Start-up
34
9.6.2. Setup Control Window
36
9.6.3. Decaport Configuration Window
36
9.6.4. System Configuration Window
38
10. Monitor Screens
40
10.1. Signal Monitor
40
10.2. Power Monitor
42
11. Troubleshooting
43
12. Care and Maintenance
43
12.1. Cleaning
43
12.1.1. Dust Filters
43
12.1.2. General
44
12.2. Calibration
13. End of Life Disposal
44
44
Notes45
Page 4 of 47OM2201/5
BARTINGTON INSTRUMENTS
1. About this Manual
This document describes the installation, operation and maintenance of the DAS1 Data
Acquisition System from Bartington Instruments. It should be read in conjunction with the
product brochure (DS2201) which can be found found on the product page of the Bartington
Instruments at: www.bartington.com.
The DAS1 system includes a PXI chassis from National Instruments. Instructions for operation of
the PXI chassis can be found on the National Instruments website at: www.ni.com.
1.1. Symbols Glossary
The following symbols used within this manual call your attention to specific types of
information:
WARNING: Indicates a situation in which serious bodily injury or death could result if the
warning is ignored.
Caution: Indicates a situation in which bodily injury or damage to your instrument, or both,
could result if the caution is ignored.
Identifies items that must be disposed of safely to prevent unnecessary damage to the
environment.
Note: A note provides useful supporting information and sometimes suggests how to make
better use of your purchase.
2. Safe Use
WARNING: These products are not qualified for use in explosive atmospheres or life
support systems. Consult Bartington Instruments for advice.
WARNING: The DAS1 is powered by mains electricity. The unit MUST be earthed. The
centre pins of the IEC mains inlet sockets on the rear panel of the Decaport units and the
PXI rack are internally connected to all the metal panels of the unit. Use of the 3-core IEC
mains connecting cables supplied with the unit will ensure the unit is correctly earthed.
Use of alternative cables may render the unit unsafe.
WARNING: The IEC mains connecting cables must be protected with the maximum fuse
ratings shown in the product brochure.
WARNING: The DAS1 must be operated from an AC mains electricity supply as specified in
in the product brochure.
Page 5 of 47OM2201/5
BARTINGTON INSTRUMENTS
WARNING: This unit is not sealed against the ingress of water and should be operated only
under dry conditions.
3. Compatible Magnetometers
The DAS1 is designed to be compatible with the sensors shown on the Product Compatibility page of
the Bartington Instruments website at: www.bartington.com/product-compatibility.html.
Caution: Use of incompatible sensors may cause damage to the DAS1 and/or the sensor.
4. Introduction to the DAS1
4.1. Summary
The DAS1 Magnetic Range Data Acquisition System is a complete digital hardware solution for
data collection and processing from large arrays of magnetometers, e.g. a marine signature
range.
When used with compatible Bartington Instruments sensors, the DAS1 provides all the required
power, anti-alias filtering and analogue to digital (A-to-D) conversion. The DAS1 CPU performs
basic data processing and display, using software supplied with the system. Where additional
data processing is required, users can run their own software on the system, or the DAS1 can be
connected to an ethernet network to transfer data to another system.
Power supply monitoring, cable leakage test and sensor self-test (where available) are all
provided under software control.
4.2. System Architecture
The DAS1 consists of two main components:
•
One or more Decaport Interface Modules, which power attached sensors, and provide
analogue signal conditioning of the sensor output signals. Each Decaport module can
support up to 10 three-axis magnetometers (or other compatible sensors).
•
A PXI Data Acquisition system, which provides A-to-D conversion of the magnetometer
signals, and processing and storage of the acquired data. The PXI system consists of a CPU
controller module (or alternatively, an interface via a PXI remote control module to a remote
computer control system) and A-to-D conversion modules, housed in a standard PXI chassis.
Each A-to-D module supports one Decaport. Interface with the entire system is via a monitor
and keyboard connected to the CPU, or a remote computer connected to the PXI remote
control module.
Page 6 of 47OM2201/5
BARTINGTON INSTRUMENTS
The modular design of the DAS1 allows Decaports and A-to-D modules to be added, if required,
to support additional sensors. The minimum configuration is one Decaport and one A-to-D
module.
4.3. Decaport Features
The Decaport conforms to the standard 19-inch rack mount specification and is 1U (Rack Unit)
high. It does not require any extra space above or below.
Note: If a single Decaport is mounted in a rack with deeper units, ensure the back panel of
the Decaport can be accessed.
4.3.1. Front Panel
1
2
3
5
4
Figure 1. Decaport front panel
Key to Figure 1
1.
LED indicator – Inputs 1 to 5. The LED colour state (red or green) is controlled by the user software.
2.
LED indicator – Inputs 6 to 10. The LED colour state (red or green) is controlled by the user software.
3.
ON/OFF power switch. Controls overall power to the Decaport.
4.
Sensor connector sockets – Inputs 6 to 10. Set of five input sockets for connection of three-axis magnetometers or
other compatible sensors.
5.
Sensor connector sockets – Inputs 1 to 5. Set of five input sockets for connection of three-axis magnetometers or
other compatible sensors.
Page 7 of 47OM2201/5
BARTINGTON INSTRUMENTS
4.3.2. Rear panel
1
2
3
5
4
Figure 2. Decaport rear panel.
Key to Figure 2
1.
Mains input sockets, for connection of IEC lead. See the product brochure for supply voltage.
2.
PXI interface socket (CN1). Connection for inputs 6 to 10 to the PXI rack 6289 DAQ module (or equivalent).
3.
PXI interface socket (CN0). Connection for inputs 1 to 5 to the PXI rack 6289 DAQ module (or equivalent).
4.
AUX I/O connector. The auxiliary signals are described later in this document.
5.
Earth terminal post. If an appropriate earth/ground connection is not provided through your mains supply lead,
connect this terminal post to the PXI Chassis earth terminal, the 19” rack and a permanent earth ground, as
described in Section 5.2.4: AC Mains Power Cables and Earthing.
WARNING: The mains supply must be earthed. Ensure all local and national codes on
electrical installation and grounding are observed.
Page 8 of 47OM2201/5
BARTINGTON INSTRUMENTS
4.4. PXI Chassis Features
4.4.1. Rear panel
1
2
3
4
Figure 3. PXI chassis, rear panel.
Key to Figure 3
1.
Circuit breaker. Protects the PXI unit against an over-current condition.
2.
Mains input sockets, for connection of IEC lead. See the product brochure for supply voltage.
3.
Earth terminal point. If an appropriate earth/ground connection is not provided through your mains supply lead,
see Section 5.2.4: AC Mains Power Cables and Earthing for alternative measures. Consult the NI PXI-1042 Series
documentation for full details.
4.
Filter cover (R) and retaining screw (L). This cover can be removed to access the filters for periodic cleaning.
4.5. System Configuration Options
The Decaport and PXI system are connected using an industry standard PXI interface
configuration. This enables users to construct a system based on individual component modules,
if desired, rather than the full DAS1 system. For example, the user could choose to substitute
a remote computer (with suitable PXI interface) in place of the DAS1 standard CPU controller
Page 9 of 47OM2201/5
BARTINGTON INSTRUMENTS
module. Configuration using the integral CPU module, and an alternative configuration using a
PCMCIA or PCI interface to an external computer, are given in the product brochure.
5. Installing the DAS1 System
5.1. Location of Equipment
5.1.1. Potentially Hazardous Locations
WARNING: This equipment is powered by mains electricity. It should not be used in wet or
damp locations, where water may enter the unit and create a safety hazard.
5.1.2. Mounting
WARNING: The DAS1 is normally supplied within a 19” rack. Failure to use the rack, or
another suitable fixing method, may create a risk of personal injury or damage to the DAS1
in the event of it falling. It is recommended that the system be used in the supplied rack.
Caution: If the system is be transferred to an equivalent 19” rack, it is important to leave
1U (Rack Unit) of free space above the PXI chassis component to ensure adequate cooling.
5.1.3. Orientation
Caution: The equipment should be used in a horizontal orientation in the 19” rack, to
ensure correct cooling.
5.1.4. Ventilation
Caution: Ensure that the location does not restrict ventilation from the fans in the back of
the PXI chassis.
5.2. Connecting the Equipment
Caution: Connect all external sensors and peripheral devices to the DAS1 before switching
on power to system. Damage may occur if equipment is connected or disconnected whilst
powered.
5.2.1. PXI Decaport Cabling
For initial system assembly, connect the PXI cables from the Decaport rear panel connectors
CN0 and CN1 (see Figure 2: Decaport rear panel) to the PXI Chassis A-to-D module Connector 0
and Connector 1 respectively. Route the cables through the large aperture on the right hand side
of the PXI chassis.
Page 10 of 47OM2201/5
BARTINGTON INSTRUMENTS
If your system has more than one Decaport/A-to-D pair, connect the top Decaport in the stack to
the leftmost A-to-D card in the chassis, etc.
Note: The PXI cables can be left permanently connected, but may need to be removed if the
system is ever repacked for transportation.
5.2.2. CPU Peripherals and Interfaces
If the system includes the CPU controller module, connect a suitable display to the CPU DVI-I
connector, and a keyboard and mouse to free USB connectors.
Connect any other interfaces (e.g. Ethernet, serial, USB) that you require for your system
implementation.
5.2.3. Remote Computer Connection
If your system includes an interface for connection of a remote control computer, connect the
supplied cable and card (MXI Express or MXI ExpressCard) to the remote computer.
5.2.4. Sensors
Connect the cabling from your system sensors (e.g. magnetometers, depth/tilt sensors) to the
Decaport front panel input sockets (for details see Section 7.3: Sensor Inputs).
5.2.5. AC Mains Power Cables and Earthing
Connect the supplied IEC mains cables to the mains inlet sockets on the PXI chassis and
Decaports.
Note: Each Decaport requires its own mains cable.
WARNING: If your mains power supply arrangement does not provide appropriate earth/
grounding, connect the Decaport Earth Terminal Posts (see Section 4.3: Decaport
Features), the PXI Chassis Earth Terminal Posts (see Section 4.4: PXI Chassis Features)
and the 19” rack metalwork to a permanent earth ground point, using 16 AWG (1.3mm)
wire with a grounding lugs. If in doubt, consult Bartington Instruments.
6. Using the DAS1 System
6.1. Switching the Equipment On and Off
Use the following sequence for powering-up the various components of a DAS1 based system:
1. If your system includes one, power-up your remote control computer.
2. Power-on the PXI chassis using the ON/OFF switch on the front lower left corner.
Page 11 of 47OM2201/5
BARTINGTON INSTRUMENTS
3. Power-on the Decaport(s) using the ON/OFF switch(es) on the right of the front panel (see
Figure 1: Decaport front panel).
6.2. Operating the System
Details of operation vary greatly depending on the configuration of your system, and in particular
the exact software that you will be using.
6.2.1. Standard DAS1 Software
To use the DAS1 data capture and storage software supplied with the standard system, see
Section 7: Decaport Interface Module Technical Reference (describing the features and functions
within the DAS1 Decaport Interface unit) and Section 9: Software User Manual (describing how
you can use the software to control these functions, and also how to collect and process data
recorded by the system).
6.2.2. User-designed Software
Section 7: Decaport Interface Module Technical Reference provides programming details
for controlling the Decaport functions using your own software. The reference manual uses
standard PXI notation; read it in conjunction with the LabVIEW technical manuals from National
Instruments.
Section 9: Software User Manual provides useful background information for your own design.
7. Decaport Interface Module Technical Reference
The Decaport module provides several functions associated with powering, controlling and
conditioning signals from the attached magnetometer sensors. Most of the functions can be
controlled via digital input signals to the Decaport.
The main functions are:
• power to sensors (on/off and voltage high/low control)
• sensor analogue input type (balanced/unbalanced selection control)
• analogue outputs to the A-to-D module
• sensor test signal (normal/test state control)
• low pass filter (corner frequency control)
• power supply monitoring (sensor selection control)
• cable leakage test (initiate test control).
Page 12 of 47OM2201/5
BARTINGTON INSTRUMENTS
7.1. Interface and Control
Internally, the Decaport has two identical five-sensor channel input modules, each using one
of the connectors on the PXI card. The I/O lines are all used as control inputs to the Decaport.
These are all standard 5V TTL logic inputs. All the inputs are static logic, i.e. no shift registers,
latches or clocks are used. If an alternative data acquisition system is used, most of the
control lines could be hardwired to the required state; however, it is recommended that the
magnetometer Power Enable lines are controllable. If the power supply monitor and/or other
control functions are to be utilised then sufficient control lines will be required.
7.2. Other National Instruments Interfaces
The Decaport will directly connect to other data acquisition cards and modules from National
Instruments. These can offer different solutions, such as desktop computer PCI bus and USB
bus.
Note: Bartington Instruments cannot guarantee that these solutions will achieve the
published specification of the Decaport and standard range data acquisition system.
7.3. Sensor Inputs
The Decaport can connect up to ten Bartington Instruments three-axis magnetometers or other
compatible sensors. Each input can be set independently to operate with either an unbalanced (single
ended) or balanced (differential) output sensor (please refer to the sensor’s datasheet for details of it’s
output). The setting will automatically select the correct wiring of the input connector.
See the product brochure for details of connectors.
Note: Bartington Instruments can supply suitable cables for all types of compatible
sensors.
Page 13 of 47OM2201/5
BARTINGTON INSTRUMENTS
7.3.1. Balanced Input Connection
Figure 4: Balanced Input Connection
In balanced mode (Figure 4), the differential signals and input amplifiers give the best possible
accuracy. There is no interaction of signal ground currents and unequal sensor ground potentials
caused by different voltage drops in the power ground cabling. Compared to unbalanced mode,
this configuration has the higher interference noise rejection, as noise will appear as a common
mode signal at the input amplifiers.
7.3.2. Unbalanced Input Connection
Figure 5: Unbalanced Input Connection
In unbalanced mode (Figure 5), the differential input amplifiers are retained. This eliminates the
effect of differing signal ground potentials of each sensor, caused by differing voltage drops in
the power ground cabling. However, the unbalanced mode is inferior to the balanced mode. The
use of a common signal ground gives reduced accuracy with very long cables, due to interaction
of the signal ground currents. This configuration is also more susceptible to interference noise.
Page 14 of 47OM2201/5
BARTINGTON INSTRUMENTS
7.3.3. Input Connector Pin-Out
See Table 1.
Table 1. Input Connector Pin Out.
Function
Pin
Balanced Input
Unbalanced Input
1
X axis Positive Signal
X axis Signal
2
Y axis Positive Signal
Y axis Signal
3
Z axis Positive Signal
Z axis Signal
4
Ground
Ground
5
Test
Signal Ground Reference
6
Positive Power Supply
Positive Power Supply
7
Negative Power Supply
Negative Power Supply
8
X axis Negative Signal
No Connection
9
Y axis Negative Signal
No Connection
10
Z axis Negative Signal
No Connection
7.3.4. Setting Sensor Input Type
The sensor input types are set individually for each sensor by digital I/O lines from the PXI
interface. The Input Select lines are 5V TTL compatible static inputs.
See Table 2.
Table 2. Setting sensor input type.
Signal
PXI function
Pin
Sensor 1 Input Select
P2.0
CN 0.37
Sensor 2 Input Select
P2.1
CN 0.3
Sensor 3 Input Select
P2.2
CN 0.45
Sensor 4 Input Select
P2.3
CN 0.46
Sensor 5 Input Select
P2.4
CN 0.2
Sensor 6 Input Select
P0.24
CN 1.37
Sensor 7 Input Select
P0.25
CN 1.3
Sensor 8 Input Select
P0.26
CN 1.45
Sensor 9 Input Select
P0.27
CN 1.46
Sensor 10 Input Select
P0.28
CN 1.2
A logic high (+5V) on an Input Select sets the balanced input mode; a logic low (0V) selects the
unbalanced input mode.
Page 15 of 47OM2201/5
BARTINGTON INSTRUMENTS
7.3.5. Sensor Test Enable
A test function is available on some Bartington Instruments sensors. This causes a fixed offset to
be added to each of the magnetometer outputs.
The Sensor Test Enable signals will initiate the test function on an attached sensor. This function
is only available when the input is set to the balanced mode.
Table 3. Sensor test enable.
Signal
PXI function
Pin
Sensor 1 Test Enable
P0.0
CN 0.52
Sensor 2 Test Enable
P0.1
CN 0.17
Sensor 3 Test Enable
P0.2
CN 0.49
Sensor 4 Test Enable
P0.3
CN 0.47
Sensor 5 Test Enable
P0.4
CN 0.19
Sensor 6 Test Enable
P0.8
CN 1.52
Sensor 7 Test Enable
P0.9
CN 1.17
Sensor 8 Test Enable
P0.10
CN 1.49
Sensor 9 Test Enable
P0.11
CN 1.47
Sensor 10 Test Enable
P0.12
CN 1.19
A logic low (0V) on a Test Enable signal puts an attached sensor in to test mode. A logic high
(+5V) puts the sensor into normal operating mode.
7.4. Sensor Outputs
7.4.1. Analogue Output Connections
Table 4. Analogue output connections.
Signal
PXI function
Pin
Sensor 1 X Output
AI.0
CN 0.68
Sensor 1 Y Output
AI.1
CN 0.33
Sensor 1 Z Output
AI.2
CN 0.65
Sensor 2 X Output
AI.3
CN 0.30
Sensor 2 Y Output
AI.4
CN 0.28
Sensor 2 Z Output
AI.5
CN 0.60
Sensor 3 X Output
AI.6
CN 0.25
Sensor 3 Y Output
AI.7
CN 0.57
Sensor 3 Z Output
AI.8
CN 0.34
Sensor 4 X Output
AI.9
CN 0.66
Page 16 of 47OM2201/5
BARTINGTON INSTRUMENTS
Sensor 4 Y Output
AI.10
CN 0.31
Sensor 4 Z Output
AI.11
CN 0.63
Sensor 5 X Output
AI.12
CN 0.61
Sensor 5 Y Output
AI.13
CN 0.26
Sensor 5 Z Output
AI.14
CN 0.58
Analogue Output Reference
1
AI. SENSE 0
CN0.62
Sensor 6 X Output
AI.16
CN 1.68
Sensor 6 Y Output
AI.17
CN 1.33
Sensor 6 Z Output
AI.18
CN 1.65
Sensor 7 X Output
AI.19
CN 1.30
Sensor 7 Y Output
AI.20
CN 1.28
Sensor 7 Z Output
AI.21
CN 1.60
Sensor 8 X Output
AI.22
CN 1.25
Sensor 8 Y Output
AI.23
CN 1.57
Sensor 8 Z Output
AI.24
CN 1.34
Sensor 9 X Output
AI.25
CN 1.66
Sensor 9 Y Output
AI.26
CN 1.31
Sensor 9 Z Output
AI.27
CN 1.63
Sensor 1a X Output
AI.28
CN 1.61
Sensor 1a Y Output
AI.29
CN 1.26
Sensor 1a Z Output
AI.30
CN 1.58
Analogue Output Reference
2
AI. SENSE 1
CN 1.62
The Decaport sensor signal outputs to the PXI rack are analogue, single ended with a range of
±10V.
Note: The full DAS1 system uses the PXI A-to-D converter modules in Non-Referenced SingleEnded (NRSE) configuration, to avoid problems of ground offset. In this configuration, the A-to-D
converter measures the voltage of an analogue input (AI) signal relative to one of the AI SENSE
inputs, which is connected to a star point common (ground) reference for each group of 16
inputs on the Decaport PCB. This input configuration is recommended if users are implementing
their own A-to-D system.
Page 17 of 47OM2201/5
BARTINGTON INSTRUMENTS
7.5. Power Supply
The Decaport has two internal 30W ±15V supplies that require a 100-250 VAC supply, via an IEC
connector on the rear panel (see Figure 2). Each power supply independently provides power for five
sensors and their signal conditioning electronics. The ±15V supply is used internally. It is also reduced
to ±12V and supplied externally to the sensors.
Note: Long cables can cause a power voltage drop at the sensor. The Decaport can be
programmed to increase the sensor supply output to ±14V, to compensate for this loss.
This can be set independently for each set of five sensors.
7.5.1. Power Switch
The mains power switch is situated on the right hand of the front panel. (See Figure 1.)
7.5.2. Protection
The power supply to each sensor is protected by self-resetting semiconductor fuses that limit
the current on each rail to approximately 50mA. The fuses can be reset by switching off the unit
and allowing it to cool for a few minutes.
Two 1A slow blow fuses are fitted internally to limit the mains supply current to each of the
power supply modules.
WARNING: If the power supply 1A fuses have blown, this indicates a faulty unit. Contact
Bartington Instruments.
7.5.3. Power Supply Monitor
To allow monitoring of the connected sensors whilst the system is operational, the current and voltage
to each sensor and the internal power supply voltages can be routed to an analogue output, for
measurement by the A-to-D system.
7.5.3.1. Power Supply Monitor Select Input Pins
Power supply monitor select input pins are shown in Table 5.
Table 5. Power Supply Monitor Select Input Pins
Sensor Channels 1 to 5
Signal
PXI function
Pin
PSU Monitor Enable
P1.5
CN 0.6
PSU Monitor Select 0
P1.0
CN 0.11
PSU Monitor Select 1
P1.1
CN 0.10
PSU Monitor Select 2
P1.2
CN 0.43
Page 18 of 47OM2201/5
BARTINGTON INSTRUMENTS
PSU Monitor Select 3
P1.3
CN 0.42
PSU Monitor Select 4
P1.4
CN 0.41
PSU Monitor Output 1-5
AI.15
CN 0.23
Sensor Channels 6 to 10
Signal
PXI function
Pin
PSU Monitor Enable
P0.21
CN 1.6
PSU Monitor Select 0
P0.16
CN 1.11
PSU Monitor Select 1
P0.17
CN 1.10
PSU Monitor Select 2
P0.18
CN 1.43
PSU Monitor Select 3
P0.19
CN 1.42
PSU Monitor Select 4
P0.20
CN 1.41
PSU Monitor Output 6-10
AI.31
CN 1.23
Note: The input PSU Monitor Enable has an internal pull up resistor. The PXI system
default output state should be set to logic high, to ensure that the system starts up in a
safe mode.
7.5.3.2. Using the Power Supply Monitor
The parameter to be read is selected by the power supply monitor control inputs and is
presented on the analogue output AI 15 (for ch 1-5) and AI 31 (for ch 6-10).
Caution: Ensure that the enable line is set false when changing monitor channel, to
prevent accidental shorts within the power supply circuit.
Use the following four stage cycle:
1. Set PSU Monitor Enable false (logic high).
2. Select parameter using PSU Monitor Select Inputs 0-4.
3. Set PSU Monitor Enable input true (logic low).
4. Read the analogue voltage from PSU Monitor Output.
5. Set PSU Monitor Enable false (logic high).
7.5.3.3. Power Supply Monitor Data
The value returned for the voltage is half the measured voltage. The value returned for the
current is the voltage measured across a 1Ω 1% resistor, and will include a small current drawn
by the voltage measuring circuit.
Page 19 of 47OM2201/5
BARTINGTON INSTRUMENTS
Note: The current drawn by a magnetometer will vary with the applied magnetic field. Therefore,
this measurement is mainly intended for an indication of major changes in current, due to fault
conditions.
7.5.4. Cable Leakage Current Test
Caution: This test must only be performed with Mag-03RC or DTS1 sensors. Use with other
sensor types may damage the sensor.
The test can be used to detect system faults caused by water ingress. When the sensors form
part of a seawater range, seepage of water into the cable, connectors or sensors will result in
a significant leakage current being detected. Significant leakage current is an indication of a
potential fault in the system.
The test enables the power supply leakage current to be measured, for each block of five
sensors, by placing +15V on both power supply lines.
7.5.4.1. Implementing the Cable Leakage Test
Use the following sequence to implement the cable leakage test:
1. Select the leakage current monitor in the power supply monitor function.
2. Turn off the magnetometer power supply by setting Sensor PSU Enable false (logic high).
3. Select the leakage test supply by setting Test Relay Enable true (logic low).
4. Enable the leakage test power supply by setting Test PSU Enable true (logic low).
5. Wait sufficient time for the current to stabilise. The measuring circuit uses a high impedance
(47kΩ) with a long cable. The time constant will be significant.
6. Read the value returned on the analogue output AI 15 (ch 1-5) or AI 31 (ch 6-10).
7. Disable the leakage test power supply by setting Test PSU Enable false (logic high).
8. Select the magnetometer supply by setting Test Relay Enable false (logic high).
9. Restore the magnetometer power supply by setting Sensor PSU Enable true (logic low).
Note: This process interrupts the power supply to the magnetometers and should not be
carried out when the data capture system is active. It should be used as part of the system
start up and verification procedure.
7.5.4.2. Cable Leakage Current Data
The leakage current is measured as the voltage across a 47KΩ resistor.
Page 20 of 47OM2201/5
BARTINGTON INSTRUMENTS
Use the following formula to calculate the leakage current IL (the formula includes a correction to
compensate for the quiescent current drawn by the measuring circuits):
IL = 3V0– Vcc (mA)
50
Where:
VO is the voltage returned by the leakage current measurement;
VCC is the power supply voltage, nominally 15V.
This is not intended to yield a fully accurate result, but will alert the user to any significant
increase in leakage current due to seawater ingress.
7.5.5. Power Supply Control Signal Functions
The power supply functions are controlled by digital I/O lines from the PXI interface. The input
signals are 5V TTL compatible static inputs.
7.5.5.1. Sensor PSU Enable
A logic low (0V) enables the sensor power supplies.
Note: The states of both Test Relay Enable and Test PSU Enable (described below) are
ignored when Sensor PSU Enable is low.
7.5.5.2. Sensor PSU Voltage
A logic high (+5V) selects the higher voltage (±14) sensor power supplies. A logic low (0V) selects
the lower voltage (±12) sensor power supplies.
7.5.5.3. Test Relay Enable
A logic low (0V) selects the leakage test power supply. A logic high (+5V) enables the normal
sensor power supply.
Caution: Both supplies must be disabled (using Sensor PSU Enable) before changing the
state of Test Relay Enable.
7.5.5.4. Test PSU Enable
A logic low (0V) enables the leakage test power supply.
7.5.5.5. LED
Page 21 of 47OM2201/5
BARTINGTON INSTRUMENTS
A logic low (0V) sets the LED red. A logic high (+5V) sets the LED green.
7.5.5.6. PSU Monitor Enable / PSU Monitor Select 0-4
These controls enable and select the power supply parameter that is routed to the PSU Monitor Output
signal, according to Table 6.
Caution: Ensure that the PSU Monitor Enable line is set to DISABLED (logic high) before
changing monitor select inputs, to prevent accidental shorts within the power supply
circuit.
Table 6. PSU Monitor Select Function.
PSU Monitor Select Function
0
1
2
3
4
Function
EN
X
X
X
X
X
1
Monitor Disabled (output voltage uncertain)
1
1
1
1
1
0
Sensor 2 [7] Positive Supply Current
0
1
1
1
1
0
Sensor 2 [7] Positive Supply Voltage
1
0
1
1
1
0
Sensor 2 [7] Negative Supply Current
0
0
1
1
1
0
Sensor 2 [7] Negative Supply Voltage
1
1
0
1
1
0
Sensor 3 [8] Positive Supply Current
0
1
0
1
1
0
Sensor 3 [8] Positive Supply Voltage
1
0
0
1
1
0
Sensor 3 [8] Negative Supply Current
0
0
0
1
1
0
Sensor 3 [8] Negative Supply Voltage
1
1
1
1
0
0
Sensor 4 [9] Positive Supply Current
0
1
1
1
0
0
Sensor 4 [9] Positive Supply Voltage
1
0
1
1
0
0
Sensor 4 [9] Negative Supply Current
0
0
1
1
0
0
Sensor 4 [9] Negative Supply Voltage
1
1
0
1
0
0
Sensor 5 [10] Positive Supply Current
0
1
0
1
0
0
Sensor 5 [10] Positive Supply Voltage
1
0
0
1
0
0
Sensor 5 [10] Negative Supply Current
0
0
0
1
0
0
Sensor 5 [10] Negative Supply Voltage
1
1
1
0
1
0
Sensor 1 [6] Positive Supply Current
0
1
1
0
1
0
Sensor 1 [6] Positive Supply Voltage
1
0
1
0
1
0
Sensor 1 [6] Negative Supply Current
0
0
1
0
1
0
Sensor 1 [6] Negative Supply Voltage
1
1
0
0
1
0
Leakage Test Current
0
1
0
0
1
0
+15V Supply
1
0
0
0
1
0
+5V Supply
Page 22 of 47OM2201/5
BARTINGTON INSTRUMENTS
0
0
0
0
1
0
–15V Supply
X
X
X
0
0
0
Invalid Input (output voltage uncertain)
Note: Number in square bracket [n] is for ports 6-10
7.5.5.7. Power Supply Control Input Pins
Power Supply Control Input pins are shown in Table 7.
Note: The four inputs, Sensor PSU Enable, Test Relay Enable, Test PSU Enable and the
LED have internal pull up resistors. The PXI system default output states should be set to
logic high, to ensure that the system starts up in a safe mode.
Table 7. Power Supply Control Input Pins.
Sensor Channels 1 to 5
Signal
PXI function
Pin
Sensor PSU Enable
P1.7
CN 0.38
Sensor PSU Voltage
P1.6
CN 0.5
Test PSU Enable
P0.7
CN 0.48
Test Relay Enable
P0.6
CN 0.16
LED
P0.5
CN 0.51
Sensor Channels 6 to 10
Signal
PXI function
Pin
Sensor PSU Enable
P0.23
CN 1.38
Sensor PSU Voltage
P0.22
CN 1.5
Test PSU Enable
P0.15
CN 1.48
Test Relay Enable
P0.14
CN 1.16
LED
P0.13
CN 1.51
7.6. Low Pass Filters
A low pass, anti-aliasing filter is incorporated in the Decaport with switchable frequency settings
(see the product brochure). Each block of five channels is set independently, with the option of
disabling the filter altogether.
In Table 8: 0 = logic low (0V), 1 = logic high (5V).
Table 8. Low pass filters.
Select Inputs
Nominal frequency at –3dB point of Selected filter
0
1
EN
1
1
0
10kHz
Page 23 of 47OM2201/5
BARTINGTON INSTRUMENTS
0
1
0
1kHz
1
0
0
100Hz
0
0
0
10Hz
X
X
1
No Filter
Sensor Channels 1 – 5
Signal
PXI function
Pin
Filter Enable
P2.5
CN 0.40
Filter Select 0
P2.6
CN 0.1
Filter select 1
P2.7
CN 0.39
Sensor Channels 6 – 10
Signal
PXI function
Pin
Filter Enable
P0.29
CN 1.40
Filter Select 0
P0.30
CN 1.1
Filter select 1
P0.31
CN 1.39
With Mag-03 and Mag-03RC magnetometers, a setting of 10kHz low pass filter must be used
if the system must record across the full magnetometer 3kHz bandwidth. Where sampling
frequencies below 20kHz are used, set the filter to a lower frequency to avoid aliasing.
Note: This filter is only intended for anti-aliasing purposes, and filter frequencies
are only approximate values. If a high accuracy frequency filter is required, it should
be implemented in software digital signal processing routines available in most data
processing software.
7.7. Auxiliary I/O connector
Details including pin out of the connector that provides access to the analogue output and PFI
(trigger) inputs available on the PXI6289 card are given in the product brochure.
7.7.1. Analogue Outputs
These are buffered and presented as balanced outputs. See the product brochure for range.
Each output has the same EMC protection as the sensor inputs. For further information on the
analogue outputs, consult the National Instruments documentation.
7.7.2. APFI (Trigger) Inputs
These digital inputs pass through to the 6289 card, via the same EMC protection as the sensor inputs.
For further information on the APFI inputs, consult the National Instruments documentation and the
product brochure.
Page 24 of 47OM2201/5
BARTINGTON INSTRUMENTS
Table 9. Auxiliary I/O connector pin out.
Pin
PXI pin Name
In/out
Range
1
Case Ground
2
AO1 +ve
Out
± 10V Analogue
3
AO2 +ve
Out
± 10V Analogue
4
APFI 0 Signal
In
0/5V Digital
5
APFI 1 Signal
In
0/5V Digital
6
AO3 –ve
Out
± 10V Analogue
7
AO Gnd
AO.Gnd
0V Nominal
8
AO4 –ve
Out
± 10V Analogue
9
AO1 –ve
Out
± 10V Analogue
10
AO Gnd
AO.Gnd
0V Nominal
11
AO2 –ve
Out
± 10V Analogue
12
APFI 0 Gnd
D.Gnd
0V Nominal
13
APFI 1 Gnd
D.Gnd
0V Nominal
14
AO3 +ve
Out
± 10V Analogue
15
AO4 +ve
Out
± 10V Analogue
0V Nominal
7.8. PXI Interface Connections by Pin
CN0 and CN1 pin out details are given in Tables 10 and 11.
Table 10. CNO sensor channels 1 to 5.
Pin
Decaport Signal
PXI pin Name
In/Out
Range
1
Filter Select 0
P2.6
In
0/5V Digital
2
Input Select 5
P2.4
In
0/5V Digital
3
Input Select 2
P2.1
In
0/5V Digital
4
Digital Ground
D.Gnd
Ground
0V Nominal
5
PSU Voltage
Select
P1.6
In
0/5V Digital
Page 25 of 47OM2201/5
BARTINGTON INSTRUMENTS
6
PSU Monitor
Enable
P1.5
In
0/5V Digital
7
Digital Ground
D.Gnd
Ground
0V Nominal
8
No Connection
+5V
9
Digital Ground
D.Gnd
Ground
0V Nominal
10
PSU Monitor
Select 1
P2.1
In
0/5V Digital
11
PSU Monitor
Select 0
P2.0
In
0/5V Digital
12
Digital Ground
D.Gnd
Ground
0V Nominal
13
Digital Ground
D.Gnd
Ground
0V Nominal
14
No Connection
+5V
15
Digital Ground
D.Gnd
Ground
0V Nominal
16
Test Relay
Enable
P0.6
In
0/5V Digital
17
Sensor Test 2
P0.1
In
0/5V Digital
18
Digital Ground
D.Gnd
Ground
0V Nominal
19
Sensor Test 5
P0.4
In
0/5V Digital
20
APFI0
APFI0
In
0/5V Digital
21
Analogue Input
2
AO.1
In
±10V Analogue
22
Analogue Input
1
AO.a
In
±10V Analogue
23
PSU Monitor Out
1-5
AI.15
Out
±10V Analogue
24
Analogue Output
Ground
AI.Gnd
Ground
0V Nominal
25
Sensor 3, X
Output
AI.6
Out
±10V Analogue
26
Sensor 5, Y
Output
AI.13
Out
±10V Analogue
27
Analogue Output
Ground
AI.Gnd
Ground
0V Nominal
28
Sensor 2, Y
Output
AI.4
Out
±10V Analogue
29
Analogue Output
Ground
AI.Gnd
Ground
0V Nominal
30
Sensor 2, X
Output
AI.3
Out
±10V Analogue
31
Sensor 4, Y
Output
AI.1a
Out
±10V Analogue
Page 26 of 47OM2201/5
BARTINGTON INSTRUMENTS
32
Analogue Output
Ground
AI.Gnd
Ground
0V Nominal
33
Sensor 1, Y
Output
AI.1
Out
±10V Analogue
34
Sensor 3, Z
Output
AI.8
Out
±10V Analogue
35
Digital Ground
D.Gnd
Ground
0V Nominal
36
Digital Ground
D.Gnd
Ground
±10V Analogue
37
Input Select 1
P2.a
In
0/5V Digital
38
Sensor PSU
Enable
P1.7
In
0/5V Digital
39
Filter Select 1
P2.7
In
0/5V Digital
40
Filter enable
P2.5
In
0/5V Digital
41
PSU Monitor
Select 4
P1.4
In
0/5V Digital
42
PSU Monitor
Select 3
P1.3
In
0/5V Digital
43
PSU Monitor
Select 2
P1.2
In
0/5V Digital
44
Digital Ground
D.Gnd
Ground
0V Nominal
45
Input Select 3
P2.2
In
0/5V Digital
46
Input Select 4
P2.3
In
0/5V Digital
47
Sensor Test 4
P0.3
In
0/5V Digital
48
Test PSU Enable
P0.7
In
0/5V Digital
49
Sensor Test 3
P0.2
In
0/5V Digital
50
Digital Ground
D.Gnd
Ground
0V Nominal
51
LED CN0
P0.5
In
0/5V Digital
52
Sensor Test 1
P0.a
In
0/5V Digital
53
Digital Ground
D.Gnd
Ground
0V Nominal
54
Analogue Input
Ground
AO.Gnd
Ground
0V Nominal
55
Analogue Input
Ground
AO.Gnd
Ground
0V Nominal
56
Analogue Output
Ground
AI.Gnd
Ground
0V Nominal
57
Sensor 3, Y
Output
AI.7
Out
±10V Analogue
Page 27 of 47OM2201/5
BARTINGTON INSTRUMENTS
58
Sensor 5, Z
Output
AI.14
Out
±10V Analogue
59
Analogue Output
Ground
AI.Gnd
Ground
0V Nominal
60
Sensor 2, Z
Output
AI.5
Out
±10V Analogue
61
Sensor 5, X
Output
AI.12
Out
±10V Analogue
62
Analogue Output
Reference
AI. Sense
Ground
0V Nominal
63
Sensor 4, Z
Output
AI.11
Out
±10V Analogue
64
Analogue Output
Ground
AI.Gnd
Ground
0V Nominal
65
Sensor 1, Z
Output
AI.2
Out
±10V Analogue
66
Sensor 4, X
Output
AI.9
Out
±10V Analogue
67
Analogue Output
Ground
AI.Gnd
Ground
0V Nominal
68
Sensor 1, X
Output
AI.a
Out
±10V Analogue
Table 11. CN1 sensor channels 6 to 10.
Pin
Decaport Signal
PXI pin name
In/Out
Range
1
Filter Select 0
P0.30
In
0/5V Digital
2
Input Select 10
P0.28
In
0/5V Digital
3
Input Select 7
P0.25
In
0/5V Digital
4
Digital Ground
D.Gnd
Ground
0V Nominal
5
PSU Voltage
Select
P0.22
In
0/5V Digital
6
PSU Monitor
Enable
P0.21
In
0/5V Digital
7
Digital Ground
D.Gnd
Ground
0V Nominal
8
No Connection
+5V
9
Digital Ground
D.Gnd
Ground
0V Nominal
10
PSU Monitor
Select 1
P0.17
In
0/5V Digital
11
PSU Monitor
Select 0
P0.16
In
0/5V Digital
Page 28 of 47OM2201/5
BARTINGTON INSTRUMENTS
12
Digital Ground
D.Gnd
Ground
0V Nominal
13
Digital Ground
D.Gnd
Ground
0V Nominal
14
No Connection
+5V
15
Digital Ground
D.Gnd
Ground
0V Nominal
16
Test Relay
Enable
P0.14
In
0/5V Digital
17
Sensor Test 7
P0.9
In
0/5V Digital
18
Digital Ground
D.Gnd
Ground
0V Nominal
19
Sensor Test 1a
P0.12
In
0/5V Digital
20
APFI 1
APFI 1
In
0/5V Digital
21
Analogue Input
4
AO.3
In
±10V Analogue
22
Analogue Input
3
AO.2
In
±10V Analogue
23
PSU Monitor Out
AI.31
Out
±10V Analogue
24
Analogue Output
Ground
AI.Gnd
Ground
0V Nominal
25
Sensor 8, X
Output
AI.22
Out
±10V Analogue
26
Sensor 10, Y
Output
AI.29
Out
±10V Analogue
27
Analogue Output
Ground
AI.Gnd
Ground
0V Nominal
28
Sensor 7, Y
Output
AI.20
Out
±10V Analogue
29
Analogue Output
Ground
AI.Gnd
Ground
0V Nominal
30
Sensor 7, X
Output
AI.19
Out
±10V Analogue
31
Sensor 9, Y
Output
AI.26
Out
±10V Analogue
32
Analogue Output
Ground
AI.Gnd
Ground
0V Nominal
33
Sensor 6, Y
Output
AI.17
Out
±10V Analogue
34
Sensor 8, Z
Output
AI.24
Out
±10V Analogue
35
Digital Ground
D.Gnd
Ground
0V Nominal
Page 29 of 47OM2201/5
BARTINGTON INSTRUMENTS
36
Digital Ground
D.Gnd
Ground
±10V Analogue
37
Input Select 1
P0.24
In
0/5V Digital
38
Sensor PSU
Enable
P0.23
In
0/5V Digital
39
Filter Select 1
P0.31
In
0/5V Digital
40
Filter enable
P0.29
In
0/5V Digital
41
PSU Monitor
Select 4
P0.20
In
0/5V Digital
42
PSU Monitor
Select 3
P0.19
In
0/5V Digital
43
PSU Monitor
Select 2
P0.18
In
0/5V Digital
44
Digital Ground
D.Gnd
Ground
0V Nominal
45
Input Select 8
P0.26
In
0/5V Digital
46
Input Select 9
P0.27
In
0/5V Digital
47
Sensor Test 9
P0.11
In
0/5V Digital
48
Test PSU Enable
P0.15
In
0/5V Digital
49
Sensor Test 8
P0.10
In
0/5V Digital
50
Digital Ground
D.Gnd
Ground
0V Nominal
51
LED CN1
P0.13
In
0/5V Digital
52
Sensor Test 6
P0.8
In
0/5V Digital
53
Digital Ground
D.Gnd
Ground
0V Nominal
54
Analogue Input
Ground
AO.Gnd
Ground
0V Nominal
55
Analogue Input
Ground
AO.Gnd
Ground
0V Nominal
56
Analogue Output
Ground
AI.Gnd
Ground
0V Nominal
57
Sensor 8, Y
Output
AI.23
Out
±10V Analogue
58
Sensor 10, Z
Output
AI.30
Out
±10V Analogue
59
Analogue Output
Ground
AI.Gnd
Ground
0V Nominal
60
Sensor 7, Z
Output
AI.21
Out
±10V Analogue
Page 30 of 47OM2201/5
BARTINGTON INSTRUMENTS
61
Sensor 10, X
Output
AI.28
Out
±10V Analogue
62
Analogue Output
Reference
AI. Sense
Ground
0V Nominal
63
Sensor 9, Z
Output
AI.27
Out
±10V Analogue
64
Analogue Output
Ground
AI.Gnd
Ground
0V Nominal
65
Sensor 6, Z
Output
AI.18
Out
±10V Analogue
66
Sensor 9, X
Output
AI.25
Out
±10V Analogue
67
Analogue Output
Ground
AI.Gnd
Ground
0V Nominal
68
Sensor 6, X
Output
AI.16
Out
±10V Analogue
8. PXI Documentation
The PXI Data Acquisition system is detailed in the National Instruments documentation, provided
separate to this manual.
9. Software User Manual
The software supplied with the DAS1 is a data capture system. Output is a data file in Comma
Separated Variable (CSV) format.
Note: The software is a LabVIEW application. LabVIEW source files are supplied to enable
users to extend and customise the system, if they possess a suitable licensed LabVIEW
development system.
9.1. Windows
9.1.1. Running Background Applications
The DAS1 system is supplied with Windows XP installed. When running the DAS1 software, do
not run other applications within Windows. This will limit the processing time available for data
collection, and may cause errors. (If an application takes control of the processor for more than
the sample read period – nominally set at 100 mSec – then the buffer in the PXI NI A-to-D card
will be overwritten and the data logging process will stop.)
Page 31 of 47OM2201/5
BARTINGTON INSTRUMENTS
Note: All general Windows maintenance (Windows updates, etc.) must be performed when
the DAS1 software is not running.
9.1.2. Data Save format
Data is saved in a CSV (*.csv) file format. All the data from one reading is in decimal text form,
on one line, separated by commas with a carriage return at the end. The first line in the CSV file
carries the magnetometer label text.
An example file is shown here:
Sensor 1x, Sensor1y, Sensor1z, Sensor2x, Sensor2y, Sensor2z
10.E1, 11.E1, 12.E1, 20.E1, 21.E1, 22.E1
10.E1, 11.E1, 12.E1, 20.E1, 21.E1, 22.E1
10.E1, 11.E1, 12.E1, 20.E1, 21.E1, 22.E1
10.E1, 11.E1, 12.E1, 20.E1, 21.E1, 22.E1
10.E1, 11.E1, 12.E1, 20.E1, 21.E1, 22.E1
10.E1, 11.E1, 12.E1, 20.E1, 21.E1, 22.E1
10.E1, 11.E1, 12.E1, 20.E1, 21.E1, 22.E1
10.E1, 11.E1, 12.E1, 20.E1, 21.E1, 22.E1
10.E1, 11.E1, 12.E1, 20.E1, 21.E1, 22.E1
10.E1, 11.E1, 12.E1, 20.E1, 21.E1, 22.E1
10.E1, 11.E1, 12.E1, 20.E1, 21.E1, 22.E1
10.E1, 11.E1, 12.E1, 20.E1, 21.E1, 22.E1
10.E1, 11.E1, 12.E1, 20.E1, 21.E1, 22.E1
9.2. Forced Zero Offset Compensation
This facility allows removal of static, or slow changing, magnetic fields, e.g. a local geomagnetic
field.
For each sensor channel, the average of the last N readings is taken to obtain an offset value;
this offset is subtracted from the current reading. The readings are stored in an averaging buffer.
The value of N can be varied by the user.
There are four controls for this function:
•
LOCK: Holds the offset at the current value and stops adding new data to the averaging
buffer.
•
CLEAR: Sets the offset to zero and fills the averaging buffer with zeroes.
•
SET: Sets the offset to the current reading and fills the averaging buffer with this value.
•
OFF: The offset is not subtracted from the current reading. The averaging buffer continues to
store readings.
Page 32 of 47OM2201/5
BARTINGTON INSTRUMENTS
9.3. Sample Rate Considerations
The A-to-D converter board consists of a high speed, 18 bit converter with a sample rate of
500Ksamples/sec. The board includes an analogue switch multiplexer, allowing the sampling
rate to be shared across 32 input channels. Hence, the actual sample rate per channel depends
on the number of channels selected to be active.
When the DAS1 is used with three-axis magnetometers, each magnetometer requires three
input channels. The maximum achievable sample rate per channel can be determined using the
formulae and table below.
The sample rate, S, per channel is given by:
S = ADC sample rate
Number of magnetometers x Channels per magnetometer
Taking the Nyquist sampling criterion, the maximum frequency response / bandwidth is given by
sample rate per channel:
Fmax = S
2
therefore
Fmax = ADC sample rate
2 x (Number of magnetometers x Channels per magnetometer)
Table 12. Number of data channels per magnetometer with sample rate and bandwidth.
No. of
No. of Data
Sample Rate
Bandwidth (kHz)
Magnetometers
Channels
(ksamples/sec)
1
3
166.67
83.33
2
6
83.33
41.67
3
9
55.56
27.78
4
12
41.67
20.83
5
15
33.33
16.67
6
18
27.78
13.89
7
21
23.81
11.90
8
24
20.83
10.42
9
27
18.52
9.26
10
30
16.67
8.33
As shown in Table 12, fully-populated Decaport / A-to-D board combination (10 three-axis
magnetometers) will use 30 input channels, but still provide a sample rate of 16.67 kHz per
channel, and a bandwidth of 8.33 kHz, at 18 bit resolution. If a higher sample rate per channel is
required, reduce the number of sensors connected to each Decaport / A-to-D board.
Page 33 of 47OM2201/5
BARTINGTON INSTRUMENTS
Note: These calculations indicate the sample rates available in the PXI A-to-D board hardware. If
the user extends the DAS1 LabVIEW application, the maximum achievable sampling rates may
be limited by other data processing activities being performed by the software.
9.4. Oversampling
Oversampling (data decimation) can be used to increase the native 18 bit A-to-D resolution.
Use the formula:
So = 4N
where:
N is the number of extra bits of binary data required;
So is the oversampling factor.
The oversampling factor can be set in the DAS1 software.
For example, to achieve 20-bit resolution, two extra bits are required, giving an oversampling
factor of 16. The effective sample rate is given by the A-to-D board per channel sample rate
divided by the oversampling factor. For a fully populated (10 x three-axis sensors) Decaport, the
effective sampling rate for 20 bit resolution is approx. 1kHz (16670 divided by 16).
9.5. Anti-aliasing Filter
The National Instruments PXI analogue input channels have an optional low pass filter set at
40kHz. However, this is located after the input multiplexer, severely reducing the maximum
sample rates. The DAS1 software does not enable the programmable filter and the cut off
frequency is fixed at 750kHz.
The software uses the low pass, anti-aliasing filter in the Decaport, with switchable settings for
each frequency.
Full details of the filter can be found in Section 7.6: Low Pass Filters.
9.6. Setup Screens
9.6.1. Start-up
When the software is started, the setup screen will be displayed (Figure 6).
Page 34 of 47OM2201/5
BARTINGTON INSTRUMENTS
Figure 6. Startup screen.
Immediately after starting the software (or when the Load button is clicked), a File Select box is
displayed (Figure 7) to allow the user to select a pre-saved configuration (.cfg) file. Select a file if
desired, or select Cancel to retain the current configuration settings.
Figure 7. File Select box (*** CONFIG.JPG)
Page 35 of 47OM2201/5
BARTINGTON INSTRUMENTS
Note: A complete system is supplied with the factory test file. This can be loaded to observe the
correct configuration for the system supplied.
9.6.2. Setup Control Window
This window (Figure 8) has the following fields:
•
Decaport Select: Lists the Decaports and A-to-D input cards that have
been detected within the DAS1. The select buttons for empty Decaport
slots will be greyed out. Clicking on each Decaport button displays its
sensor settings in the main window, for editing or review.
•
Save: Opens a window allowing the setup configuration to be saved as a
.cfg file.
•
Load: Opens a window allowing the setup configuration to be loaded
from a .cfg file.
•
OK: Closes the setup screen and displays the signal monitor screen.
9.6.3. Decaport Configuration Window
This window (Figure 9) has the following fields:
•
I/O slot: Shows the I/O slot number used within the LabVIEW software.
•
Sensor Fitted: Controls each of the Decaport inputs to be enabled (Fitted)
or disabled (Not fitted). When Fitted, the input is allocated three channels
of A-to-D converter sampling. If set to Not Fitted, no sampling channels
are allocated.
•
Input Type: Sets the input to Balanced or Unbalanced mode on the
Decaport. The magnetometer test function will operate on a sensor, if and
only if its input type is set to Balanced.
•
Sensor Scale Factor: Enter the scaling factor for your sensor in this field.
The value is interpreted as the ‘per volt’ quantity, using the units set in
‘Sensor Units’ (see below). For example, for a magnetometer with a full
scale of 100µT for 10V output, the output is 10µT per volt, so set this field to
10E-5 (0.00001).
Figure 8. Setup Control
window.
•
Sensor Units: Enter sensor units here, using a single character in base SI unit notation: e.g.
for a magnetometer, enter T for Teslas. Do not use additional multiplier symbols, e.g. µT. Do
not leave this field blank.
•
Sensor Tag: Enter a descriptive name for each sensor here or use the default names: Sensor
1, Sensor 2 etc. Do not leave this field blank.
Page 36 of 47OM2201/5
BARTINGTON INSTRUMENTS
•
Port 1-5 Power: Sets the ON/OFF state of the Decaport Power Supply for sensor ports 1 to 5.
•
Port 6-10 Power: Sets the ON/OFF state of the Decaport Power Supply for sensor ports 6 to
10.
•
Port 1-5 Voltage: Selects low (±12V) or high ( ±14V) power supply voltage for sensor ports 1
to 5.
•
Port 6-10 Voltage: Selects low (±12V) or high (±14V) power supply voltage for sensor ports 6
to 10.
•
Leakage Test: Initiates the cable leakage test, as the system starts up.
Caution: This button activates the test on all Decaports. Only Mag-03RC and DTS1 sensors are
compatible with the leakage test. Do NOT use leakage test if any incompatible sensors are
connected to the DAS1. The test may cause damage to the sensors. Refer to Section 7.5.4: Cable
Leakage Current Test.
Figure 9. Decaport Configuration window.
Page 37 of 47OM2201/5
BARTINGTON INSTRUMENTS
9.6.4. System Configuration Window
Figure 10. System Configuration window.
This window (Figure 10) has the following fields:
•
Sample Rate: Set the desired A-to-D conversion sample rate in this field. The same sample
rate is used on all sensor input channels. This rate is divided by the decimation factor
(below) to give the effective sampling rate per channel. Care must be taken in setting this to
a realistic value as the amount of processing will affect the maximum data the system can
process.
•
Decimation Factor: Set this parameter to select the desired level of oversampling to increase
effective A-to-D conversion resolution, as shown in the table below. This is used with the
sample rate (above) to determine the effective sampling rate.
Decimation Factor
Effective Resolution
1
18
4
19
Page 38 of 47OM2201/5
BARTINGTON INSTRUMENTS
16
20
64
21
256
22
1024
23
4096
24
•
Effective Sample Rate: This displays the effective sample rate per channel, after the
decimation factor has been applied.
•
Length of Display Buffer: This parameter sets the length (in number of samples at the
effective sampling rate, i.e. after decimation) of the display on the monitor screen.
•
Length of Offset Buffer: This parameter sets the length (parameter N in Section 9.2: Forced
Zero Offset Compensation) of the buffer used to calculate the forced zero offset average
(after decimation).
•
Data Save File: To save data in a file, enter the desired filename and path. If the field is blank,
data is displayed on screen but not saved.
•
Data Type: Selects the data storage format. Errors may be caused at high sample rates, if
data types that require significant processing are selected.
•
Trigger Source: Sets the source for the start trigger.
•
Trigger Edge / Voltage: Sets the trigger voltage level and rising/falling direction to start data
acquisition. When the trigger source voltage crosses the trigger threshold voltage, in the
correct edge direction, data acquisition will start.
•
Input Filter: Use these buttons to select the anti-aliasing filter, as described in Section 9.5:
Anti-aliasing Filter.
•
Data Process Filter: These settings control digital filtering that can be applied to the
sampled data, modifying the values for display. Low pass, high pass, bandpass or bandstop
filters can be selected. The upper and lower frequencies and the filter mathematical order
(‘slope rate’) can also be set. For more detailed information, refer to the LabVIEW help files
on the IIR cascade Filter with IC & set IIR software Filter VI’s.
•
FFT parameters: These fields set the control parameters for the Fast Fourier Transform
(FFT) display (spectrum analyser format). For more detailed information, refer to the
LabVIEW help files on the FFT Power Spectral Density VI.
•
Window: The time-domain window to apply to the time signal.
•
Averaging mode: Specifies the averaging used.
•
Number of averages: Specifies the number of averages used for RMS and vector
averaging.
Page 39 of 47OM2201/5
BARTINGTON INSTRUMENTS
10. Monitor Screens
10.1. Signal Monitor
The Signal Monitor window (Figure 11) is displayed when the user clicks ‘OK’ in the Setup Control
window.
Figure 11: Signal Monitoring window.
The Signal Monitor window displays the sampled data from sensors connected to the Decaports.
The window includes both:
•
a graphical oscilloscope style display, with the option to switch between time domain
(oscilloscope format) and frequency domain (spectrum analyser format)
•
a tabular format, showing data from each sensor in X,Y and Z columns.
The following controls are available:
•
Stop: Click on this button to close the DAS1 software (return to Windows).
•
Setup: Click on this button to return to the Setup and Configuration windows.
•
Input Filter: These buttons enable the user to change the anti-aliasing filter frequency
during data sampling.
•
Display Select: Toggles the graphical display between time domain (oscilloscope format) and
frequency domain (spectrum analyser format).
Page 40 of 47OM2201/5
BARTINGTON INSTRUMENTS
•
•
•
Table: This displays the sampled data in numerical table format, one row of three columns
(channels) for each sensor that has been set to Fitted in the Sensor Configuration window.
The table is also used to select the input channels that are present in the graphical display.
Double-clicking on the table box for a particular channel will:
•
add/remove the channel to/from those included in the graphical display, if Table Select
Control is in ‘View’ mode. Any number of channels can be shown in the time domain
display, but only one (the last selected) will be shown in frequency domain mode.
Channels currently displayed have a blue background.
•
set that channel’s sensor into test mode, if the sensor type is set to Balanced and if
Table Select Control is in ‘Test’ mode. Sensors in mode test have a red background.
Table Measurement: These buttons select the type of data that is displayed for each channel
in the table and written to the data save file:
•
AVE: The average of the display buffer values is used.
•
P-P: The peak-to-peak measurement of the values in the display buffer is used.
•
RMS: The Root Mean Square of the display buffer values is used.
•
Offset: The Forced Zero Offset value is used.
•
Sample: The most recent sampled data value is used. Use this setting to record all data
samples (after decimation) to be written to the data file. This gives a complete record of
the data collected, but will very quickly generate a large data file.
Table Select Controls: These set the mode for the display table:
•
View: Sets the table into View mode, allowing channels to be toggled in and out of the
graphical display.
•
Test: Sets the table into Test mode, allowing sensors to be toggled in and out of test.
•
Reset View: Clears all channels except sensor-1 channel-X from the graphical display,
and sets the table into View mode.
•
Test Active: This is illuminated when test is active on one or more sensors. Clicking
this button turns off all sensor tests and sets table into Test mode.
•
Offset Controls: Use this button to set the desired offset mode, as described in Section 9.2:
Forced Zero Offset Compensation. If the set button is flashing, the buffer contains insufficient
values to calculate a correct offset. After a period of time (dependent on the sample rate),
this situation will resolve automatically as sampled data fills the buffer.
•
FFT Controls: These controls set the parameters for the FFT display (spectrum analyser
format), as described in ‘FFT Parameters’ in Section 9.6.4: System Configuration Window.
Page 41 of 47OM2201/5
BARTINGTON INSTRUMENTS
•
Data Process Filter Controls: These controls alter the digital filter applied to the sampled
data, as described in ‘Data Process Filter’ in Section 9.6.4: System Configuration Window.
10.2. Power Monitor
The Power Monitor window (Figure 12) displays the readings from the most recent sensor and
cable leakage test (if enabled).
Figure 12. Power Monitor window.
The left hand table shows the power supply voltage and current for each sensor. Where a sensor is not
fitted, the current value is blank.
The right hand table shows internal supply voltages for each five-input section of the Decaport(s)
fitted. The rightmost column of this table shows the results of the leakage current test, if
enabled; if the leakage current test is not enabled, this column is blank.
The power monitor runs once at start-up, then stops to keep the system noise to a minimum.
•
Retest Button: Use this button to trigger the power monitor to run the power and cable (if
enabled) tests once. The system will complete one set of measurements, displaying the new
results as they are acquired.
Note: The data shown in the tables is intended only for detection of faulty sensors or
cables, rather than accurate determination of system power consumption.
Page 42 of 47OM2201/5
BARTINGTON INSTRUMENTS
11. Troubleshooting
Fault
Cause
Solution
No power in the
The circuit breaker
Check the circuit breaker switch on the rear
PXI chassis.
may have activated.
panel of the PXI rack. If the circuit breaker
activates for a second time, the equipment may
require repair.
No power to one
The PSU enable
Check in the software, or your own control
group of five
signal may not be set
program, that the Sensor PSU Enable signal for
sensors.
correctly.
these sensors is set to the correct state.
The sensor PSU
Power down the full system, allow to cool for a
protection fuse may
few minutes, then re-power to clear the fault.
have tripped.
Faulty signal from
a sensor.
The sensor input may
Check the settings in the software or your own
be set to the incorrect
control program.
type (balanced or
unbalanced).
Cable fault.
Check the cabling. If sensor is a Mag-03RC, use
cable leakage test (see Section 7.5.4.).
Unexpected
Data sampling may be
Ensure you have the anti-aliasing low pass
frequencies
causing aliasing.
filters set to a suitable value to match your
present in the
sampling frequency.
sensor signals.
If problems remain after following the troubleshooting guide, contact the Bartington Instruments
helpdesk.
12. Care and Maintenance
12.1. Cleaning
WARNING: Disconnect the electrical supply before performing any cleaning operation.
12.1.1. Dust Filters
The PXI chassis has two dust filters for the cooling fans in the rear panel. The filters require
periodic cleaning.
To access the filters:
1. Loosen the screw in the centre of the vented panel.
Page 43 of 47OM2201/5
BARTINGTON INSTRUMENTS
2. Remove the vented panel (right-hand end first).
3. Remove the filters and gently clean them with water.
4. Ensure the filters are completely dry, replace them, and refit the vented panel and its screw.
Note: The cleaning period will depend on your environmental conditions. A maximum
period of 6 months is suggested.
12.1.2. General
Other than the dust filters, periodic cleaning is not normally required.
If the system becomes soiled and cleaning is necessary:
1. Use a damp cloth to clean the outer surfaces.
2. Use an air duster to blow debris from the connectors.
WARNING: Ensure water does not enter the system. The system must be completely dry
before the electrical supply is reconnected.
Caution: Never use chemicals, such as solvents, when cleaning the DAS1.
Caution: Take particular care when cleaning around electrical connections. Bent or
damaged pins may cause the equipment to malfunction.
12.2. Calibration
Return the DAS1 to Bartington Instruments for calibration at the recommended intervals. Refer
to the calibration certificates for further details.
13. End of Life Disposal
This product (electrical and electronic equipment) should not be placed in municipal waste.
Check local regulations for disposal of electronic products.
Page 44 of 47OM2201/5
BARTINGTON INSTRUMENTS
Notes
Page 45 of 47OM2201/5
BARTINGTON INSTRUMENTS
Page 46 of 47OM2201/5
OM2201/5
The specifications of the products described in this brochure are subject to change without prior notice.
Bartington® is a registered trademark of Bartington Instruments Ltd in Australia, Brazil, Canada, China, the European
Community, India, Japan, the countries of the Madrid Agreement & Protocol™, Norway and the United States of America.
Windows® is a registered trademark of Microsoft Corporation in the United States and other countries.
National Instruments™ and LabVIEW™ are trademarks of National Instruments Corporation.
Bartington Instruments Limited
T: +44 (0)1993 706565
5, 10 & 11 Thorney Leys Business Park
F: +44 (0)1993 774813
Witney, Oxford, OX28 4GE, England
E: [email protected]
www.bartington.com