1
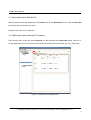
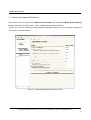
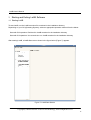
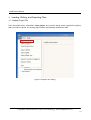
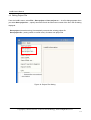
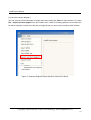
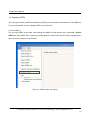
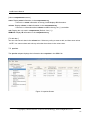
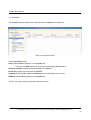
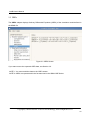
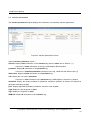
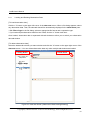
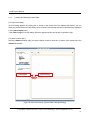
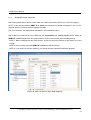
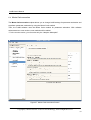
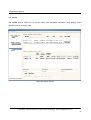
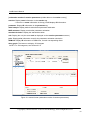
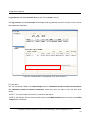
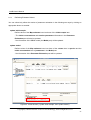
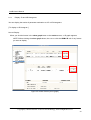
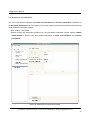
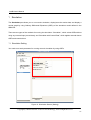
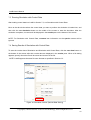
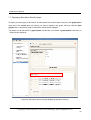
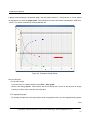
LetItB User’s Manual
Okinawa Institute of Science and Technology
Neural Computation Unit
Version 1 Dated April 21, 2008
LetItB User's Manual
Contents
1
Introduction.......................................................................................................................................... 4
2
Getting Started..................................................................................................................................... 5
3
4
5
6
2.1
Activating Program....................................................................................................................... 5
2.2
Loading SBML Sample File.......................................................................................................... 5
2.3
Displaying Diagram ...................................................................................................................... 6
2.4
Running Simulation ...................................................................................................................... 7
2.5
Saving Simulation Results File .................................................................................................... 8
2.6
Defining Simulation Results File Loading .................................................................................... 8
2.7
Performing Parameter Estimation................................................................................................ 9
2.8
Displaying Parameter Estimation Results.................................................................................. 10
2.9
Storing Project File ..................................................................................................................... 10
Starting and Exiting LetItB Software.................................................................................................. 11
3.1
Starting LetItB............................................................................................................................. 11
3.2
Exiting LetItB .............................................................................................................................. 12
Loading, Writing, and Exporting Files ............................................................................................... 13
4.1
Loading Project File ................................................................................................................... 13
4.2
Writing Project File ..................................................................................................................... 14
4.3
Loading SBML File ..................................................................................................................... 15
4.4
Writing SBML File....................................................................................................................... 16
4.5
Exporting Reaction Diagram ...................................................................................................... 17
4.6
Exporting ODEs ......................................................................................................................... 19
Model ................................................................................................................................................. 20
5.1
compartments............................................................................................................................. 20
5.2
species ....................................................................................................................................... 21
5.3
reactions..................................................................................................................................... 23
5.4
parameters ................................................................................................................................. 24
5.5
ODEs.......................................................................................................................................... 25
Parameter Estimation........................................................................................................................ 26
6.1
initial concentrations................................................................................................................... 26
6.2
reaction parameters ................................................................................................................... 28
6.3
data sets..................................................................................................................................... 29
6.3.1 Loading and Deleting Observation Data .................................................................................. 30
6.3.2 Loading and Deleting Control Data.......................................................................................... 31
6.3.3 Mapping External Input Data.................................................................................................... 32
6.4
Monte Carlo execution ............................................................................................................... 33
Copyright(c) Okinawa Institute of Science and Technology, 2007 All Rights Reserved
2
LetItB User's Manual
6.4.1 Setting Monte Carlo.................................................................................................................. 34
6.4.2 Estimating Parameters by the Monte Carlo method ................................................................ 34
6.4.3 Displaying a Progress Graph during Parameter Estimation.................................................... 35
6.5
results ......................................................................................................................................... 36
6.5.1 List Parameter Estimation Results........................................................................................... 37
6.5.2 Estimating log marginal likelihood............................................................................................ 40
6.5.3 Reflecting Estimated Values .................................................................................................... 41
6.5.4 Display 1D and 2D Histograms ................................................................................................ 42
6.5.5 Saving Parameter Estimation Results ..................................................................................... 47
6.6
7
timeseries reconstruction ........................................................................................................... 48
Simulation.......................................................................................................................................... 51
7.1
Simulation Setting ...................................................................................................................... 51
7.2
Running Simulation .................................................................................................................... 52
7.3
Loading and Deleting Control Data............................................................................................ 53
7.4
Mapping Control Data ................................................................................................................ 54
7.5
Running Simulation with Control Data ....................................................................................... 55
7.6
Saving Results of Simulation with Control Data ........................................................................ 55
7.7
Displaying Simulation Results Graph......................................................................................... 56
Copyright(c) Okinawa Institute of Science and Technology, 2007 All Rights Reserved
3
LetItB User's Manual
1 Introduction
LetItB is developed as a support tool to identify parameters for biochemical reactions. In the current
version, LetItB accepts SBML (Systems Biology Markup Language) files as inputs to visually perform the
following operations to the SBML models (SBML is the standard format for describing biochemical
reaction models in systems biology):
・ Create block diagrams to illustrate biochemical reaction networks
・ Run simulations
・ Identify reaction parameters and estimate their confidence intervals to provide the best recreation for
given experimental data (concentration time series of each molecule)
・ Assess quantitative model validity from data recreation and model complexity for given experimental
data
You can save these results as text files or image files such as jpeg or png via easy-to-use GUI.
LetItB’s internal calculation engine is programmed in C language and its Graphic User Interface is
developed with the Qt toolkit. Therefore, you can run and recompile LetItB on any platforms including
Windows, Mac OS X, and Linux operation systems if you install an appropriate set of libraries in
advance.
Copyright(c) Okinawa Institute of Science and Technology, 2007 All Rights Reserved
4
LetItB User's Manual
2 Getting Started
This chapter briefly describes how to use LetItB by using sample data. Try to use LetItB with sample data
by following the instructions in this section. Also, refer to Chapter 3 and later for detailed information
about each function.
2.1 Activating Program
Run the LetItB execution file contained in the installation directory.
Start with GUI operation: Double-click LetItB contained in the installation directory.
Start with CUI operation: Use a terminal to run LetItB contained in the installation directory.
Example: Start with CUI operation
From a terminal or like, move to the installation directory, and then execute the following
command:
> LetItB &
2.2 Loading SBML Sample File
From the LetItB’s menu, select File > Open SBML.
In the file dialog, select a SBML file.
Example: Loading a SBML file
Load the SBML sample file contained in the following folder:
“installation directory” > sampledata > Model01 > model.xml
Copyright(c) Okinawa Institute of Science and Technology, 2007 All Rights Reserved
5
LetItB User's Manual
Figure 1 SBML File Loading
2.3 Displaying Diagram
From the LetItB’s menu, select Tool > Show reaction diagram.
Then, you can see a diagram export window.
* The right figure in Figure 2 shows the resultant diagram when you load model.xml.
Figure 2: Reaction Diagram Operation Screen (Display)
Copyright(c) Okinawa Institute of Science and Technology, 2007 All Rights Reserved
6
LetItB User's Manual
2.4 Running Simulation
From the tree menu in the left pane, click Simulation.
Next, specify options in the ODE solver option pane on the right side of the screen.
Example: Setting ODE solver option
end time: 5 (Time to terminate the simulation)
number of time points: 50 (Number of simulation steps)
* Any options other than above are set by default
Finally, click the run simulation button to start the simulation.
Figure 3: Simulation Run Screen
Copyright(c) Okinawa Institute of Science and Technology, 2007 All Rights Reserved
7
LetItB User's Manual
2.5 Saving Simulation Results File
After simulation results are displayed in the results pane on the Simulation screen, click the save data
button and save the file with any name.
Example: File name: sim_results.dat
2.6 Defining Simulation Results File Loading
From the tree menu on the left, select data sets. On the right side of the data sets screen, click the “+”
on the upper left corner of the screen, and load the previously saved results file (e.g. sim_results.dat).
Figure 4 : Results File Loading Screen
Copyright(c) Okinawa Institute of Science and Technology, 2007 All Rights Reserved
8
LetItB User's Manual
2.7 Performing Parameter Estimation
From the tree menu on the left, select Monte Carlo execution and click the run Monte Carlo sampling
button on the right side of the screen. Then, LetItB starts parameter estimation.
NOTE: The run time required for each parameter estimation depends on your machine environment
and other environment factors.
Figure 5 : Parameter Estimation Execution Screen
Copyright(c) Okinawa Institute of Science and Technology, 2007 All Rights Reserved
9
LetItB User's Manual
2.8 Displaying Parameter Estimation Results
After parameter estimation completes, select results from the tree menu on the left. Then, a list of the
estimation results is displayed on the right side of the screen.
You can view more detailed information about the results by using the open 2D stat window button or
the log marginal likelihood checkbox on the same screen.
NOTE: For more information, see Section 6.5 “results”.
Figure 6 : Estimation Results Display Screen
2.9 Storing Project File
To save the current project status, select File > Save project as… from the LetItB’s menu.
When a file dialog appears, specify a desirable file name and save the file.
Copyright(c) Okinawa Institute of Science and Technology, 2007 All Rights Reserved
10
LetItB User's Manual
3 Starting and Exiting LetItB Software
3.1 Starting LetItB
To start LetItB, run the LetItB execution file contained in the installation directory.
Depending on your OS (Operating System), select an appropriate operation method from the below:
Start with GUI operation: Double-click LetItB contained in the installation directory
Start with CUI operation: Use a terminal to run LetItB contained in the installation directory
After starting LetItB, a LetItB Start screen shown in the figure below (Figure 7) appears.
Figure 7: LetItB Start Screen
Copyright(c) Okinawa Institute of Science and Technology, 2007 All Rights Reserved
11
LetItB User's Manual
3.2 Exiting LetItB
To exit LetItB, select File > Exit from the LetItB’s menu or click the “×” button on the upper right corner of
the screen.
Figure 8: LetItB Exit Screen (Sample)
Copyright(c) Okinawa Institute of Science and Technology, 2007 All Rights Reserved
12
LetItB User's Manual
4 Loading, Writing, and Exporting Files
4.1 Loading Project File
From the LetItB’s menu, select File > Open project, and in the file dialog, select a project file (.lbp file).
After you select a .lbp file, the existing project data is automatically loaded into LetItB.
Figure 9: Project File Loading
Copyright(c) Okinawa Institute of Science and Technology, 2007 All Rights Reserved
13
LetItB User's Manual
4.2 Writing Project File
From the LetItB’s menu, select File > Save project or Save project as…. As a file dialog appears when
you select Save project as…, specify where the file will be saved and a name of the file in the file dialog
displayed.
Save project (overwrite saving): Automatically overwrite the existing project file
Save project as... (saving under a new file name): Create a new project file
Figure 10: Project File Writing
Copyright(c) Okinawa Institute of Science and Technology, 2007 All Rights Reserved
14
LetItB User's Manual
This LetItB software allows you to load/write project files both in the SBML (System Biology Markup
Language) Level 1 and Level 2 formats.
For the units to be used in LetItB, liter (l), Mol (mol) and second (s) are used, unless expressly defined in
the compartment, species and parameter tags in SBML files.
(For parameter, however, LetItB displays “unknown” by default if no unit definition is found in the
parameter tag.)
4.3 Loading SBML File
From the LetItB’s menu, select File > Open SBML and select a SBML file in the file dialog. After
selecting a file, the SBML file data is automatically loaded into LetItB.
Figure 11: SBML File Loading
Copyright(c) Okinawa Institute of Science and Technology, 2007 All Rights Reserved
15
LetItB User's Manual
4.4 Writing SBML File
From the LetItB’s menu, select File > Save SBML or Save SBML as…. As a file dialog appears when
you select Save SBML as…, specify where the file will be saved and a name of the SBML file in the file
dialog.
Save SBML (overwrite saving): Automatically overwrite the existing SBML file
Save SBML as... (saving under a new file name): Create a new SBML file
Figure 12: SBML File Writing
Copyright(c) Okinawa Institute of Science and Technology, 2007 All Rights Reserved
16
LetItB User's Manual
4.5 Exporting Reaction Diagram
You can export a diagram of the simulation model defined in SBML files.
[ To display Reaction Diagram ]
After loading the SBML file (See Section 4.3), select Tool > Show reaction diagram from the LetItB’s
menu. Then, a reaction diagram export window will be displayed (Figure 13).
Figure 13: Reaction Diagram Export Operation Screen (Display)
Diagram Export Window
+ button: Zoom in the diagram
- button: Zoom out the diagram
* The right figure shows the resultant diagram when
loading sample data.
Figure 14: Resultant Reaction Diagram Export
Copyright(c) Okinawa Institute of Science and Technology, 2007 All Rights Reserved
17
LetItB User's Manual
[ To save the reaction diagram ]
You can save the reaction diagram as image data. After loading the SBML file (See Section 4.3), select
File > Export reaction diagram from the LetItB’s menu. When a file dialog appears, select where the
file will be exported, a name of the file and an image format you want to save, and then save the data.
Figure 15: Reaction Diagram Export Operation Screen (File Store)
Copyright(c) Okinawa Institute of Science and Technology, 2007 All Rights Reserved
18
LetItB User's Manual
4.6 Exporting ODEs
You can export Ordinary Differential Equations (ODEs) of the simulation model defined in the SBML file.
For more information on how to display ODEs, see Section 5.5.
[ To save ODEs ]
You can save ODEs as text data. After loading the SBML file (See Section 4.3), select File > Export
ODEs from the LetItB’s menu. When a file dialog appears, select where the file will be exported and a
name of the file, and then save the data.
Figure 16: ODEs Export (File Store)
Copyright(c) Okinawa Institute of Science and Technology, 2007 All Rights Reserved
19
LetItB User's Manual
5 Model
The Model part is divided into 5 subparts: compartments, species, reactions, parameters and ODEs.
With the Model part, you can display a list of relevant items of the loaded SBML file and edit their
numeric data.
By selecting one of the subparts (compartments, species, reactions, parameters or ODEs) under
Model in LetItB Parameters in the left pane, you can list corresponding information of the selected
subpart in the right pane.
5.1 compartments
The compartments subpart displays the information about compartment in the SBML file.
Figure 17: compartments Screen
Copyright(c) Okinawa Institute of Science and Technology, 2007 All Rights Reserved
20
LetItB User's Manual
[ About compartments screen ]
name: Display name information in the compartment tag
* If there is no name information in the tag, LetItB displays ID information.
volume: Display volume or size information in the compartment tag
* If there is no information about volume or size in the tag, set ( l ) as default.
unit: Display the unit used in compartment (Default : liter ( l ))
SBML ID: Display ID information in the compartment tag
[ To edit data ]
You can edit numeric data in the volume item. Select any cells you want to edit, and then enter values.
NOTE: You cannot select and edit any cells other than those in the volume item.
5.2 species
The species subpart displays the information about species in the SBML file.
Figure 18: species Screen
Copyright(c) Okinawa Institute of Science and Technology, 2007 All Rights Reserved
21
LetItB User's Manual
[ About species screen ]
name: Display name information in the species tag
* If there is no name information in the tag, LetItB displays ID information.
initial concentration: Display initialConcentration information in the species tag
* If there is no initialConcentration information in the tag, define (1) as default.
unit: Display the unit used in species (Default: mol/l)
initial amount: Display the initial amount defined as initial concentration information
* The initial amount is calculated by the calculation formula:
volume item in the compartments subpart × initial concentration item in the compartments
subpart × 6.022e+23
compartment: Display compartment information in the species tag
constant: Display constant information in the species tag
* If there is no information about constant in the tag, “false” (constant = false) is set by
default.
SBML ID: Display ID information in the species tag
[ To edit data ]
You can edit numeric data in the initial concentration item and the check box in the constant item. If
you edit the initial concentration item, select any cells you want to edit, and then enter values.
With the check box in the constant item, you can enable/disable the check box by clicking appropriate
cells.
NOTE: You cannot select and edit any cells other than those in the initial concentration and constant
items.
Copyright(c) Okinawa Institute of Science and Technology, 2007 All Rights Reserved
22
LetItB User's Manual
5.3 reactions
The reactions subpart displays the information about reaction in the SBML file.
Figure 19: reactions Screen
[ About reactions screen ]
name: Display name information in the reaction tag
* If there is no name information in the tag, LetItB displays ID information.
chemical equation: Display chemical equations for reaction
kinetic law: Display the kinetic law for reaction
parameters: Display ID or name of parameter and corresponding numeric data
SBML ID: Display ID information in the reaction tag
NOTE: You cannot edit the data on the reactions screen.
Copyright(c) Okinawa Institute of Science and Technology, 2007 All Rights Reserved
23
LetItB User's Manual
5.4 parameters
The parameters subpart displays the information about parameter in the SBML file.
Figure 20: parameters Screen
[ About parameters screen ]
reaction: Display name information in the reaction tag (See the name item in Section 5.3)
*If there is no name information in the tag, LetItB displays ID information.
parameter: Display ID information in the parameter tag
value: Display value information in the parameter tag
unit: Display the unit used in parameter
* If there is no unit information in the tag, LetItB displays “unknown” by default.
kinetic law: Display the kinetic law for parameter
chemical equation: Display the chemical equation for parameter
reaction ID: Display ID information in the reaction tag
[ To edit data ]
You can edit numeric data in the value item. Select any cells you want to edit, and then enter values.
NOTE: You cannot select and edit any cells other than those in the value item.
Copyright(c) Okinawa Institute of Science and Technology, 2007 All Rights Reserved
24
LetItB User's Manual
5.5 ODEs
The ODEs subpart displays Ordinary Differential Equations (ODEs) of the simulation model defined in
the SBML file.
Figure 21: ODEs Screen
If you want to save the exported ODEs data, see Section 4.6.
NOTE 1: You cannot edit the data on the ODEs screen.
NOTE 2: ODEs are represented in the formats used in the SBML ODE Solver.
Copyright(c) Okinawa Institute of Science and Technology, 2007 All Rights Reserved
25
LetItB User's Manual
6 Parameter Estimation
The Parameter Estimation part is divided into 6 subparts: initial concentrations, reaction parameters,
data sets, Monte Carlo execution, results and timeseries reconstruction. Using the simulation
model defined in the loaded SBML file, you can list relevant items, edit numeric data, perform the
parameter estimation, display results and save the estimation results data.
By selecting one of the subparts (initial concentrations, reaction parameters, data sets, Monte Carlo
execution, results or timeseries reconstruction) under Parameter Estimation in LetItB Parameters
in the left pane, you can list corresponding information of the selected subpart in the right pane.
6.1 initial concentrations
The initial concentrations subpart displays the information on estimating initial concentrations.
Figure 22: initial concentrations Screen
Copyright(c) Okinawa Institute of Science and Technology, 2007 All Rights Reserved
26
LetItB User's Manual
[ About initial concentrations screen ]
name: Display name information in the species tag
* If there is no name information in the tag, LetItB displays ID information.
initial value: Display initialConcentration information in the species tag
* If there is no initialConcentration information in the tag, LetItB sets (1) as default.
unit: Display the unit used in species (Default: mol/l)
estimated: Display the factors enabled for parameter estimation (Default: All factors are defined for
parameter estimation targets)
prior: Display applicable probability distribution functions used as prior
arg0: Display the first argument of prior
arg1: Display the second argument of prior
SBML ID: Display ID information in the species tag
[ To edit data ]
You can edit numeric data in initial value, arg0 and arg1 items. Select any cells you want to edit, and
then enter values.
With the check boxes in the estimated item, you can enable/disable any factors you want for parameter
estimation targets by clicking appropriate cells.
NOTE 1: You cannot select and edit any cells other than above.
NOTE 2: No values you edit in the initial value item on the initial concentrations screen will be
reflected in those on the species screen.
NOTE 3: With the estimated item, parameter estimation will be performed for only the factors selected
with enabled check boxes.
Copyright(c) Okinawa Institute of Science and Technology, 2007 All Rights Reserved
27
LetItB User's Manual
6.2 reaction parameters
The reaction parameters subpart displays the information on estimating reaction parameters.
Figure 23: reaction parameters Screen
[ About reaction parameters screen ]
reaction: Display name information in the reactions tag (See the name item in Section 5.3)
* If there is no name information in the tag, LetItB displays ID information.
parameter: Display ID information in the parameter tag
* If there is no initialConcentration information in the tag, LetItB sets the default value (1).
initial value: Display volume information in the parameter tag
unit: Display the unit used in parameter
* If there is no unit information in the parameter tag, LetItB displays “unknown” by default.
estimated: Display the factors enabled for parameter estimation (Default: All factors are defined for
parameter estimation targets)
prior: Display applicable probability distribution functions used as prior
arg0: Display the first argument of prior
arg1: Display the argument of prior
SBML ID: Display ID information in the reactions tag
Copyright(c) Okinawa Institute of Science and Technology, 2007 All Rights Reserved
28
LetItB User's Manual
[ To edit data ]
You can edit numeric data in the initial value, arg0 and arg1 items. Select any cells you want to edit,
and then enter values.
With check boxes in the estimated item, you can enable/disable any factors you want for parameter
estimation targets by clicking appropriate cells.
NOTE 1: You cannot select and edit any cells other than above.
NOTE 2: No values you edit in the initial value item on the reaction parameters screen will be
reflected in those on the species screen.
NOTE 3: With the estimated item, parameter estimation will be performed for only the factors selected
with enabled check boxes.
6.3 data sets
Any observation data and control data to be used for parameter estimation can be loaded into LetItB
from external files (or deleted from LetItB). If no observation data is loaded into LetItB, you cannot
perform any estimate simulation for parameter estimation.
LetItB supports the following five text file formats for external files:
Comma Separated Values
Tab Separated Values
Space Separated Values
Semicolon Separated Values
* For your reference, see SampleData contained in the installation folder.
Copyright(c) Okinawa Institute of Science and Technology, 2007 All Rights Reserved
29
LetItB User's Manual
6.3.1
Loading and Deleting Observation Data
[ To load observation data ]
Click the “+” button on the upper left corner of the data sets screen. When a file dialog appears, select
any observation data. Then, the selected data will be automatically displayed in the observation pane.
* With Files of type in the file dialog, select an appropriate file format and a separation type.
* If you load multiple observation data files into LetItB, click the “+” button each time.
Once loaded, observation data is separated with tab windows to allow you to switch your observation
data tab window.
[ To delete observation data ]
Select the dataset tab window you want to delete and click the “×” button on the upper right corner of the
data sets screen. * You can delete observation data only when multiple tab windows are loaded.
Loading Button
Delete Button
Figure 24 : data sets Screen (Observation Data Loading/Deleting)
Copyright(c) Okinawa Institute of Science and Technology, 2007 All Rights Reserved
30
LetItB User's Manual
6.3.2
Loading and Deleting Control Data
[ To load control data ]
As a file dialog appears by clicking the “+” button in the center left of the dataset tab window, you can
select any control data in the file dialog. Once selected, the selected data will be automatically displayed
in the control inputs pane.
* With Files of type in the file dialog, select an appropriate file format and a separation type.
[ To delete control data ]
Select the dataset window (tab) you want to delete, and then click the “×” button in the center left of the
dataset tab window.
Load Button
Delete Button
Figure 25: data sets Screen (Control Data Loading/Deleting)
Copyright(c) Okinawa Institute of Science and Technology, 2007 All Rights Reserved
31
LetItB User's Manual
6.3.3
Mapping External Input Data
After loading observation data or control data into LetItB, select all the factors you need for mapping.
NOTE: If your required factors (SBML ID or name) are contained as header information in line 1 of the
external input file, you don't need to perform this step.
(For your reference, see SampleData contained in the installation folder.)
After loading the external file into LetItB with the observation and control inputs panes, select all
SBML ID or Name targets from the combo boxes in all the columns other than the time column.
NOTE 1: Before mapping with the combo boxes, be sure to select all columns for the factors you need
to map.
NOTE 2: Do not select the same SBML ID or Name for different factors.
NOTE 3: If you define no correct mapping, you cannot perform parameter estimation properly.
Figure 26: data sets Screen (Input Data Mapping)
Copyright(c) Okinawa Institute of Science and Technology, 2007 All Rights Reserved
32
LetItB User's Manual
6.4 Monte Carlo execution
The Monte Carlo execution subpart allows you to change LetItB settings for parameter estimation and
to perform parameter estimation by using the Monte Carlo method.
Then, the LetItB software uses the Monte Carlo method for parameter estimation. With software
enhancements or new versions, new methods will be added.
* For the current version, you can select only the “adaptive Metropolis”.
Figure 27: Monte Carlo execution Screen
Copyright(c) Okinawa Institute of Science and Technology, 2007 All Rights Reserved
33
LetItB User's Manual
6.4.1
Setting Monte Carlo
The Monte Carlo execution subpart displays settings information for parameter estimation.
method: Display the Monte Carlo method you use (adaptive Metropolis)
[ About adaptive metropolis settings ]
number of total samples: Display the number of samples
alpha0: Display the first argument of prior
beta0: Display the second argument of prior
mrate: Display the information on the mixing rate
kappa: Display regularization parameters for the covariance matrix
sd_c: Display parameter information for scaling
eta0: Display the information about default values for update interval
lambda_a: Display the information about forgetting factors
* The default values displayed on the adaptive metropolis settings screen are recommended to use as
simulation run-time effective values.
[ To edit data ]
You can edit numeric data in all the items (number of total samples, alpha0, beta0, mrate, kappa,
sd_c, eta0, lambda_a) except for method in the Monte Carlo setting pane. Select any cells you want
to edit, and then enter values.
To change the data to the recommended values, click the set recommend value (default) button in the
top of the pane.
NOTE 1: You cannot enter any values out of the range.
6.4.2
Estimating Parameters by the Monte Carlo method
To estimate parameters, click the run Monte Carlo sampling button on the Monte Carlo execution
screen.
NOTE: The run time required for each parameter estimation depends on your machine environment
and other environment factors such as SBML models and the number of total samples.
Copyright(c) Okinawa Institute of Science and Technology, 2007 All Rights Reserved
34
LetItB User's Manual
6.4.3
Displaying a Progress Graph during Parameter Estimation
During parameter estimation, a progress window showing how parameter estimation is proceeding will
be displayed. An error graph and a log posterior graph for parameter estimation will be displayed in
real-time if you select their check boxes in the window.
show error graph / show error graph (log scale):
Display the sum of square error graph
* From the combo box, you can change the vertical scale of a graph.
log posterior graph:
Display the log posterior density graph
Figure 28: Run time Progress Window displayed during Parameter Estimation
Copyright(c) Okinawa Institute of Science and Technology, 2007 All Rights Reserved
35
LetItB User's Manual
6.5 results
The results subpart allows you to list the results after parameter estimation, draw graphs, reflect
estimated values, and save data.
Figure 29: results Screen
Copyright(c) Okinawa Institute of Science and Technology, 2007 All Rights Reserved
36
LetItB User's Manual
6.5.1
List Parameter Estimation Results
The results subpart lists estimation results for each factor and any corresponding information.
[ estimation results of initial concentrations (top table on the results screen) ]
species: Display name information in the species tag
* If there is no name information in the tag, LetItB displays ID information.
initial sample: Display default values before parameter estimation
MAP estimator: Display results after parameter estimation
standard deviation: Display the standard deviation
unit: Display the unit (the same unit as displayed on the initial concentration screen)
prior: Display prior information used for the parameter estimation simulation
SBML ID: Display ID information of SBML files, for each corresponding factor
show graph: The button to display a 1D histogram
NOTE: For 1D histograms, see Section 6.5.4.
Figure 30: results Screen (estimation results of initial concentrations)
Copyright(c) Okinawa Institute of Science and Technology, 2007 All Rights Reserved
37
LetItB User's Manual
[ estimation results of reaction parameters (middle table on the results screen) ]
reaction: Display name information in the reaction tag
* If there is no name information in the tag, LetItB displays ID information.
parameter: Display ID information in the parameter tag
initial sample: Display default values before parameter estimation
MAP estimator: Display results after parameter estimation
standard deviation: Display the standard deviation
unit: Display the unit (the same unit as displayed on the reaction parameters screen)
prior: Display prior information used for the parameter estimation simulation
SBML ID: Display ID information of SBML files, for each corresponding factor
show graph: The button to a display 1D histogram
NOTE: For 1D histograms, see Section 6.5.4.
Figure 31: results Screen (estimation results of reaction parameters)
Copyright(c) Okinawa Institute of Science and Technology, 2007 All Rights Reserved
38
LetItB User's Manual
[ log posterior and error function (Bottom part of the results screen) ]
The log posterior and error function fields display final log posterior and error function numeric values
after parameter estimation.
Figure 32: results Screen (“log posterior” and “error function”)
[ To edit data ]
You can edit numeric data in the initial sample items in estimation results of initial concentrations
and estimation results of reaction parameters. Select any cells you want to edit, and then enter
values.
NOTE 1: You cannot select and edit any cells other than above.
NOTE 2: See Section 6.5.3 for how to reflect values of the MAP estimator item into those of the initial
sample item collectively.
Copyright(c) Okinawa Institute of Science and Technology, 2007 All Rights Reserved
39
LetItB User's Manual
6.5.2
Estimating log marginal likelihood
You can estimate the marginal likelihood on log scale. To start estimation, select the log marginal
likelihood check box highlighted in red below.
NOTE 1: By default, the log marginal likelihood check box is not selected.
NOTE 2: The run time required for each log marginal likelihood estimation depends on your machine
environment and other environment factors such as SBML models and the number of total samples.
Figure 33: results Screen (log marginal likelihood)
Copyright(c) Okinawa Institute of Science and Technology, 2007 All Rights Reserved
40
LetItB User's Manual
6.5.3
Reflecting Estimated Values
You can collectively reflect the results of parameter estimation in the following two ways by clicking an
appropriate button as needed:
update initial sample:
Reflect values of the Map estimator item into those of the initial sample item.
* The initial concentrations and reaction parameters information in the Parameter
Estimation part will also be updated.
* No information of the SBML model (the Model part) will be updated.
update model:
Reflect values of the Map estimator item into those of the volume item in species and the
initial concentration item of parameters in the Model part.
* No information of the Parameter Estimation part will be updated.
Figure 34: results Screen (“update initial sample” and “update model”)
Copyright(c) Okinawa Institute of Science and Technology, 2007 All Rights Reserved
41
LetItB User's Manual
6.5.4
Display 1D and 2D Histograms
You can display the results of parameter estimation as 1D or 2D histograms.
[ To display a 1D histogram ]
How to Display:
When you click the button in the show graph items on the results screen, a 1D graph appears.
NOTE: Before clicking the show graph button, be sure to click the SBML ID cell of any factors
you want to display.
Figure 35: results Screen (show graph)
Copyright(c) Okinawa Institute of Science and Technology, 2007 All Rights Reserved
42
LetItB User's Manual
About 1D Graphs:
1D histograms are displayed to show probability density in vertical axis and histogram bins in
horizontal axis. Both vertical axis and horizontal axis are automatically set by default when the 1D
histogram is displayed first time.
About graph components
Green Bar Graph: Histogram
Red Solid Line: The MAP estimator values
Blue Dotted Line: The lower bound and upper bound values for confidence interval (99% by
default)
Light Green Solid Line: Resultant graph after histogram smoothing (Disabled by default)
LetItB displays the 1D graph with the above settings. In addition, LetItB displays numeric values for
the above items in the bottom part of the histogram window.
Figure 36: 1D Histogram Window
Copyright(c) Okinawa Institute of Science and Technology, 2007 All Rights Reserved
43
LetItB User's Manual
How to Configure:
1 To save an image:
From the menu of the histogram window, select File > Save graph.
When a file dialog appears, select where the file will be saved, a name of the file and the image
format you want to save, and then save the data.
2 To modify the X axis:
Enter values in min as the minimum value, in max as the maximum value and in bins as the number
of histogram bins. Then click the replot button.
3 To smooth the graph:
Enable/disable the smoothing check box, and then click the replot button.
4 To set confidence interval:
Enter any number between 0 and 100 in XX % confidence interval, and then click the replot
button.
NOTE: You cannot edit any values in MAP estimator, lower bound and upper bound.
[ To display 2D histograms ]
How to Display:
When you click the open 2D stat window button on the results screen, a 2D graph appears.
Copyright(c) Okinawa Institute of Science and Technology, 2007 All Rights Reserved
44
LetItB User's Manual
About 2D Graphs:
2D histograms are displayed to show any factors you specify for both vertical and horizontal axes.
Each axis is automatically set by default when the 2D histogram is displayed at first time.
LetItB displays the 2D histogram by calculating two factors and indicates the number of histogram bins
by color changes. The color for bins changes from blue (few bins) to red (many bins), according to the
color bar on the right side of the graph.
In addition, numeric values for the above items are displayed at the bottom part of the histogram
window.
Figure 37: 2D Histogram Window
Copyright(c) Okinawa Institute of Science and Technology, 2007 All Rights Reserved
45
LetItB User's Manual
How to Configure:
1 To save an image:
From the menu of the histogram window, select File > Save graph.
When a file dialog appears, select where the file will be saved, a name of the file and an image
format you want to save, and then save the data.
2 To change the axes settings:
Select any factors you want to display for both of the X and Y axes.
* If you select factors for the axes, the minimum value and the maximum value for them are
automatically set.
3 To edit the axes:
Enter values in min as the minimum value, in max as the maximum value and in grids as grid
spacing for the axes. Then, click the replot button.
NOTE: The run time required to plot the 2D histogram depends your machine environment and other
environment factors such as the estimated number of samples and the settings for the grid spacing
specified in grids.
Copyright(c) Okinawa Institute of Science and Technology, 2007 All Rights Reserved
46
LetItB User's Manual
6.5.5
Saving Parameter Estimation Results
You can save the results of parameter estimation in the following three ways by clicking an appropriate
button as needed:
save effective samples:
Display only effective results of parameter estimation by each occurrence of the number of
simulation steps. When you click the button, a file dialog appears. Specify where the file will be
saved and a name of the file.
save all samples:
Display all results of parameter estimation by each occurrence of the number of simulation
steps. When you click the button, a file dialog appears. Specify where the file will be saved and
a name of the file.
save results:
Save the information on the results screen in the text format. When you click the save results
button, a file dialog appears. Then, specify where the file will be saved and a name of the file.
NOTE: Only for save effective samples and save all samples, LetItB supports the same file save
formats as specified in Section 6.3.
Figure 38: results Screen (Parameter Estimation Results Saving)
Copyright(c) Okinawa Institute of Science and Technology, 2007 All Rights Reserved
47
LetItB User's Manual
6.6 timeseries reconstruction
You can run timeseries simulation with initial concentrations and reaction parameters information in
the Parameter Estimation part. This allows you to easily view the results of the timeseries simulation by
using parameter estimation results.
* See Chapter 7 Simulation.
* Before running the timeseries simulation by using parameter estimation results, perform update
initial sample in Section 6.5.3, and update information in initial concentrations and reaction
parameters.
Figure 39: timeseries reconstruction Screen
Copyright(c) Okinawa Institute of Science and Technology, 2007 All Rights Reserved
48
LetItB User's Manual
[ ODE solver option ]
end time: The time to terminate the simulation (Default: 10)
* The start time is set to 0
number of time points: The number of simulation time steps (Default: 1000)
size of time intervals: The interval between simulation time steps
(end time ÷ number of time points = size of time intervals)
relative error tolerance: Tolerance error margin of simulation results - Relative unit (Default: 1 × 10⁻⁸)
absolute tolerance: Tolerance range of simulation results - Absolute unit (Default: 1 × 10-12)
* Unless expressly specified in SBML files, second (s) is used for a unit of time.
[ To edit the data in ODE solver option ]
You can edit numeric data in the end time, number of time points, relative error tolerance, and
absolute tolerance items. Select any cells you want to edit, and then enter values.
[ To run the timeseries simulation ]
Select any data set from the select item on the middle of the timeseries reconstruction screen, and
then click the run simulation button to start the simulation. The index, dataset XX, in the select item is
linked to the tab index on the data sets screen described in Section 6.3.
NOTE 1: If you don’t select proper items from the select item, you cannot run the simulation.
NOTE 2: If you don’t load control data into LetItB on the data sets screen, you can run the simulation
without control data. If you load control data into LetItB on the data sets screen, you can run the
simulation with the control data.
[ To display timeseries simulation results ]
When the timeseries simulation completes, its results will be displayed in the results pane on the bottom
of the timeseries reconstruction screen.
[ To save timeseries simulation results data ]
After the timeseries simulation completes, click the save data button on the bottom of the timeseries
reconstruction screen. When a file dialog appears, specify where the file will be saved and a name of
the file.
NOTE: LetItB supports the same file save formats as specified in Section 6.3.
Copyright(c) Okinawa Institute of Science and Technology, 2007 All Rights Reserved
49
LetItB User's Manual
[ To display timeseries simulation results graphs]
From the graph option check box in the results pane, select any factors you want to display in the
graph, and then click the draw graph button. The timeseries graph of simulation results will be
displayed.
* For more information on how to display graphs, see Section 7.5.
A graph window displays a timeseries graph, with simulation results in Y axis and time in X axis, based
on the factors you select in graph option. The simulation result for each factor is displayed in solid lines,
and observation data from the selected dataset is displayed with “×” marks.
Figure 40: Graph Window for timeseries reconstruction
How to Configure:
1 To save an image:
From the menu of the graph window, select File > Save graph.
When a file dialog appears, select where the file will be saved, a name of the file, and an image
format you want to save, and then save the data.
2 To display / hide the graph:
By clicking the captions in the upper right corner of the graph window, you can display/hide the
graph.
Copyright(c) Okinawa Institute of Science and Technology, 2007 All Rights Reserved
50
LetItB User's Manual
7 Simulation
The Simulation part allows you to run numeric simulation, display/save the results data, and display a
results graph by using Ordinary Differential Equations (ODEs) of the simulation model defined in the
SBML file.
There are two types of the methods for running the simulation: “Simulation”, which solves ODEs without
using any external input (control data), and “Simulation with Control Data”, which applies external data to
ODEs and controls them.
7.1 Simulation Setting
You need to set each parameter for running numeric simulation by using ODEs.
Figure 41: Simulation Screen (Setting)
Copyright(c) Okinawa Institute of Science and Technology, 2007 All Rights Reserved
51
LetItB User's Manual
[ ODE solver option ]
end time: The time to terminate the simulation (Default: 10)
* The start time is set to 0
number of time points : The number of time steps in simulation (Default: 1000)
size of time intervals: The interval between simulation time steps
(end time ÷ number of time points = size of time intervals)
relative error tolerance: Tolerance error margin of simulation results - Relative unit (Default : 1 × 10⁻⁸)
absolute tolerance: Tolerance range of simulation results - Absolute unit (Default : 1 × 10-12)
* Unless expressly specified in SBML files, second (s) is used for a unit of time.
[ To edit data in ODE solver option ]
You can edit numeric data in the end time, number of time points, relative error tolerance, and
absolute tolerance items. Select any cells you want to edit, and then enter values.
NOTE: The values you set in ODE solver option will be reflected in both Simulation and Simulation
with Control Data ways.
7.2 Running Simulation
After setting properly as shown in Section 6.1, click the run simulation button on the middle of the
Simulation screen (tab window) to start the simulation. After the simulation completes, its results will be
displayed in the results pane on the bottom part of the screen.
NOTE: For Simulation (without Control Data), any factors where the check boxes in the constant item
on the species screen are selected will be the values for initial concentration (the constant value).
Copyright(c) Okinawa Institute of Science and Technology, 2007 All Rights Reserved
52
LetItB User's Manual
7.3 Loading and Deleting Control Data
[ To load control data ]
Click the “+” button on the upper left corner of the Simulation screen. When a file dialog appears, select
any control data file. Selecting a file automatically moves you to a new tab window, and displays the
selected data in the control inputs pane in the new tab window.
* With Files of type in a file dialog, select an appropriate file format and separation type.
* If you load multiple control data files into LetItB, click the “+” button each time.
Once loaded, observation data is separated with tab windows to allow you to switch your data tab
window.
* LetItB supports the same file formats for loading control data, as specified in Section 6.3.
[ To delete control data ]
Select the tab window you want to delete, and then click the “×” button on the upper right corner of the
Simulation screen.
* You can delete observation data only when there are multiple tab windows.
Load Button
Delete Button
Figure 42: Simulation Screen (Setting)
Copyright(c) Okinawa Institute of Science and Technology, 2007 All Rights Reserved
53
LetItB User's Manual
7.4 Mapping Control Data
After loading control data into LetItB, map them to an appropriate SBML ID or name.
NOTE: If SBML ID or name is contained as header information in line 1 of the external input file,
you don't need to perform this step.
(For your information, see SampleData contained in the installation folder.)
In the control inputs pane where control data are loaded into, from the combo boxes in all the columns
other than time column, select any SBML ID or Name you want to use as control data.
NOTE 1: Before mapping with the combo boxes, be sure to select all columns for the factors you need
to map.
NOTE 2: Do not select the same SBML ID or Name for different factors.
NOTE 3: If you define no correct mapping, you cannot run Simulation with Control Data properly.
Figure 43: Simulation Screen (Control Data Mapping)
Copyright(c) Okinawa Institute of Science and Technology, 2007 All Rights Reserved
54
LetItB User's Manual
7.5 Running Simulation with Control Data
After loading control data into LetItB in Section 7.3, run Simulation with Control Data.
Move to the tab window where the control data you want to perform the simulation is loaded into, and
then click the run simulation button on the middle of the screen to start the simulation. After the
simulation completes, its results will be displayed in the results pane on the bottom of the screen.
NOTE: For Simulation with Control Data, constant item information on the species screen will be
ignored.
7.6 Saving Results of Simulation with Control Data
To save the results data of Simulation and Simulation with Control Data, click the save data button on
the bottom of the screen after their results data are displayed in the results pane. When a file dialog
appears, specify where the file will be saved and a name of the file.
NOTE: LetItB supports the same file save formats as specified in Section 6.3.
Figure 44: Simulation Screen (Results Data Saving)
Copyright(c) Okinawa Institute of Science and Technology, 2007 All Rights Reserved
55
LetItB User's Manual
7.7 Displaying Simulation Results Graph
To display a results graph of Simulation and Simulation with Control Data, select from the graph option
check box in the results pane any factors you want to display in the graph, and then click the draw
graph button. A timeseries graph of simulation results will be displayed.
* By default, not all the factors in graph option are selected. If no factors in graph option is selected, no
graph can be displayed.
Figure 45: Simulation Screen (Graph Displaying Operation Screen)
Copyright(c) Okinawa Institute of Science and Technology, 2007 All Rights Reserved
56
LetItB User's Manual
A graph window displays a timeseries graph, with simulation results in Y axis and time in X axis, based
on the factors you select in graph option. The simulation result for each factor is displayed in solid lines.
NOTE: The colors of solid lines are automatically set.
Figure 46: Timeseries Graph Screen
How to Configure:
1 To save an image:
From the menu of a graph window, select File > Save graph.
When a file dialog appears, select where the file will be saved, a name of the file and an image
format you want to save, and then save the data.
2 To display/hide graph:
By clicking the captions in the upper right corner of a graph window, you can display/hide the graph.
End
Copyright(c) Okinawa Institute of Science and Technology, 2007 All Rights Reserved
57


![libsbml[5pt] Developer`s Manual](http://vs1.manualzilla.com/store/data/005677524_1-a4aef53ff9933c16603010582721c07c-150x150.png)