1
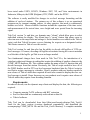
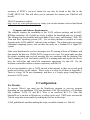
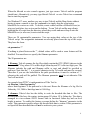
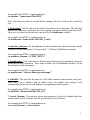
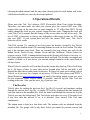
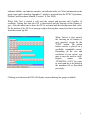
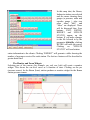
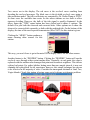
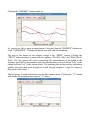
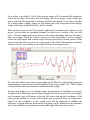
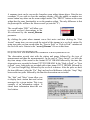
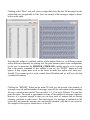
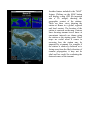
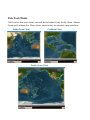
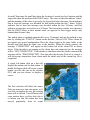
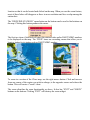
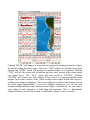
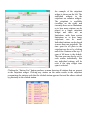
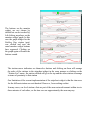
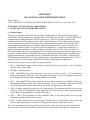
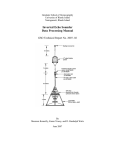
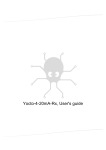
Tide Tool Manual V9.2 July 2012 Tide Tool Version 9.20, Client Version 2.0 Abstract Tide Tool is an operational tool developed and supported by the Pacific Tsunami Warning Center for the decoding, display, and manipulation of sea level data transmitted over the WMO Global Telecommunications System (GTS). Tide Tool continuously decodes GTS sea level messages in real-time and displays the time series on a computer screen; users are able to interactively manipulate the time series to measure wave amplitude and period, and to remove the tidal signal. Non-operational versions also exist for data transmissions through the internet (ftp) and for archived data. 1. Introduction Tide Tool is created by the Tide.tcl script, which is based on the Tcl/Tk extension called “BLT”. Tcl/Tk is an open source, platform-independent software package. Tcl/Tk at its heart is a robust shell programming language (tclsh) with a powerful, graphical toolkit (wish) (Appendix I). Tide Tool v9.x also requires the Tk extension BWidget. Tide.tcl provides end users with the ability to decode, display, and manipulate sea level data broadcast over the Global Telecommunications System of the World Meteorological Organization (WMO). Data are continuously downloaded directly from the GTS to a data file, which is then decoded and displayed. The displays can be converted into postscript and printed. A version is also available using a non-GTS ‘ftp’ data transmission protocol in Linux and Windows XP/Vista for tsunami centers without GTS links (install instructions can be found in Appendices III and IV). The ‘ftp’ method should be considered non-operational if commercial internet service is utilized since connection reliability and timeliness, especially during tsunami emergencies, cannot be guaranteed. The software application was originally developed by the US NOAA NWS Pacific Tsunami Warning Center to provide an operational tool for the real-time continuous tsunami monitoring in the Indian Ocean. Its primary users would be National Meteorological and Hydrological Service (NMHS), or other agencies with a down link from the GTS or to a data file containing those data formatted in a similar manner. It has 1 been tested under UNIX, LINUX, Windows 2007, XP, and Vista environments in Indonesia, Malaysia, the IODE (Belgium), ITIC, PMEL and at the PTWC. The software is easily modified for changes in sea-level message formatting and the addition of sea-level stations. The primary use of this software is as an operational program run by tsunami warning centers, or other agencies, that need to continuously monitor sea levels. Mouse-clickable functions include the expansion of the time series, and measurement of the arrival time, wave height and wave period from the incoming signal. Tide Tool version 7.x and later, use dynamic map “clients” which allow users to select individual stations for display. The clients have a “zoom” feature that allows users to select an area on the map client and enlarge it. Socket handlers were added to the Tide.tcl script, such that Tide.tcl becomes a server listening for requests on a designated socket. The clients connect to Tide.tcl over this socket. Tide Tool version 8.x and later also has the ability to decode old logfiles of GTS sealevel messages. Of course, decoding old logfiles necessitates having the correct metadata as of the date of the logfile. getTide is now no longer needed. Two fundamental changes have been made in Tide Tool V9.x, the introduction of a stripchart widget and changes in coding that require the addition of another column to the COMP_META database file. This column contains the name of the Tcl function that will decode messages from that station. Previously, the Tide.tcl script needed to have all of the WMO headers used in GTS sea-level messages hardwired into the Tide.tcl script in an effort to assign a message to a decoder. Hence, products with new headers required a new release of Tide.tcl which then required all users who wanted to display the new sealevel message to install. I hope from now on, new products won’t require a new release of Tide.tcl unless they require a new decoding function. Requirements: In order to decode, run the dynamic map clients and display the data, the following are required: Computer running Tcl/Tk software with BLT extension Sea level data that are continuously archived into a data file Tide.tcl software Tide Tool can be downloaded from http://ilikai.soest.hawaii.edu/ptwc/Tide_Toolv9. Look for the latest version (versions numbered sequentially) and download the accompanying COMP_META file and the Tide_Coeffs directory. A complete metadata 2 inventory of PTWC’s sea-level station list can also be found at this link in the COMP_META file. This will allow you to customize the stations your TideTool will decode. The IOC maintains a website : http://www.ioc-sealevelmonitoring.org/ where you can also monitor sea-level and obtain information about sea-level stations. Computer and Software Requirements: The software requires the installation of the Tcl/Tk software package and the BLT, BWidget extensions, all of which are freely available for download and easy to install. The software has been installed and tested under Unix, Linux, and Windows 2000, XP, Vista and Win7 operating systems (OS). Use on other platforms is possible as it only depends on the Tcl/Tk and BLT software being available. The software does not require substantial computing power, and can thus run easily on a Pentium III or higher PC system. Some users download the sea-level messages on a PC running a flavor of Windows and then transfer the data to a UNIX/LINUX system or vice versa. You must make sure that the scripts, metadata and sea-level message files are consistent with the platform Tide Tool is running on. Tide Tool checks what OS it is running under and expects the files to have the end-of-line and end-of-file terminators appropriate for that OS. Use the dos2unix or unix2dos utilities to ensure consistency with the OS. It is not our intention to give a Tcl/Tk tutorial in this manual, as there are several good books and websites on the subject. Please refer to a short list of them in Appendix I. There is a large Tcl/Tk user community, and there is a Google group (comp.lang.tcl) devoted to Tcl/Tk issues. 2. Configuration For Decoder To execute Tide.tcl, you must run the bltwish.exe program or wize.exe program depending on your installation. ITIC now distributes Tide Tool with Wize, a Tk package that combines Tcl/Tk 8.5 and BLT. Wize is an unofficial BLT 2.5. Note that bltwish24.exe is an alias to bltwish.exe, so either can be used. UNIX users can turn the Tide.tcl script into an executable by making the first line in the script: #!/full_path/bltwish and then making the script executable (chmod u+x Tide.tcl). 3 When the bltwish or wize console appears, just type source Tide.tcl and the program should start. Alternatively, you may type bltwish Tide.tcl or wize Tide.tcl on a command line to start the program. For Windows PC users, another easy way to start Tide.tcl and the Map clients without having to open a console to type the command is to simply drop the script onto a bltwish24.exe or wize.exe icon. To do this, create a short cut/alias of bltwish24.exe (or wize.exe) and place it as an icon on the desktop. To run Tide.tcl and the map clients, highlight the tcl script from the directory where they reside and move/drop it onto the bltwish24.exe (or wize.exe) icon to start the script. There are 20 customizable parameters. You can assign their values at the top of the Tide.tcl script. The assignment statements are already placed near the top of the script. They have the form: set parameter “” If nothing is placed between the “”, default values will be used or some features will be disabled. You must however specify the filename parameter. The 20 parameters are: 1. filename: Tide.tcl assumes the log files which contain the GTS (WMO) data are in the form rootJJJYY.log where JJJ is a three digit Julian day and YY is the two digit year. The filename includes the path and filename suffix or root, and should be specified as path/root. Note that the ‘\’ is a special character in the Tcl world and must be escaped. Therefore if you use the backslash in the path specification, it must be written as ‘\\’ otherwise the path will be garbled. The filename parameter must be set otherwise Tide Tool will not work. An example from PTWC’s implementation of Tide Tool is: set filename “/data/logs/nmc/sr” where /data/logs/nmc/ is the path and sr is the root. Hence the filename of a log file for Julian day 116, 2006 is /data/logs/nmc/sr11606.log . 2. dirname: Tide.tcl also has the ability to write the decoded tide data to files. The decoded data files have the syntax: station.gauge.JJJ where JJJ is Julian day. The data is arranged in a two-column ASCII format: time in fractional Julian day and sea-level height in meters. To enable this feature you must define the “dirname” parameter in the script. This parameter specifies where the decoded tide data is written. If this parameter is not specified then decoded data will not be written to your system. 4 An example from PTWC’s implementation is: set dirname “/home/stuart/Tide/2009/” Note: This directory must be created before running Tide.tcl; it will not be created for you. 3. hardirname: Tide.tcl will now de-tide the decoded sea-level messages. The files that contain the harmonic coefficients have the naming convention station_code.tide.coeffs. They are to be placed in the directory specified by the hardirname variable. An example from PTWC’s implementation is: set hardirname “/home/stuart/Tide/Tide_Coeffs/” 4. metadata_filename: The full pathname for the metadata file which determines which stations to decode and display. If not specified, “./TideTool_MetaData is assumed. An example from PTWC’s implementation is: set metadata_filename “./COMP_META” 5. mapdirname: Tide Tool can now display maps showing the geographical context in which the sea-level station lies. These maps contain a lot of information and they will be described later in this document. An example from PTWC’s implementations: set mapdirname "/data/ttt_dbase/geoware/maps/" 6. tilelistfile: This specifies the name of a file which contains station-sensor code pairs. After Tide Tool is finished with its initial read of the logfile after startup it will automatically tile the screen with displays corresponding to those stations. An example from PTWC’s implementation is: set tilelistfile “/home/stuart/Tide/Tile_List” 7. record_filename: You can now record measurements of sea-level heights and those measurements will be written to the file specified by record_filename. An example from PTWC’s implementation is: set record_filename “../observations” 5 8. error_log: Messages with bad time stamps, improper formats and unrecognized headers will be written to the file specified by error_log. An example from PTWC’s implementation is : set error_log “Error_log” The actual logfiles will be error_log.jd where jd is Julian Day. 9. printer_command: Tide Tool stores the latest 100 messages from each tide station. These messages are viewable and can be made printable if the variable printer_command is set to the local system’s printer command. An example from my implementation is: set printer_command “enscript –fCourier-Bold8 2> /dev/null” 10. TWC_DART_FORMAT: If this is set to “1”, Tide Tool will write the decoded DART data files using the same format as does PTWC. An example of that format is given below: File: 55015_nha_2008.235 The filename is composed of the DART buoy number, a three letter code and the year and Julian day. The three letter code can be one of nha, tra, tha, nhb, trb, thb, which indicate normal transmission mode (nha, nhb), trigger transmission mode (tra, trb) and triggered hourly messages (tha, thb). The contents of file 55015_nha_2008.235 look like: # DART_Tasman_Sea_55015 dtas nha 55015 NDBC NORMAL_MODE -46.9222 160.5622 2008234 # DART m UTC 15 min Water_Depth PTWC Unfiltered # DCP_PLATFORM_ID 55015P # Data Format: SampleTIme(seconds from midnight 1/1/1970) WaterLevel SampleTime(yyyymmddhhmmss) 1219276800 04944.306 20080821000000 1219277700 04944.378 20080821001500 1219278600 04944.442 20080821003000 1219279500 04944.504 20080821004500 1219280400 04944.556 20080821010000 1219281300 04944.602 20080821011500 1219282200 04944.643 20080821013000 1219283100 04944.670 20080821014500 1219284000 04944.694 20080821020000 1219284900 04944.709 20080821021500 1219285800 04944.708 20080821023000 1219286700 04944.700 20080821024500 1219287600 04944.684 20080821030000 1219288500 04944.659 20080821031500 1219289400 04944.625 20080821033000 6 The first column is the epochal time (seconds since midnight 1/1/1970), the second is the water column thickness in meters and the right column is the human readable time at the time of measurement. 11. num_buttons_row: This parameter sets the number of buttons per row on the main decoder GUI. The next several parameters control the appearance of the sea-level graphs. 12. plot_width and 13. plot_height: These parameters set the dimensions of the basic Tide Tool sea level displays like that shown below for Benoa. An example value would be 3.0i where ‘i’ stands for inches. Likewise, the dimensions can be specified as 3.0c where ‘c’ is for cm. The defaults are 7.0i and 3.0i respectively. 14. plot_bg, 15. plot_obs, 16. plot_cor, 17. plot_pre: These parameters set the background color for the displays and the colors for the observed, corrected, and predicted sea-level curves. 18. plot_dir, 19. plot_pri_com specify the directory where postscript files of the displays are placed and the system printer command used to print them. The printer must be understand postscript. 19. strip_plot_width, 20. strip_plot_height specify the width and height of the plots in the stripchart widget. The defaults are 8.0i and 1.5i respectively. Starting with Tide Tool V8.0, these parameters can also be configured using environment variables. This way you will not have to edit the Tide.tcl script to customize it for your implementation. For example in C-shell you can have: setenv setenv setenv setenv setenv setenv setenv setenv setenv FILENAME /data/logs/nmc/sr DIRNAME /data/logs/nmc/wl METADATA_FILENAME /dbase/water/COMP_META HARDIRNAME /dbase/tide/ MAPDIRNAME /data/ttt_dbase/geoware/maps/ TILELISTFILE "" PRINTER_COMMAND "enscript -f Courier-Bold8 >& /dev/null/" RECORD_FILENAME /home/ptwc/io/params/water/obs/tsu_measures ERROR_LOG setenv NUM_BUTTONS_ROW 12 setenv TWC_DART_FORMAT 1 7 setenv setenv setenv setenv setenv setenv setenv setenv setenv setenv PLOT_WIDTH 6.0i PLOT_HEIGHT 3.0i STRIP_PLOT_WIDTH 8.0i STRIP_PLOT_HEIGHT 1.5i PLOT_BG white PLOT_OBS red PLOT_COR black PLOT_PRE blue PLOT_DIR /home/ptwc/io/params/water/station_plot/ PLOT_PRI_COM "lp -d hp3700" If the environment variable is set for a parameter, its value will take precedence over the setting in the Tide.tcl script. For Clients The clients have 10 required parameters however, you should be able to use the clients with little modification. The only parameters that you need to configure are the metadata_filename and Map_File_Name parameters. The parameter descriptions are as follows: 1. left_lon and 2. rht_lon : These parameters represent the longitude limits of the map. 3. top_lat and 4. bot_lat : These parameters represent the latitude limits of the map. 5. Image_Width_Pixels and 6. Image_Height_Pixels: The width and height of the map in pixels. 7. Map_File_Name : The name of the map file. As an example, for the Pacific client we specify the map file using: set Map_File_Name "./pacific_ocean_map.gif" 8. metadata_filename : This is the name of the metadata file (full pathname). 9. client_title : The name of the client that appears at the top of the client. 10. scale : The amount by which the selected area will expand when creating a client zoom widget. A scale value of three seems to give good results. A scale value greater than three produces somewhat fuzzy maps. You can use non-integers, but then the 8 generation of the client zoom widget may take several tens of seconds depending on your computer. For the clients there are four total environment variables: setenv METADATA_FILENAME COMP_META setenv PAC_MAP_FILENAME ./pacific_ocean_map.gif “ IND_MAP_FILENAME ./indian_ocean_map.gif “ CAR_MAP_FILENAME ./carribbean_map.gif The other parameters are not installation dependent. You can certainly generate your own map files (in the GIF format) and if you change the above parameters in the client Tcl/Tk scripts you can create your own clients. For now, the clients can only do the linear/cylindrical projection. However, I expect to add the math needed to do some other common projections like the Mercator in the future. The COMP_META File The COMP_META file is a flat file database containing a list of all stations decoded by Tide Tool. The COMP_META file has 18 columns and the metadata it contains includes the geographic coordinates for each station, and a number of parameters that facilitates the decoding of the sea-level messages. These parameters are described in Appendix II. Any line in the metadata file that begins with “#” will be ignored. When Tide Tool starts it performs a “quality” check on the metadata file and will stop if the metadata file is not configured properly. One can construct a customized metadata file using just the stations of interest. An example of this is the TideTool_Metadata file that is also available at the ftp site. This metadata file is customized for the Indian Ocean. The metadata can be organized into regions of your choice by placing a region name like “SUMATRA_JAVA” on a line by itself. The region name is your choice, however, white space is not allowed, hence underscores “_” must be used instead of blank space. The presence of region names will cause the main GUI to be segmented into different regions making it easier to locate stations on the GUI. An example is given in section 3. To be consistent, the same Metadata file (parameter ‘metadata_filename’) should be used in both Tide.tcl and the map clients (Atlantic_Client.tcl, Pacific_Client.tcl, Indian_Client.tcl, Caribbean_Client.tcl). This will ensure that the Tide.tcl station GUI 9 (showing decoded stations) and the map client (showing dots for each station with colorcoded station health) are correctly shown and updated. 3. Operational Details Please note that Tide Tool enforces GMT (Greenwich Mean Time) when decoding. Therefore, you must make sure that your system gives the correct GMT time. This requires that you set the time zone on your computer to “0” offset from GMT. Do not simply change the clock on your system; change the time zone. Changing the clock will cause Tide Tool to assume that the change of day occurs either too late or too early. The use of GMT is necessary to remove any ambiguities with respect to time, as GTS data also uses GMT. If your system does not have the correct GMT time, Tide Tool’s behavior will be erratic. Tide Tool version 7.0+ consists of two basic parts, the decoder (created by the Tide.tcl script) with the familiar main GUI containing buttons for each sea-level station. The other part is the dynamic map client. There are currently four map clients; one each for the Indian Ocean, Pacific Ocean, Atlantic Ocean and the Caribbean. Tide.tcl listens for requests on port 15500. Communication between the decoder and clients is two-way i.e., the clients and decoder can send instructions back and forth. The decoder can support any number of clients, so if you choose, you can run multiple instances of the same client, or all four clients. When Tide.tcl is started it will read data from the current day data log. Tide.tcl will keep up to ~48 hours of data. As more data arrives beyond what Tide.tcl can hold, it will discard the older data to make room for the new. We have left some active debug code in Tide.tcl, so if you see a lot of output, do not worry. If Tide.tcl fails, please send PTWC’s Stuart Weinstein ([email protected]) as much of the debug output as you can, up to the last statement before Tide.tcl failed. If possible, send the log file Tide Tool was reading at the time. Also send the error_log if you have one. The Decoder Tide.tcl starts by reading the previous day’s log file (if it exists) and continues reading through the current day’s log file. A simple GUI will be displayed that has buttons for each tide station in the metadata file. After the initial read through the current day log file Tide.tcl goes into the background. Tide Tool sleeps and wakes up every 20 seconds to see if any new data has arrived. If so, it is decoded. Once started, Tide Tool runs continuously. The station name is listed as a four-letter code. The stations codes are obtained from the metadata file. The gauge code is only three letters; prs stands for pressure sensor, bub 1 0 indicates bubbler, enc indicates encoder, rad indicated radar, etc. More information on the gauge types can be found in Appendix V, which is extracted from the PTWC Operations, Systems, and Procedures Manual (Version 1.0, Dec 2008). When Tide Tool is started it will read the current and previous day's logfiles (if available). During this time the GUI is deactivated and the lettering on the buttons is grey. After the initial read is done, the GUI is activated and the lettering turns dark violet. On the bottom of the GUI is a message widget showing how many bytes have been read from the current log file. When Tide.tcl is first started, the lettering on all buttons is grey (inactive) except for the “EXIT” button. The station button section is placed on a scrollable, expandable canvas. Depending on the size and resolution of your screen, you may or may not need to scroll. Region names like “SUMATRA_JAVA” are yours to create and are to be placed in the metadata file as described previously. Clicking on a button in the GUI will display a menu showing the gauges available: 1 1 In this snap shot, the Benoa, Indonesia station was selected and the menu showing three gauges (a pressure, radar and encoder gauge ) plus two other items “Info” and “Mess” are displayed. Those will be discussed later. Four buttons, EXIT, RETILE, REPORT and UPDATE STATUS appear on the bottom. If you make changes to the file referred to by the parameter tilelistfile, clicking RETILE will retile the screen. Clicking on “UPDATE STATUS” will send station status information to the clients. Clicking “REPORT” will generate a table showing the number of messages received for each station. The last two features will be described in greater detail later The Monitor and Zoom Widgets Selecting one of the sensors (for example, prs, rad, enc, bub) will create a monitor widget. This shows the sea-level curve as a function of time. Clicking on the prs (pressure sensor) for the Benoa (beno) station produces a monitor widget for the Benoa station pressure sensor: Two curves are in the display. The red curve is the sea-level curve resulting from decoding the sea-level messages. The black curve is the de-tided sea-level curve using a tide prediction model. The tide coefficients are computed by Dr. Dailin Wang at PTWC. In some cases the available time series for the newer stations are too short to allow rigorous de-tiding. However, the bulk of the tide signal is usually eliminated. In the above figure the “TIDE” menu button has been clicked and it shows 4 options. The default is to plot both the observed and corrected tides. Other options are to show the observed or corrected tide separately or both with the predicted tide. On the bottom of the display, the time of the next expected transmission (Next XMT) for this station is given. Clicking the “MENU” button produces a menu showing other sensors for this station: This way, you won’t have to go to the main GUI to display curves for the other sensors. Another feature is the “DESPIKE” button. Clicking the “DESPIKE” button will run the sea-level curve through a three point median filter. Basically, at each point, the value is replaced with the median value amongst that point and its nearest neighbors. This deletes solitary bad points. For spikes/glitches lasting more than one sample interval, it may not eliminate the spike/glitch. In our experience, however, this simple technique has proven to be effective in the majority of cases. Consider the mareogram obtained at Lime Tree, Virgin Islands. Clearly this station is having some sort of software or telemetry problem: Clicking the “DESPIKE” button results in: As you can see, this is quite an improvement. Also note that the “DESPIKE” button now reads “UNDESPIKE”. Clicking this button now will undo the despiking. The next to last button on the monitor widget is the “PRINT” button. Clicking the “PRINT” button produces a menu with two options; “Plot File Only” and “Make Plot & Print”. The first option will create a postscript file representation of the graph in the directory specified by the parameter plot_dir with the form ccccsss.ps where “cccc” is the station code and “sss” is the station sensor. The resulting plots are not exactly publication quality, but more than good enough for record keeping purposes. I expect to improve these plots in the future. The last group of numbered buttons sets the time span in hours. Clicking the “12” button will change the maximum time span to “12” hours. As new data is decoded by Tide.tcl, the monitor widget will be automatically updated to reflect the new data. The widget will only display data for no longer a span of time than what is selected. The maximum is 48 hours and that is the default. If new data is decoded for a station while a display widget for that station exists, the background of that display widget will change from black to blue for 0.6 seconds. What operations can you do? By using the right button or number three button on your mouse, you can draw an expanding rectangle to zoom in on a section of the sea-level curve. Hold the right button down and move the mouse diagonally, and you will draw a thin red rectangle. When the section of curve you wish to examine is in the rectangle, release the right button, and a zoom widget will pop-up with the selected portion of time serious expanded. This was done on a mareogram of the 2010 Chile tsunami recorded at Acapulco (acap). The resulting zoom widget is shown in the figure below: You can also further zoom on the zoom widget itself. When the right button is released, the appropriate section of curve will be displayed in the zoom widget. The “TIDE” button at the top left has the same function as with the monitor widget. On the zoom widget you can conduct simple measurements of amplitude and period. Using the left or number one mouse button, simply click on the curve in the zoom widget, and a summary inset will appear in the top left corner showing the coordinates of the point you just clicked on. A cross will mark the spot you picked. After a second point is clicked on, the coordinates of the second point will be displayed. In addition the difference in height and time between the two points will be displayed on the summary inset. Time difference is in minutes:seconds, and height differences are in meters. A summary inset can be seen on the Acapulco zoom widget shown above. Note the two crosshairs. If you wish to clear the summary display, click the middle or number two mouse button any where on the zoom widget canvas. The “PRINT” button on the zoom widget has the same functionality as on the monitor widget. The only difference is that the postscript file will have the form ccccsssZ.ps (note the ‘Z’). The record button “REC” will allow you to record sea-level observations in the file referenced by the record_filename parameter. By clicking the point where tsunami waves first arrive and then clicking the “First Arrival” menu item, you can record the arrival of the tsunami at a sea-level station. By using two picks you can record either the “Zero to Peak” or “Peak to Peak” variation on the sea-level curve. Entries in the “record_filename” file are in this form: kota prs First Arrival 111/07 08:43 2007111 11:48 kota prs Peak to Peak 111/07 08:43 H 00.208 111/07 09:08 H 00.155 Per 00:24 Amp 00.052 2007111 11:48 The observation records start with the station and gauge followed by the type of measurement and then the measurement(s). In the case of “First Arrival”, we have the day time stamp of the arrival in the format JJJ/YY HH:MM followed by the time this observation was recorded in format YYYYJJJ HH:MM. In the “Peak to Peak” or “Zero to Peak” cases, both picks are recorded with a time stamp JJJ/YY HH:MM followed by “H” (sea-level height flag) followed by the sea-level in meters. After the picks we have the time difference (after the “Per” flag) and sea-level difference (after the “Amp” flag) between the two picks followed by the time the observation was recorded. The “Info” and “Mess” items allow you to display basic station data and recent messages for a given station. This is an example of an information widget. It shows basic information about the sealevel station. Clicking on the “Mess” item will create a widget that shows the last 100 messages for the station that were recognizable to Tide Tool. An example of the messages widget is shown below on the right: Note that this widget is scrollable and has a print button. However, as different systems utilize different commands for printing text, the print button requires some configuration by the user. In particular the PRINTER_COMMAND variable must be set to a string that is the printer command. If this variable is not set, the “PRINT” button will not appear. It may require more work in the future to make this option a bit more userfriendly. If you cannot get it to work, contact Stuart Weinstein and we will try to develop a customized solution. Clicking the “REPORT” button on the main GUI will give an account of the number of messages received and the number of messages expected for each station in the metadata file over a specified time period. You can select 3, 6, 12 or up to 48 hours. You can also print the report. The report is approximate in terms of the number of messages expected, however it is accurate enough so that you can keep track of stations that are having telemetry problems or other issues. Note that receipt of a message as indicated on the report does not mean the message was successfully decoded; only that it was received. An example of the report is shown above, to the left. Another feature included is the “MAP” feature. Clicking on the MAP button will display a map (GIF file imported into a Tk widget) showing the geographic context of the stations. There are three views showing the station at Benoa in a global, regional and local context. The location of the station is centered on the map. Contour lines showing tsunami travel times at one-minute intervals are drawn using the station as the starting point. These maps are useful when it comes to assessing how the station may be impacted by a tsunami. For example if the station is relatively sheltered or is facing away from the likely direction of tsunami propagation, it may not be ideal and less useful for evaluating the destructiveness of the tsunami. Tide Tool Clients Tide Tool has four basic clients, one each for the Indian Ocean, Pacific Ocean, Atlantic Ocean and Caribbean Sea. These clients, shown below, are interactive map interfaces. Indian Ocean Client Caribbean Client Pacific Ocean Client In each Client map, the small dots show the location of coastal sea-level stations and the larger dots show the position of the DART buoys. The colors of the dots indicate “status” and the meaning of the colors is given by the legend just below the map. Green indicates that at least one message was decoded for that station within the last 7 hours. Yellow indicates that at least one message was decoded within the last 24 hours, and Red indicates no messages received in over 24 hours. The reason these criteria were chosen is that the DART buoys in their normal mode (as opposed to their trigger mode) only transmit data 4 times a day. The station status is updated automatically every 30 minutes and can be updated at any time by clicking the “STATUS” button on the decoder (Tide.tcl) GUI. These clients do not require any special configuration. Place the client scripts in the same folder as the decoder and start them the same way as the decoder. When the clients connect, the message “CONNECTED” will appear on the bottom left of the client GUI as shown above. If the decoder is not running or the clients have not connected yet, the message will be “NOT CONNECTED”. If the decoder is shut down after the clients connected the message will be “DISCONNECTED’. Note that after the decoder (Tide.tcl) is started, it will not accept connections from clients until the initial read of the current log file is completed. A single left button click on a dot will display the station code for that station. A double left button click will create a menu button, just like the one on the decoder GUI, and you can choose to display a sensor. The Exit selection will delete the menu. Only one menu at a time can appear, so if you click on another dot, any pre-existing menu will be deleted. You will notice that some stations have a yellow halo; this is to inform you that the station has been moved, graphically, from its actual location so that it can be located and clicked on the map. When you use the zoom feature, most of these halos will disappear as there is more resolution and less overlap among the station dots. The “DISP/FIND STATIONS” menu button on the bottom can be used to find stations on the map. Clicking this button produces the menu: The first two items if checked will cause the station codes and/or DART NDBC numbers to be displayed on the map. The “FIND” items are cascading menus that allow you to locate a station by its station code or DART NDBC number: To zoom in a section of the Client map, use the right mouse button. Click and traverse from one corner of the region you wish to enlarge, to the opposite corner and release the button. This will create a “zoom” client The zoom client has the same functionality as above. It also has “EXIT” and “SHOW” buttons on the bottom. Clicking “EXIT” will destroy the zoom widget. Clicking “SHOW” will bring up a menu with two options for displaying monitor widgets for stations within the zoom widget. These are “TILE” which was available in previous releases and “STRIP” which will arrange the monitor widgets in a stripchart. Clicking “TILE” will tile the screen with all stations that have data, present in the zoom region (see figure above). The “TILE” option will then switch to “UNTILE”. Clicking “UNTILE” will remove the tiled widgets. Client version 2.x supports multiple zoom widgets. In previous versions of the Client, creating zoom widget would cause any preexisting zoom widget to disappear. The zoom widgets keep track of what stations exist in the zoom region independently. If you have multiple workspaces, you can tile each workspace independently using a different zoom widget. Alternatively, one can create a strip widget in each workspace, or both tiling and stripcharts. This is a fundamental change in behavior from Client version 1.x and makes version 2.x more versatile. An example of the stripchart widget is shown on the left. The individual widgets in the stripchart are monitor widgets. The stripchart is scrollable (scrollbar on the right) and currently there are no limitations as to how many stations can be placed in a single stripchart widget and there are no limitations, aside from system limitations as to how many stripcharts can be made. Individual stations can be placed in more than one stripchart. The time span for all plots in the stripchart can be set by clicking and of the 4 buttons at the top. A span of 48 hours is the default. The time span can also be set for each station individually. But any individual settings will be reset if the strip widget time span is selected. Clicking the “Station List” button produces a menu showing all stations that are present in the stripchart widget. Clicking any station on the menu results in the stripchart reorganizing the stations such that the clicked station appears first and the others ordered by proximity to the clicked station. The buttons on the monitor widget are not shown by default but can be invoked by left clicking anywhere on the monitor widget graph. In this case the graph widget for the Prickley Bay station (pric) was clicked and now the usual monitor widget buttons have appeared. Clicking on the graph again will make the buttons vanish. The station:sensor indicators are themselves buttons and clicking on them will arrange the order of the stations in the stripchart widget in the same manner as clicking on the “Station List” menu.; the station clicked will go to the top and the other stations rearrange in terms of proximity to that station One limitation of the current implementation of the stripchart widget is that the time axes for the different stations are not identical. However, I am working on that. In many cases, sea-level station s that are part of the same network transmit within two to three minutes of each other, so the time axes are approximately the same anyway. 4. Future Directions Among the new features under consideration for future releases of Tide Tool are : 1. Real Time tide modeling. In some cases, not enough data is available to create a good set of tide harmonic coefficients. In other cases the tide coefficients are no longer adequate or meteorological effects are skewing the de-tiding. In these cases, it is useful to compute tide coefficients on the “fly” using the 48 hours of data held by Tide Tool. 2. Currently the graphs in the stripchart widget are not constrained to have the same time axis. However, I expect to change that in the near future. 3. Use the output of the TTT program (computes tsunami travel times) distributed by ITIC to indicate the tsunami’s ETA on the monitor widgets. 4. Dynamic reconfiguration. Changing station metadata or adding new stations will not require a restart of Tide Tool. 5. Historical LOGFILES Tide Tool now has the ability to examine old logfiles. To run Tide Tool in historical mode, add the argument H to the command you use to invoke the Tide.tcl script. For example: wize.exe Tide.tcl H There is one important caveat to be aware of in running Tide Tool in historical mode. You must to be sure that the metadata used by Tide Tool is consistent with the date of the logfile you wish to examine. Sensors and data units do change through time. Upon starting Tide Tool in historical mode, a simple entry widget will appear: This widget requires three entries, Julian day, Year and SPAN which is the number of days of data you wish to read starting at the Julian day and year entered. After clicking the “DONE” button, this widget disappears and the Tide Tool GUI then appears. After this, everything is basically the same as Tide Tool. Currently the maximum span is 2, or two days worth of data decoded. Author: Dr. Stuart Weinstein Asst Director, Richard H. Hagemeyer Pacific Tsunami Warning Center Please send all questions, bugs, requests etc. to: [email protected] Screenshots of bugs, error messages etc. are extremely helpful. For other related questions or assistance, please contact Dr. Laura Kong, Director, IOC UNESCO/IOC-NOAA International Tsunami Information Centre, [email protected] Acknowledgments S. Weinstein is indebted to several colleagues for their help and ideas in creating and improving Tide Tool. The genesis of Tide Tool was a request from Dr. Laura Kong in late 2005 to develop a quick and “dirty” tool that can be used to decipher GTS sea-level data, display the results and allow basic measurements of amplitude and period to be made from the sea-level record. Tide Tool 1.0 was released in Nov. 2005. The earliest users (and perhaps “victims”) of Tide Tool were the Met. Office in Malaysia and BMG in Indonesia. Tide Tool has proven so capable that it is now part of the operational software suite at PTWC. In Malaysia, Namran Hussein provided valuable assistance in debugging Tide Tool. Dr. Yap Kok Seng, Low Kong Chiew, and Saw Bun Liong also provided suggestions and tested Tide Tool on Windows platforms. Dr. Fauzi (BMG) provided the first detailed set of instructions for obtaining everything needed to get Tide Tool running on LINUX. Indra Gunawan was also very helpful in trouble shooting problems with Tide Tool. Dr. Yohko Igarashi (JMA/ITIC) provided valuable assistance in improving the port of Tide Tool to both LINUX and Windows and developing the scripts/processes used to obtain GTS data from the Web. Dr. Dailin Wang (PTWC) created and maintains the suite of tide coefficients used in detiding and is currently helping me to develop an “on the fly” de-tiding algorithm in Tcl. Dr. Nathan Becker (PTWC) designed and created the station maps and the maps for the Tide Tool clients. Peter Pissierssens (IODE) offered several valuable suggestions during my visit to IODE in 2006. Mark Van Crombrugge (IODE) helped get Tide Tool running on Windows. Alina Nieves of the US NWS in Puerto Rico helped with testing Tide Tool V9. Last but not least, I thank Chip McCreery and the PTWC staff for putting up with my mood swings while working on Tide Tool. Appendix I. Reading Materials: Practical Programming in Tcl and TK by Brent Welch. Prentice Hall. A super book and introduction to Tcl/Tk. You can find it in many bookstores or obtain it from an online source. Effective Tcl/Tk Programming by Harrison and McLennan This covers fundamentals of event driven programming. For those of you who do mostly serial programming in Fortran or C, event driven programming is a bit a of a trip. Tcl and the Tk Toolkit by John Ousterhout Ousterhout invented Tcl/Tk. So I feel obliged to mention his book. Websites: http://www.activestate.com/Products/ActiveTcl/ You can get binaries here. This site has something for everyone. http://tcl.sourceforge.net/ http://sourceforge.net/projects/blt/ You can get binaries here and keep tabs on the latest FAQs, versions, bugs, and advances in the Tcl world. http://phaseit.net/claird/comp.lang.tcl/HowToC.html Howto, on how to integrate the power of C programming with Tcl/Tk. I use combinations like this at PTWC. Cameron is one of the great Tcl/Tk experts and frequently answers Tcl/Tk questions on the comp.lang.tcl Google news group. You may find me there on occasions as well. http://wiki.tcl.tk/199 A starting point for BLT http://pdqi.com/w/pw/pdqi/Wize/Blt A link to WIZE blt. Appendix II. Tide Tool using Internet Data Download The COMP_META file has an entry for each sensor for each station. Each entry has 18 parameters, most of which are used by Tide Tool in decoding the GTS sea-level messages. From left to right: Station Code : 4 letter code Geographic Name: City or geographic area where station is situated or nearest. Platform ID Number: All stations have a unique ID. WMO header: All products transmitted over the GTS have a WMO header. Different producst can use the same WMO header. WMO header indicates type of product an region. Sensor Type: Type of instrument. Sample Rate: Time interval between sea level measurements. Number of samples for sensor: Number of samples in the data payload for that sensor Observation units: F for .01ft and M for mm, Skip: A number that indicates the number of non-data fields in the data payload Time Ordering: 1 for chronological and -1 for reverse chronological order, Scale Factor: A correction applied when the sensor does not record the proper tide range. Transmission Time Interval: Elapsed time between transmissions for that station. Time (hour:minute): Time of first transmission of the day Latitude, Longitude: Geographic coordinates. Availability of tide coefficients for tide prediction: 1 for available, 0 for unavailable. Station maintainer: Code for station owner. GLOSS ID: Added at the request of GLOSS. Parser: Name of function to be used to decode messages for the station. The last column was added with Tide Tool v9.0 and is used by the Tide.tcl script to determine which decoding function to use. An example is given below for the Benoa sealevel station pressure sensor. beno Benoa_ID 22856700 SXXX32 prs 1 30 M 3 -1 1.00 015 0007 -8.7500 115.2166 1 UHSLC 049 PARSE_GLOSS In this case the entry in the last column is PARSE_GLOSS which is the Tcl function that will be called to decode messages from Benoa. Appendix III. Tide Tool using Internet Data Download Windows XP, Vista, and 2007 Developed and maintained by the Pacific Tsunami Warning Center Windows internet version by International Tsunami Information Center Distributed by International Tsunami Information Center For more information, contact Stuart Weinstein ([email protected]) Laura Kong ([email protected]) Version June 2010, July 2012 Tide Tool is an operational tool developed and supported by the Pacific Tsunami Warning Center for the decode, display, and manipulation of sea level data transmitted over the WMO Global Telecommunications System (GTS). The tool continuously decodes sea level in real-time and displays the time series on a computer screen; users are able to interactively manipulate the time series to measure wave amplitude and period, and to remove the tidal signal. A separate process archives GTS-downloaded data continuously through a dedicated line (recommended), or alternatively by commercial internet ftp (not recommended for operations requiring 100% reliability). An offline tool (getTide) is available for archived data. Archived data can also be viewed (see Section 5 of User Manual). The following are instructions for the installation and running of Tide Tool on a PC under a Windows XP or Vista operating system and with data collection through internet through “wget” Instructions below refer to the generic names of scripts; in general, each script will also include its version number as part of its file name (e.g., Tide_v9.20.tcl, Pacific_Client_v2.0.tcl, etc) Instruction for Tide Tool (Windows version) 1. If you already have an old version of Tide Tool, delete the files. You may use C:\Tcl\uninst_TideTool.exe to delete all the files Alternatively, if you already have the wize.exe (TclTk V8.5.9) and BLT (2.5), chikan.exe, etc loaded, you may instead just replace the old files with the new files, or add the new files to the correct directory; most often, the updates are to Tide.tcl, map client scripts, COMP_META, or to the TideTool_MetaData files, or are the addition of new Tide_Coeffs or MAPS files. In this case, you should stop get_data.tcl and Tide.tcl, and then restart each again (skip to Step 6 in this instruction). 2. Download the latest TideTool_version_install.zip. When unzipped, the directory has the files: SLdecode_display_summary7.pdf (general summary) Tide Tool 9.0 Manual Vxx.doc (User manual – these install instructions are in Appendix II) PC_install_dirinfo.txt (contains directory structure specific for this installation) TideTool_Quickinfo.doc (quick info / cheat sheet for running software) Setup.exe (installs software) 3. Run Setup.exe to place files in the correct directories and create desktop shortcuts. Setup.exe will: copy all files in C folder to C:\ create Shortcut for WIZE (which runs Bltwish) on desktop and names it: WIZE create Shortcut on desktop to go to C:Tcl\bin and names it TideTool_bin create Shortcut on desktop to go to C:Tcl\TideTool and names it TideTool_data create C:Tcl\uninst_TideTool.exe (Uninstall program) in case there is a need to uninstall this package. Unist.exe will delete all installed files except the collected data files in the folder SR_LOG (srJJJYY.log), Decoded_Data (decoded station data by Julian Day), and any other files you have created since the last installation Setup.exe in TideTool_v9.20_install.zip places the following files / folders under C:\ FILE/Folder NAME ---------------------------------------------Tcl <Folder> --> bin <Folder> --> doc <Folder> include <Folder> lib <Folder> licenses <Folder> INSTALL.LOG license-at8.4-thread.terms MANIFEST_at8.4.txt README-8.4-thread.txt uninst.exe TideTool <Folder> --> (station_name).tide.coeff Tide_vXX.tcl(V9.20) get_data.tcl wget.exe chikan.exe Pacific/Indian/Caribbean/Atlantic_Client_vXX.tcl pacific/indian/caribbean/atlantic_map.gif Tile_List (stations to display at start up) wize.exe (TclTK & BLT files) MetaData <Folder>---> COMP_META and TideTool_MetaData region files (may be outdated) BOX <Folder>---> Decoded_Data <Folder>---> Error MAPS PLOTS SR_LOG <Folder>---> <Folder>---> <Folder>---> <Folder>---> Tide_Coeffs <Folder>---> data downloaded from ftp site decoded data by stations Error_LOG file maps for stations time series plots srJJJYY.log files of GTS transmissions Atlantic_SL_Stations_2012.pdf (station maps) Indian_SL_Stations_2012.pdf Pacific_SL_Stations_2012.pdf PC_install_dirinfo_may12.txt PTWC Operations Manual V1.3.5.doc README.txt SLdecode_display_summary7_may12.pdf Tide Tool 9.2 Manual V2.0.doc TideTool_QuickInfo.doc - WIZE (wise.exe) includes TclTk (V8.5.9) and BLT (v2.5) - wget.exe is used to download data files (e.g., files from NWS telecommunications gateway) - chikan.exe is used to convert from Unix (\n) to MS-DOS (\r\n). 4. Set your PC to use UTC (GMT, Greenwich Mean Time). 5. Customize Tide.tcl and map client scripts to specify directories where files to be found or created, and which files are to be used. For this Windows package, the customization has already been done using the information in PC_install_dirinfo.txt. Some variables that you may want to additionally change are: a. ‘metadata_filename’ variable, if you want only a subset of the data to be decoded and displayed. Pre-selected files available are: COMP_META (default) will decode all stations and list in alphabetical order COMP_META_region will decode all stations and list by region TideTool_MetaData_IO is for Indian Ocean TideTool_MetaData_NEPO is for Northeast Pacific Ocean TideTool_MetaData_NWPO is for Northwest Pacific Ocean TideTool_MetaData_SEPO is for Southeast Pacific Ocean TideTool_MetaData_SWPO is for Southwest Pacific Ocean TideTool_MetaData_NWAO_CAR is for Northwest Atlantic Ocean, Caribbean, Gulf of Mexico TideTool_MetaData_PO_IO_NWAO is for Pacific Ocean, Indian Ocean, and Northwest Atlantic Ocean, Caribbean, Gulf of Mexico TideTool_MetaData is to specify user-selected stations to decode/display or getTide.tcl. b. ‘tilelistfile’, which specifies which sea level station monitors to bring up at Tide.tcl startup. It is suggested to leave this file blank unless you would like a pre-set set of stations displayed at startup. An example Tile_List is provided. You can set it not to bring up any monitors at startup by leaving this file unspecified. For example, if you need to monitor the 3 stations “yapi”, “mani” and “davo” for prs sensor, then Tile_List would look like yapi prs mani prs davo prs After Tide.tcl is running, you can edit the file Tile_List to designate other stations, and then hit the button “RETILE” to show these station monitors. c. ‘printer_command’ or ‘plot_pri_com’, which specifies the command for printing. Presently, the default is set for a linux/unix command or defaulted to no printing. 6. Start get_data.tcl (drop icon onto WIZE icon) This short cut has already been created by the Package to provide an easy way to start get_data.tcl without having to open a console to type the command. This is to simply drop the script onto the WIZE icon, e.g., to run get_data.tcl, highlight the tcl script and move/drop it onto the WIZE icon to start the script. get_data.tcl runs wget.exe twice, first to obtain the filename of the most current data file and second to download that data file. The downloaded data file is then concatenated to the existing srxxx.log file of transmissions, which is used by Tide.tcl. 7. Start Tide.tcl (drop icon onto WIZE icon) This short cut has already been created by the Package to provide an easy way to start Tide.tcl and the Map clients without having to open a console to type the command. This is to simply drop the script onto a WIZE icon, e.g., to run Tide.tcl and the map clients, highlight the tcl script and move/drop it onto the WIZE icon to start the script. Tide.tcl reads and decodes the existing data in the current day’s SRLOG file (srxxxxx.log), and then reads Tile_List and automatically displays small same-sized windows for each station data. Note that at the beginning, when srJJJYY.log is small and/or little station data are obtained, only a small number of small windows will be displayed. If you rerun the Tide.tcl later on the first day of your usage, it will display more station data since srJJJYY.log is larger. 8. Start map clients (drop each map client icon onto the WIZE icon) Each client opens a map of a different ocean showing the stations (Pacific_Client.tcl, Indian_Client.tcl, Caribbean_Client.tcl, Atlantic_Client.tcl). More than 1 map client can be run at the same time. Note that Tide.tcl must always be running since the maps are only clients of Tide.tcl. You may also start Tide.tcl and the map clients manually by: a. Double click on the C:\Tcl\bin\wize.exe to display console for each script. b. In the console window, type (example is for Indian Ocean) % wize Tide.tcl & c. In the console window, type (example is for Pacific Ocean map) % bltwish Pacific_Client.tcl & Important Notes: get_data.tcl must always be running in order to collect the sea level data. This means your computer must always be on and logged in. If not, data gaps will display for the times when data are not collected! Tide.tcl time series plots are output as postscript files. To view and/or print, you may need additional software, such as Adobe Acrobat, Distiller (to create a .pdf file), ghostscript (to convert .ps to other formats such as .jpg, .gif, or .png files), or other conversion software Examining Historical Data Tide Tool has the ability to examine old logfiles. In historical mode, you must to be sure that the metadata used is consistent with the date of the logfile you wish to examine (e.g., you may have to edit in the correct metatdata filename in Tide.tcl before running). Sensors and data units do change through time. To run, the argument H must be added to the command Tide.tcl. To run, double click on C:\Tcl\bin\wize.exe, then type % wize Tide.tcl H The widget requires three entries: Julian day, Year and SPAN (number of days of data you wish to read starting at the Julian day and year entered); the maximum SPAN is 2, or two days worth of data decoded. For more information, see Section 5 of Tide Tool Manual. Appendix IV. Tide Tool using Internet Data Download Linux / Unix Developed and maintained by the Pacific Tsunami Warning Center Distributed by International Tsunami Information Center For more information, contact Stuart Weinstein ([email protected]) or Laura Kong ([email protected]) Version March 2009 (NOTE – this description has not yet been updated nor checked for consistency with V9.x) Tide Tool is an operational tool developed and supported by the Pacific Tsunami Warning Center for the decode, display, and manipulation of sea level data transmitted over the WMO Global Telecommunications System (GTS). The tool continuously decodes sea level in real-time and displays the time series on a computer screen; users are able to interactively manipulate the time series to measure wave amplitude and period, and to remove the tidal signal. Non-operational versions also exist for data transmissions through the internet (wget) and for archived data. Instructions for the installation and running of Tide Tool on a PC under a Linux operating system and with data collection through the internet ftp are provided below. Instruction for Tide Tool (Linux version) 1. Put Tide_Tool.tar.gz on the Desktop and extract the files; > gunzip Tide_Tool.tar.gz > tar xvf Tide_Tool.tar Check if - directory named “Tide_Tool” is created on the Desktop - directories named “Decoded_Data”, “MAPS”, “past_metadata”, “SR_LOG”, “Tide_Coeffs” and “V9.0” are under “Tide_Tool” - files named “Tide Tool 9.2 Manual V2.0.doc” and “SLmap-AO/IO/PO.jpg” are under “Tide_Tool” Create a directory named “BOX” on the Desktop. 2. Check if the following files are in “V9.0”; -- COMP_META -- TideTool_MetaData, TideTool_MetaData_IO/PO/NEPO/NWPO/SEPO/SWPO/NWAO_CAR -- URL_FILE -- Tile_List (sample) -- Tide.tcl ………………… script to monitor the sea level data (near real-time) -- get_data.tcl …………….. script to continuously download sea level from NWS gateway -- getTide.tcl ………………script to show the past sea level data -- Atlantic_Client, Pacific_Client.tcl, Indian_Client.tcl, Caribbean_Client.tcl …… scripts to display a map -- atlantic_map.gif, pacific_ocean_map.gif, indian_ocean_map.gif, caribbean_map.gif…..maps for each ocean 3. Install TclTk WIZE and set the path. Download WIZE http://sourceforge.net/projects/wize/files/ for TclTk WIZE. Note that WIZE was compiled on Ubuntu LINUX. This executable will not work with RHEL5, but may work with RHEL6. However, if it doesn’t work you can compile form source. I have successfully built WIZE from source on RHEL5. You may need to install a number of *_devel packages. On my RHEL5 system I needed to install (yum install) the following: libxml2-devel libX11-devel freetype-devel fontconfig-devel libXft-devel libXext-devel libXscrnSaver-devel After I had all of those libraries installed, compiling proceeded without issues. I installed wize in /usr/bin and the libraries in /usr/lib. . How to set the path (commands, filenames, file locations, etc.) depends on your machine. Here is an example; > whereis wize ….Find the location of wzie > vi .bash_profie……Open the setting file to edit. File name might be different if yours is not using bash but tcsh and so on. With the command “ls –al”, you can search which file is for the setting. Add the path for wize in the setting file. For example, add the following lines; PATH=$PATH:/usr/local/bin Export PATH There should be a "lib" (/usr/lib in my case) directory where the Tcl/Tk libraries (libtcl8.4.s0, libtk8.4.s0 e.g.) live. This is where the BWidget package needs to be dropped. The BWidget package can be obtained here: ftp://ilikai.soest.hawaii.edu/ptwc/Tide_Toolv9/bwidget-1.9.4.tar Untar this file and drop in the lib directory described above. 4. Edit Tide.tcl to specify different filenames or directory paths than currently specific. Some variables that you may want to change are: a. ‘metadata_filename’ variable, if you may want only a subset of the data to be decoded and displayed, Some files available are: COMP_META (default) will decode all stations TideTool_MetaData_IO is for Indian Ocean TideTool_MetaData_NEPO is for Northeast Pacific Ocean TideTool_MetaData_NWPO is for Northwest Pacific Ocean TideTool_MetaData_SEPO is for Southeast Pacific Ocean TideTool_MetaData_SWPO is for Southwest Pacific Ocean TideTool_MetaData_NWAO_CAR is for Northwest Atlantic Ocean, Caribbean, Gulf of Mexico TideTool_MetaData to select user-selected stations b. ‘tilelistfile’, which specifies which sea level station monitors to bring up on Tide.tcl startup. An example Tile_List is provided. Presently, the default is not to bring up any monitors at startup. For example, if you need to monitor the 3 stations “yapi”, “mani” and “davo” for prs sensor, then Tile_List would look like yapi prs mani prs davo prs c. ‘printer_command’, which specifies the command for printing. Presently, the default is set for a linux/unix command. 5. Set your machine to use UTC Tide.tcl works following UTC so set your machine to use UTC, or your machine will not create a new srJJJYY.log when the UTC date changed and shows errors. 7. Run the scripts Type as follows under Desktop/Tide_Tool/V9.0, and get_data.tcl starts. > /usr/bin/wize ./get_data.tcl & (if you’ve set the path, just type ./get_data.tcl &) Wait until the 1st file is successfully downloaded and then start the decoding / displaying Type as follows under Desktop/Tide_Tool/V9.0, and Tide.tcl starts. > /usr/bin/wize ./Tide.tcl & (if you’ve set the path, just type ./Tide.tcl &) When you need a map of Pacific Ocean, type > /usr/bin/wize ./Pacific_Client.tcl & You can add more maps if you need, just by adding lines in the same way. Tide.tcl reads srJJJYY.log, which get_data.tcl creates. Tide.tcl reads Tile_List and automatically displays small data windows for each station Note that at the beginning, srJJJYY.log is small and not all the station data are obtained, so only a limited number of small windows will be displayed. If you rerun the Tide.tcl later on the first day of your usage, it will display more stations since srJJJYY.log is larger. Then, you can keep those windows forever and need not rerun again. Desktop Tide_Tool BOX Directory Structure V9.0 Tide.tcl Atlantic/ Pacific/Indian/Caribbean_Client.tcl Atlantic/Pacific/Indian/Caribbean_map.gif get_data.tcl wget URL_FILE TideTool_MetaData TideTool_MetaData_IO/PO/NEPP/NWPO/SEPO/SWPO/NWAO_CAR COMP_META Tile_List Error_LOG (to be created) Error_LOG_past (to be created) Tide_Coeffs -- coefficient files for the sea level stations Decoded_Data -- decoded data are archived in this directory SR_LOG -- srJJJYY.log files are archived in this directory MAPS -- maps for each station past_metadata -- past COMP_META & TideTool_MetaData Tide Tool 9.0 Manual.doc SLmap_AO/IO/PO.jpg Tide_Tool_LOG (to be created) Tile_Tool_LOG_past (to be created) APPENDIX V SEA-LEVEL GAUGE INSTRUMENTATION Extracted from PTWC OPERATIONS, SYSTEMS AND PROCEDURES MANUAL, Edition 1.0, December 2008 CHAPTER 6. SEA-LEVEL DATA PROCESSING C. SEA-LEVEL GAUGE INSTRUMENTATION a. Coastal Gauges The sea-level networks of the world’s oceans utilize a combination of NOAA/GOES, JMA/GMS or EUMETSAT satellite transmission communications. These data arrive at PTWC via the NESDIS/NWS communications routing through the NWSTG onto line 58. The sea-level data is collected and transmitted from the sea-level station using a Data Collection Platform, (DCP) that are procured from various manufacturers. The DCPs provide a suite of programmable parameters for data (water-level) monitoring and data transmission via satellite. Other meteorological sensors can also be utilized in conjunction with these systems. The water-level data is sampled at a 2 second rate averaged over a 2 minute period and transmitted via GOES or GMS on an hourly basis to PTWC. However, NOS (US NOAA National Ocean Service) is upgrading sea-level stations to transmit 6 one-minute samples every 6 minutes. Already a number of NOS stations in Hawaii and Alaska region have been upgraded to the higher transmission rate. Supported by the IOC with funds from NOAA, the UHSLC is upgrading the GLOSS stations in the Indian Ocean. The upgraded gauges in the Indian Ocean transmit every 12 or 15 minutes, with 12 to 30 one-minute samples for the sensors with the highest sampling rate. Each sea level site may use one or more of 6 types of sensors: SPS – (Submersible Pressure Sensor) measures water-level sea pressure from 0 – 45 feet. Backup pressure sensor code is SPB. PR1,PR2 – Pressure sensors. BUB - (Bubbler Pressure Sensor) measures water-level sea pressure, from 0 – 45 feet (utilizing a nitrogen gas purging system) in a cavity submerged in the water. As sea-level changes, the pressure in the nitrogen gas cavity changes. Backup bubbler code is BBB. ENC – (Incremental Encoder Sensor) measures water changes developed in a stilling well system, incrementally turning a pulley using a float and weight. As sea-level changes a float moves up and down. The operation is similar to the float in your toilet. Backup encoder code is ENB. PAQ – (Primary Aquatrak) measures sea-level with acoustics. The transmitter and receiver are above the water. Sea-level is determined by the round trip time for the acoustic signal. Backup aquatrak code is BAQ. PAQ designation is used for NTF gauges. PWL – This is the designation for NOS aquatraks. BWL is the backup NOS sea-level gauge designation, usually a Paros pressure sensor. RAD – (Radar) measures sea-level using radar. The RAD sensor is placed above the sea-level and bounces radar signals off the sea-surface. Timing the round trip time yields the sea-level. The sea-level stations systems are generally located in ports or bay areas in secure areas with facilities. However, they can be located in remote locations on most any shoreline where there is a suitable area for anchoring the sensor and the Electronic Systems are safe from the elements. The photos below (courtesy Richard Nygard) show the basic elements of the Installation at Hiva Oa, Marquesas. The Hiva Oa station primary sensor is a pressure sensor (SPS) while the secondary gauge is an encoder (ENB). Hiva Oa Installation Hiva Oa Stilling Well Vaisala DCP, wiring, 12v battery, and solar regulator. b. DART Buoys The DART buoy concept is illustrated here: The DART sensor is a pressure sensor that sits on the sea floor in very deep water and measures sea-level fluctuations averaged over 15 sec to a precision of 1 mm. The data is relayed by acoustic telemetry to the buoy and is then transmitted to satellite. The data is transported to PTWC via line 58. Why DART buoys? The Achilles heel of the warning system is the unnecessary evacuations. An evacuation of the State of Hawaii will easily cost the State tens of millions of dollars in lost business revenue and the costs associated with executing emergency procedures. Frequent unnecessary evacuations will undermine public confidence in the warning system. If people stop paying attention to the warning system, then we have failed the public. Why do we have unnecessary evacuations? Because forecasting how large a tsunami generated on the Pacific Rim will be when it arrives on distant shores is still very much in its nascent stages. Coastal tide gauges provide an imperfect guide as to how destructive a tsunami will be as it propagates away from the source. This is because the near shore bathymetry and geometry of the harbor where the tide gauge is situated have as much effect on the wave-height and inundation as the fundamental characteristics of the tsunami itself. Along the same coast, it is not unusual to find harbors that resonate strongly with tsunami and those which show much less tsunami activity. Therefore the picture given by coastal tide gauges is somewhat murky; and forecasts with respect to damage on distant coasts fraught with peril. What was needed was a way to distinguish between tsunamis that will cross oceans with destructive power and tsunamis that may produce measurable, but non-damaging waves on distant coasts. By measuring the properties of a tsunami far from the influences of near-shore bathymetry and geometry, the DART buoys give us a look at the tsunami in deep water unfettered by resonant effects. Furthermore, while modeling tsunami propagation in the near shore environment is difficult, modeling tsunamis as they make their way into deep water, is a much simpler problem and can be simulated with more robustness. Therefore both Paul Whitmore of the ATWC (EARTHVU) and Vasily Titov of PMEL (SIFT) have produced a tsunami wave-height forecast database of pre-computed tsunami scenarios. These models will make predictions based on basic seismic data as to what size tsunami should be recorded by the DART and coastal buoys. By comparing the predicted results to the observed, the watchstander should be able to gauge whether or not the tsunami will be destructive when it arrives on distant shores. 7. TSUNAMI TRAVEL-TIME AND WAVE-HEIGHT FORECASTING Whenever a Watch/Warning message is issued, the watchstander needs to run software to compute the travel times to the various warning points supplied by our clients. This information is then relayed to our clients in our message products. As mentioned earlier, travel-time calculations are relatively simple calculations; they can be done quickly in real-time. However, even this calculation can be speeded up by compiling a database of precomputed scenarios. So we have two approaches for computing tsunami travel-times. The approach to be used during an event is to use the travel-time database because it is faster. However, this approach (eta.tcl) does not produce any graphical products. After bulletins are sent the watchstanders can work with travel-time tool (tttool) to produce a travel-time map. tttool will also compute travel-times, and can be used as a backup to eta.tcl. Among the most challenging numerical simulation problems is that of the tsunami. It isn’t the fluid that’s difficult; it’s the boundary conditions that are a pain. In order to model wave-heights, the details of near shore bathymetry and coastline must be taken into account. This requires very fine numerical resolution. Yet, applying such resolution to the whole of an ocean basin would require vast computational resources. Therefore such models involve multiple numerical grids on many scales. Wave-height forecasting is still in its nascent stages although we can see the light at the end of the tunnel. Coupled with a network of DART gauges, these current models should enable the watchstander to distinguish between destructive and non-destructive tele-tsunamis. Two tools that are currently being used are SIFT (still being developed and tested) and EARTHVU (WC/ATWC)