1
LME Reference — base graphics
379
Grids
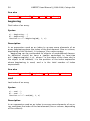
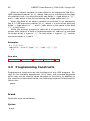
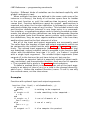
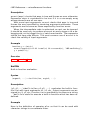
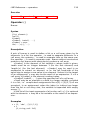
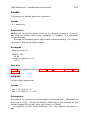
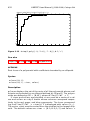
In addition to the scale ticks displayed along the bounding frame, grids
can be added to give visual clues and make easier the interpretation
of graphics. X and Y grids are vertical or horizontal lines displayed in
the figure background. They can be switched on and off by the user
in the Grid menu, or switched on by programs with the plotoption
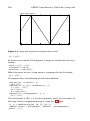
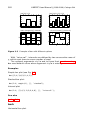
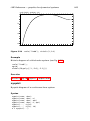
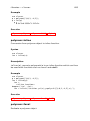
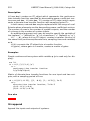
command (they are set off by default). In the example below, both X
and Y grids are switched on:
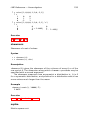
plotoption xgrid
plotoption ygrid
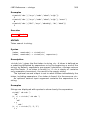
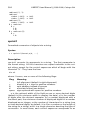
plot(rand(1,10));
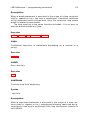
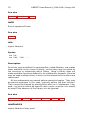
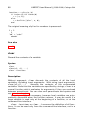
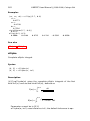
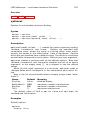
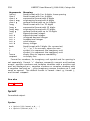
Commands which display grids for special kind of graphics are also
available:
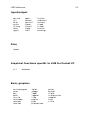
Command
hgrid
ngrid
sgrid
zgrid
Intended use
nyquist, dnyquist
nichols, dnichols
plotroots, rlocus (continuous-time)
plotroots, rlocus (discrete-time)
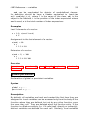
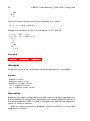
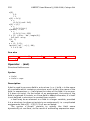
They can be used without argument, to let the user choose the
level of details: none means the command does not produce any output; basic is the default value and gives a simple, non-obstructive hint
(a single line or a circle); and full gives more details. To change by
program the default level of details (basic), plotoption is used. In
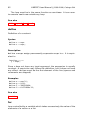
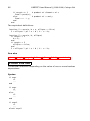
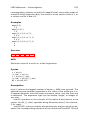
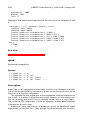
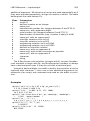
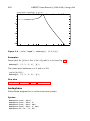
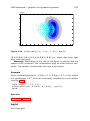
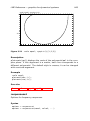
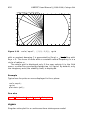
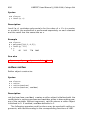
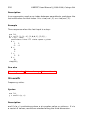
the example below, the grid for the complex plane of the z transform
is displayed with full details. Once the figure is displayed, the user is
free to reduce the level of details with the Grid menu.
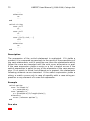
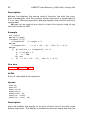
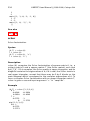
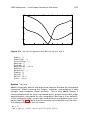
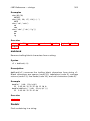
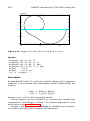
scale(’equal’, [-2,2,-2,2]);
zgrid;
plotoption fullgrid;
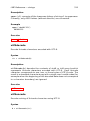
plotroots([1,-1.5,0.8]);
3.34
Base Graphical Functions
activeregion
Region associated with an ID.
Syntax
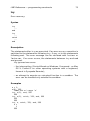
activeregion(xmin, xmax, ymin, ymax, id)
activeregion(X, Y, id)