1
Application Note:QCI-AN031
QuickSilver Controls, Inc.
Make IMS Segments
The Make IMS Segments.xls spreadsheet example uses time data in π/25 increments (column
B). For a more precise approximation, use smaller fractions of π for the time interval; this will
also require more data points. Position is a cosine function of time (column A) and that is why
time increments were chosen as a fraction of π. Increase the fraction to π/50 to yield a much
better approximation.
The encoder constant (D2) only applies to scaled position data (position in counts columns
G&H) and the final position column for the IMS segment (column N).
Columns F-K use the finite difference between time and position to generate velocity (dx/dt)
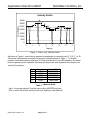
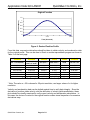
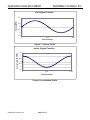
and acceleration (d2x/dt2) data. Columns J & K are plotted against time for the velocity and
acceleration plots respectively. A COS function for position was chosen because successive
derivates (velocity and acceleration) are easily identified: vel= -SIN and acc= -COS (see the
first three plots).
Note that the start and end points of actual velocity (dx/dt) and acceleration (d2x/dt2) are hilighted in red. This is to indicate that the endpoints of dx/dt can cause a spike in d2x/dt2 and in
some instances needs to be inputted manually rather then calculated by the spreadsheet. It
was noticed that adjustments to these endpoints were needed to realize a more precise move
(final position ±1 count around 0). If the actual acceleration plot was let to begin and end on –
1 (as it should), the final position was short 30 counts or so.
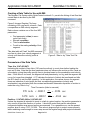
Once the position function and it's successive derivatives are confirmed graphically, compute
the actual IMS data segments (cols M-P). Click on a cell in columns M-P to see the constants
used to scale actual position, velocity, and acceleration data into Native SilverLode Units
based on the register range for each parameter used by IMS.
A slight gain (10% or lower) is added to the acceleration and velocity data. These gains need
to be equal or else the ending position of the profile is negatively affected. The gains are used
to increase the peak position of the COS curve. With the original calculated values, the actual
position curve falls short of the peak value.
Important Notes
Interpolated time is in SilverLode servo clock ticks: dt/120usec and is rounded down to the
nearest integer. It was noted that this, along with rounding interpolated velocity and
acceleration up, yields precise moves (most of the time stopping exactly on 0 and oscillating
±1 count).
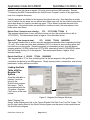
Interpolated position is NOT the position each segment is commanded to; it is only used to
project the move in a direction. IMS position is defined to be: current position +1073741824 if
actual velocity is in the positive direction or -1073741824 if actual velocity is in the negative
direction. See the Interpolated position graph and the "IF" statement in the cell formatting.
Interpolated velocity and acceleration are scaled absolute values; they do not need a sign
because the position parameter will be projecting the direction of the segment. See the
Interpolated plots and cell formatting for constants used.
QuickSilver Controls, Inc.
Page 11 of 11