1
8.
9.
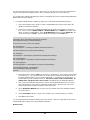
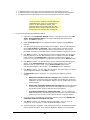
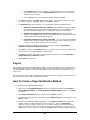
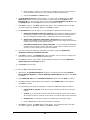
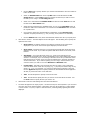
Click Next to continue. The Schedule dialog box will appear.
§
On the Scheduled Interval tab, set the frequency at which you want to execute
the Alarm. Leaving the interval at the default of 1 second will enable you to
monitor the performance counter or object in real-time.
§
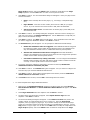
On the Scheduled Hours tab, configure the hours and days you want this
monitor active.
Click Finish to save the Performance Alarm.
Performance Collector
Performance Collectors are sets of one or more performance objects, counters and/or instances that are
grouped together for collection and aggregation. ELM Performance Manager and ELM Performance
Manager come pre-populated with a variety of Performance Collectors. You can edit any of these or
create your own custom Performance Collectors. Each Performance Collector is comprised of three parts:
the counters being collected; the frequency of the collection (e.g., every 30 minutes, every hour, etc.);
and the days on which collection occurs.
ELM comes pre-populated with a variety of Performance Objects and Counters. If the object, counter or
instance you want to collect or monitor is not listed, you can very easily add it from a Windows NT,
Windows 2000, Windows XP or Windows 2003 computer that publishes the counter.
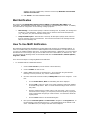
How To Use Performance Collectors
Performance Collectors are used to collect and store performance data from Windows NT, Windows 2000,
Windows XP and Windows 2003. A Performance Collector is a group of performance counters that are
collected at the same time. You can use multiple Performance Collectors that contain different groups of
counters, or a single Performance Collector that contains all of the counters you want to collect.
»
To use Performance Collector:
1.
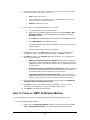
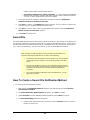
Right-click on the Monitor Items container in the ELM Console and select All Tasks |
New Monitor Item. The Create Monitor Wizard will appear. Click Next to continue.
2.
Select Performance Collector from the Monitor Type dropdown and click Next to
continue.
3.
Enter a Name and Description and click Next to continue.
4.
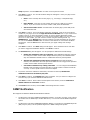
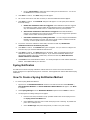
The Performance Counter dialog box will appear. The initial view of this field will be a
list of defined Performance Object. If the object you want to monitor is not listed, you
can add additional objects and counters by following these instructions. Expand each
object containing counters you want to monitor and put a check in the box for each
Performance Counter you want to collect.
5.
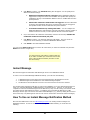
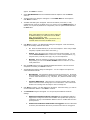
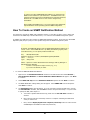
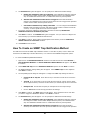
Click Next to continue. The Summary dialog box will appear. Use this dialog box to
aggregate (e.g., average) the collected data. Aggregating data is a great way to
manage the size of the database used to store the collected performance data. An
aggregated database will contain detailed data for the most recent collection period and
summary data for historical periods. Data can be aggregated every week, once a month
or once a quarter, or you can turn it off completely.
a.
Use the On field to select the day on which aggregation will take place.
b.
Use the At field to specify the time.
Note
17