1
uWATER:
Ubiquitous WebGIS Analysis Toolkit for Extensive Resources
Version 1.1
User’s Manual
Yi-Chen E. Yang
Yu-Feng F. Lin
Miscellaneous Publication 192
Illinois State Water Survey
Institute of Natural Resource Sustainability
University of Illinois at Urbana-Champaign
November 1, 2010
Illinois Non-Exclusive Research Use License
http://www.isws.illinois.edu/gws/sware/agreement.asp?pkg=uwsw&sp=pg1
uWATER 1.1
1. Introduction
uWATER is a tool developed for non-technically minded citizens and decision-makers to access
scientific modeling results and spatial datasets through an interactive online Geographic Information
System (WebGIS). This tool permits convenient access to computer model results that quantify the
impacts of water resource development and climate change within a study area and facilitates use of
these data for water management policy formulation. The objective of uWATER is to bridge the gap
between scientific research results and general public understanding.
Because GIS software allows spatial and tabular display and processing of data, it provides unparalleled
opportunities for assessment and improved management of natural resources. ArcGIS Desktop,
developed by the Environmental Systems Research Institute (ESRI), is currently one of the most
popular commercial GIS software packages in the field. ArcGIS Explorer (AGX), ESRI’s free web-based
GIS tool, can display a variety of GIS data. However, many of the analytical capabilities of ArcGIS
Desktop, including spatial and attribute queries, are not available in AGX. uWATER is an AGX plug-in
program that adds GIS calculation and query functions to the functions native to AGX, thus providing
for a range of applications in environmental resources management.
2. System Requirements
uWATER was developed using AGX SDK with Microsoft Visual Basic 2008. It was designed to work in
the environment of AGX (Build 1500 or later). Hardware and software requirements include:
Microsoft Windows XP Service Pack 2 or later version (32 bit, 64 bit)
Microsoft .NET Framework 3.5 or later version
Free download at: http://www.microsoft.com/downloads/details.aspx?FamilyId=5b2c0358915b-4eb5-9b1d-10e506da9d0f&displaylang=en
Microsoft XML Core Services (MSXML) 4.0 Service Pack 2 or later version
Free download at: http://msdn.microsoft.com/en-us/data/bb190600.aspx
Internet Explorer 7.0 or later version
Free download at: http://www.microsoft.com/windows/internet-explorer/default.aspx
ArcGIS Explorer (Build 1500 or later)
Free download at: http://www.esri.com/software/arcgis/explorer/download.html
Hardware
CPU Speed: 2.2 GHz or higher recommended
Processor: Intel Core Duo, Pentium 4, Xeon Processors or later
1
uWATER 1.1
Memory/RAM: 1 GB minimum, 2 GB or higher recommended
Display Properties: 24 bit color depth
Screen Resolution: 1024 x 768 or higher recommended at normal size (96dpi); the best
resolution is 1680 x 1050
Swap Space: Determined by the operating system, 500 MB minimum
Disk Space: 300 MB or more
Bandwidth Connection Speed: Minimum 380 Kbps, 1500 Kbps, or higher recommended
Video/Graphics: 24-bit capable graphics accelerator, video card OpenGL 2.0 or higher compliant,
video memory 256 MB or higher
3. Installation of uWATER
Installation of uWATER is simplified because it does not require
a conventional executable file (e.g., .exe or .dll) on the
destination computer. Instead, uWATER uses an AGX
Application Configuration file (.ncfg) that installs automatically
on any computer on which AGX is properly installed. To begin
installing uWATER, one must download the .ncfg file (Figure 1)
from the program Web page:
http://www.isws.illinois.edu/gws/sware/uwater/
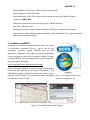
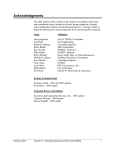
Double-clicking the uWATER1.1.ncfg icon opens AGX and adds a
customized tab, uWATER, to the default AGX interface. The
uWATER tab includes a single control button that, when clicked,
launches uWATER (Figure 2), the interface of which is designed
as a dockable window in AGX.
Figure 1. The uWATER ArcGIS Explorer
Application Configuration file
Figure 2. The uWATER tab in ArcGIS Explorer
2
uWATER 1.1
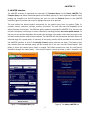
4. uWATER Interface
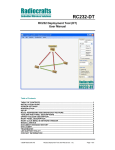
The uWATER interface is organized into two tabs: (1) Complex Query and (2) About uWATER. The
Complex Query tab allows combined spatial and attribute queries of a user-imported shapefile. After
loading the shapefile into ArcGIS Explorer, the user can click the Refresh button in the uWATER
interface (Figure 3) and use the curser to highlight the layer to be queried.
The user selects the desired spatial relationship for the spatial query from six options (Table 1):
contains, crosses, intersects, overlaps, touches, and within. The user then uses the dropdown list to
select the query criteria layer. Two different query options are provided by uWATER. First, the user can
use the entire query criteria layer to select a feature by checking the box: use entire spatial domain. Or
the user can use another dropdown list to select the attribute in the query criteria layer and type in the
minimum and maximum value of that attribute. The uWATER will use the selected attribute within the
selected range for a spatial query. A summary of the query process will be provided at the bottom of
the uWATER interface. A click of the Identify Features button executes the query. The feature layer
that resulted from the attribute query will be created first if the user uses the second option. One
folder of notes (the spatial query notes) is created. This folder contains one note for each feature
identified through the spatial query. Since ArcGIS Explorer cannot generate or edit a shapefile, the
Figure 4. The About uWATER tab
Figure 3. The Complex Query tab
3
uWATER 1.1
spatial query results of uWATER are stored as notes and grouped in folders. By default, the names
assigned to these notes begin with the string SQNote.
The About uWATER tab indicates the software version number and the developers’ contact
information (Figure 4). uWATER was developed under the Illinois Non-Exclusive Research License
Agreement. Since the program is still under development, comments and questions are appreciated.
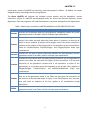
Table 1. Spatial query methods in uWATER (Modified from ESRI AGX-SDK HELP file)
Methods
Description
Searches for occurrences when the input geometry completely contains any of the
Contains
geometries stored in the table. Valid for all shape type combinations.
Searches for occurrences when the input geometry intersects any of the geometries
stored in the table, but only when they share points in common, at least one of
which is not an endpoint. A polyline and a polygon cross if they share a polyline in
Crosses
common on the interior of the polygon that is not equivalent to the entire polyline.
Valid for Polyline/Polyline, Polyline/Polygon, and Polygon/Polyline shape type
combinations.
Searches for any type of spatial relationship between the input geometry and the
Intersects
geometries stored in the table. Valid for all shape type combinations.
Searches for occurrences when the input geometry intersects any of the geometries
stored in the table, but also when the region of their intersection is of the same
dimension as the geometries involved and is not equivalent to either of the
Overlaps
geometries (i.e., the shapes cannot be completely on top of each other). Applies to
Polygon/Polygon, Polyline/Polyline, and MultiPoint/MultiPoint shape type
combinations.
Searches for occurrences when the input geometry shares a common boundary
with any of the geometries stored in the Table, but also when the intersection of
Touches the interiors of the searched shapes is empty. In the Point/Polyline case, the point
may only touch an endpoint of the line. Applies to all combinations except
Point/Point.
Searches for occurrences when the input geometry is completely within any of the
Within
geometries stored in the Table. Valid for all shape type combinations.
4
uWATER 1.1
5. Examples
Three examples are provided in this section to demonstrate the functionality of uWATER and ArcGIS
Explorer. The first example demonstrates computation of groundwater drawdown from a hypothetical
water table (groundwater level) in Kane County, Illinois using the default “Query” function in ArcGIS
Explorer. The second example identifies streams located in large drawdown areas (from the previous
example) using the “Complex Query” function in uWATER. The third example demonstrates
identification of fish sample sites located within a certain range of the census block in McHenry County,
Illinois also using the “Complex Query” function in uWATER.
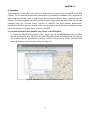
5.1 Calculate attributes from a shapefile using “Query” in ArcGIS Explorer
a) Launch the uWATER main program. Under “Home” tab, use the Add Content button to browse
and add the shapefile Kane_GW.shp in the uWATERtest/Kane folder downloaded with the program.
The shapefile contains groundwater modeling results for Kane County, Illinois, including head
values (groundwater levels) for each model cell (Figure 5).
Figure 5. Add shapefiles for ArcGIS Explorer process
5
uWATER 1.1
b) Use curser to highlight the kane_gw layer in the Table of Contents (left of map), and under
“Tools” tab, click Query button (Figure 6).
Figure 6. Open Query window in “Tools” tab
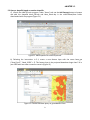
c) The drawdown is computed by calculating the difference between two water surfaces(heads). In
the “Query Builder” window, first use curser to select (by double-clicking) the head in predevelopment condition (Head_PreD). Key in a “-” sign by keyboard and select the head in 2050 with
less water resource intensive scenario (Head_2050L). Key in “> 5” by keyboard. This query criterion
will show up at the bottom text box in the “Query Builder” window (Figure 7).
Figure 7. Type in attribute query criteria
6
uWATER 1.1
d) Click on the Test button first and the “Query Builder” window will show how many features are
identified by this query; click OK button and ArcGIS Explorer will conduct the query (Figure 8).
Figure 8. Confirm query criteria
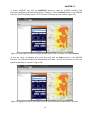
e) This procedure results in a new feature layer with the name “kane_gw ("Head_PreD""Head_2050L" > 5)” shown in red by the default setting of ArcGIS Explorer. This feature layer is the
projected drawdown larger than 5 ft in 2050 under the less water resource intensive scenario
(Figure 9).
Figure 9. ArcGIS Explorer displays query result in the map
7
uWATER 1.1
f) Repeating this procedure several times with different drawdown query criteria will result in
several layers that overlap each other. The user can change the color of the resulting layers and put
them into an appropriate sequence to create a graduated color scheme map of different degrees of
drawdown. For example, as shown in Figure 10, green is drawdown less than 5 ft, blue is between 5
and 10 ft, yellow is between 10 and 20 ft, orange is between 20 and 30 ft, and red is greater than
30 ft.
Figure 10. Multiple queries result in colored drawdown map for different degrees of drawdown
8
uWATER 1.1
5.2 Query a shapefile based on another shapefile
a) Launch the uWATER main program. Under “Home” tab, use the Add Content button to browse
and add the shapefile Kane_GW.shp and Kane_Rivers.shp in the uWATERtest/Kane folder
downloaded with the program (Figure 11).
Figure 11. Add shapefiles for uWATER process
b) Following the instructions in 5.1, create a new feature layer with the name kane_gw
("Head_PreD"- "Head_2050L" > 5). This feature layer is the projected drawdown larger than 5 ft in
year 2050 with less water resources scenario (Figure 12).
Figure 12. Conduct attribute query on groundwater levels
9
uWATER 1.1
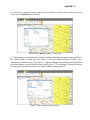
c) Under “uWATER” tab, click the uWATER1.1 button to open the uWATER interface. The
interface is designed to be docked along with “Contents.” Click the Refresh button in the uWATER
interface. The list of feature layers in the “Contents” will show up in the listbox. (Figure 13).
Figure 13. Open uWATER interface and get feature layers in the “Contents” by clicking Refresh
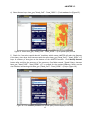
d) Use the curser to highlight kane_rivers layer and click the Select button in the uWATER
interface. The information about the selected layer will show. Use the ratio buttons to select the
spatial relationship as “intersect” (Figure 14).
Figure 14. Highlight the kane_rivers layer by curser and choose spatial relationship: “intersect”
10
uWATER 1.1
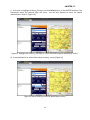
e) Select feature layer: kane_gw (“Head_PreD"- "Head_2050L" > 5) in drawdown list (Figure 15).
Figure 15. Select kane_gw (“Head_PreD"- "Head_2050L" > 5) as spatial query criteria
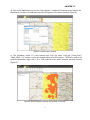
f) Check the “use entire spatial domain” checkbox, which means uWATER will select the features
in the kane_rivers layer that intersects with the entire kane_gw (“Head_PreD"- "Head_2050L" > 5)
layer. A summary is also given at the bottom of the uWATER interface. Click Identify features
button after verifying the accuracy of the summary. One folder named “Spatial Query: intersect
kane_gw ("Head_PreD"- "Head_2050L" >5)” is created for the resulted SQNotes, which are the
river features intersecting with kane_gw (“Head_PreD"- "Head_2050L" > 5) layer (Figure 16).
Figure 16. Click Indentify Features and spatial query results display in the map
11
uWATER 1.1
5.3 Query a shapefile based on attributes of another shapefile
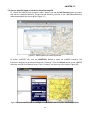
a) Launch the uWATER main program. Under “Home” tab, use the Add Content button to browse
and add the shapefile McHenry_Census.shp and McHenry_fish.shp in the uWATERtest/McHenry
folder downloaded with the program (Figure 17).
Figure 17. Add shapefiles for uWATER process
b) Under “uWATER” tab, click the uWATER1.1 button to open the uWATER interface. The
interface is designed to be docked along with “Contents.” Click the Refresh button in the uWATER
interface, and the list of feature layers in the “Contents” will show up in the listbox. (Figure 18).
Figure 18. Open uWATER interface and get feature layers in the “Contents” by clicking Refresh
12
uWATER 1.1
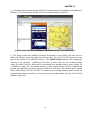
c) Use curser to highlight mchenry_fish layer and click Select button in the uWATER interface. The
information about the selected layer will show. Use the ratio buttons to select the spatial
relationship as “within” (Figure 19).
Figure 19. Highlight the mchenry_fish layer by curser and choose spatial relationship “within”
d) Use drawdown list to select feature layer mchenry_census (Figure 20).
Figure 20. Select mchenry_census as spatial query criteria
13
uWATER 1.1
e) Use drawdown list to select attribute Urban_Tot (urban population divided by total population),
and key in 0.5 in the minimum textbox, 0.9 in the maximum textbox. (Figure 21).
Figure 21. Select Urban_Tot as attribute query criteria and type in min and max value
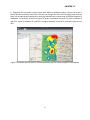
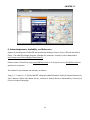
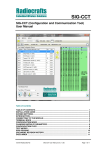
f) This setting means that uWATER will select the features in the mchenry_fish layer that are
within the mchenry_census layer with the attribute Urban_Tot from 0.5 to 0.9. A summary is also
given at the bottom of the uWATER interface. Click Identify features button after verifying the
accuracy of the summary. uWATER will first finish a query based on the attribute setting:
Urban_Tot from 0.5 to 0.9. It will result in a new feature layer named mchenry_census (Urban_Tot
> 5 AND 0.9> Urban_Tot). The default setting is in blue outline (Figure 22). Next, uWATER will
conduct the spatial query mchenry_fish layer within the new layer. One folder named “Spatial
Query: within Urban_Tot from 0.5 to 0.9” is created for the resulting SQNotes, which are the fish
sample features within the mchenry_census layer with the attribute Urban_Tot from 0.5 to 0.9 (red
pushpin in Figure 22).
14
uWATER 1.1
Figure 22. Click Identify Features and spatial query results display in the map
6. Acknowledgements, Availability, and References
Support for development of uWATER was provided by McHenry County, Illinois, USA and the State of
Illinois. The uWATER package (program, example files, and users’ manual) is free to download at
http://www.isws.illinois.edu/gws/sware/uwater/.
Please contact Yi-Chen Ethan Yang ([email protected]) or Yu-Feng Forrest Lin ([email protected]) for
questions or comments.
The citation for the software and manual is as follows:
Yang, Y. C. E. and Lin, Y. F. (2010) uWATER: Ubiquitous WebGIS Analysis Toolkit for Extensive Resources,
User’s Manual. Illinois State Water Survey, Institute of Natural Resource Sustainability, University of
Illinois at Urbana-Champaign.
15