1
Ganji SK, Banerjee A, Patel AM, Zhao YD, Dimitrov IE, Browning JD, Brown ES, Maher
EA, Choi C. T2 measurement of J-coupled metabolites in the human brain at 3T. NMR
Biomed 2012;25(4):523-529.
Mlynarik V, Gruber S, Moser E. Proton T1 and T2 relaxation times of human brain
metabolites at 3 Tesla. NMR Biomed 2001;14(5):325-331.
Kirov, II, Fleysher L, Fleysher R, Patil V, Liu S, Gonen O. Age dependence of regional
proton metabolites T2 relaxation times in the human brain at 3 T. MagnReson Med
2008;60(4):790-795.
Zaaraoui W, Fleysher L, Fleysher R, Liu S, Soher BJ, Gonen O. Human brain-structure
resolved T(2) relaxation times of proton metabolites at 3 Tesla. MagnReson Med
2007;57(6):983-989.
Based on these reports here are some suggested values for 3T: NAA = 260; Cre = 160; Cho =
230; mI = 200; Glu=180; Water = 85.
4.1.2. Fix Frequency Offset for Initial Values
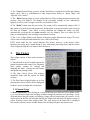
Also shown in the widget shown above is a checkbox by each metabolite to “Use DB ppm
values”. If checked, this will force the program to use the prior information of the peak
frequency offsets when estimating initial values. If unchecked, the maximum value over a small
frequency range will be used.We have used this in some data sets to improve starting values for
lactate where there are significant baseline contributions surrounding the lactate signal that can
fool the peak search algorithms in the initial values routines.
4.1.3. Phase 0 Correction
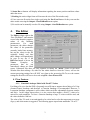
Two options are now included to apply a zero-order phase correction to the data. The first is in
the “Initial” tab, and allows applying a zero-order phase correction to the data and then
rerunning the initial values estimation. The second option is in the “Global” tab, and includes
options to unwrap the zero-order phase function and then apply this to the data. This option has
been found to improve fitting in cases where peaks are phased close to 180 degrees. Note this
option will not apply the phase correction to the spectral data stored on disk, but this can be done
using the setting in the “Output” tab, to “Apply Phase01 values to Original Data”.
4.1.4. Confidence Limits Selection
The calculation of confidence limits can be quite time consuming, so an option has been added in
the “QA” tab to only calculate selected values instead of all parameters.
4.1.5. Prior Information Creation
MIDAS-FITT2 reads an XML file that contains prior information about the metabolites used in
the fitting model. An example of a text file (could be any name, but metabolites.xml is one
reasonable example) showing three metabolites, NAA, creatine and choline is shown below.
<PRIOR_METABOLITE_INFORMATION>
<param value="choline++0++0++0++0++3.1850000++9.0000000++1.9575600e-015" name="fitt_PriorLine001"/>
<param value="creatine++0++0++0++0++3.0270000++3.0000000++-5.3074000e-016" name="fitt_PriorLine002"/>
<param value="n-acetyl-aspartate++0++0++0++0++2.008000++3.00000++8.2668400e-016" name="fitt_PriorLine003"/>
<param value="n-acetyl-aspartate++0++0++0++1++2.3644400++0.13678200++-27.715700" name="fitt_PriorLine004"/>
<param value="n-acetyl-aspartate++0++0++0++2++2.4404700++0.10923800++64.185600" name="fitt_PriorLine005"/>
<param value="n-acetyl-aspartate++0++0++0++3++2.4911700++0.36175400++-100.53400" name="fitt_PriorLine006"/>
<param value="n-acetyl-aspartate++0++0++0++4++2.5672000++0.38643300++56.696200" name="fitt_PriorLine007"/>
4