1
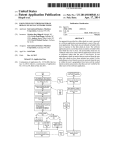
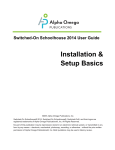
Displacement Sensor Confocal Fiber Type ZW Series Smart Monitor ZW Operation Manual Cat. No. Z323-E1-01 Introduction This manual provides information regarding functions, performance and operating methods that are required for using the Smart Monitor ZW. • The Smart Monitor ZW must be operated by personnel knowledgeable in electrical engineering. • To ensure correct use, please read this manual thoroughly to deepen your understanding of the product. • Please keep this manual in a safe place so that it can be referred to whenever necessary. Operation Help ♦ Introduction Software License Agreement What is "Smart Monitor ZW?" System Configuration Configuration of Screens Flow of Operations and Setup ♦ Monitoring Digital Values (Main Window) Display Details Switching between Normal (4 items) and Multi-items (10 items) Display Formats Editing Display Details Threshold Setting Controlling Signals from a Personal Computer ♦ Monitoring Waveform (Graph Window) Sample Waveforms Observing/Editing Waveforms Saving/Loading Waveforms Changing Thresholds List of Graph Display Modes List of Graph Window Specifications Displaying the Waveform of the Measured Value as a Graph (Normal) Displaying One-shot Waveforms Displaying Multiple Waveforms as a Graph Displaying Multiple Waveforms as a Graph in Multiple Screens Changing Graph Display Scale and Center Point Using the Cursor to Display the Value of Measurement Points Displaying/Overwriting Past Waveforms Saving/Loading Waveform Data Changing Threshold Values ♦ Sensing Condition Settings (Sensing Window) List of Functions Displaying Line Brightness Adjusting Areas Area Teaching Advanced Setting Functions not Available on a Controller Set plane for laser intensity adjustment and measurement Setting the Noise Cut Level ♦ Function Settings (Function Settings Window) Save List of Functions Saving Settings to a Controller ♦ Data Logging (Logging Window) Setting Sampling Conditions Executing the Logging Typical Logging Setting Examples Logging Function and Flow of Setup List of Logging Window Specifications About the Wizard Mode Setting Logging Data Setting Logging Start/End Setting the Sampling Interval Setting the Sampling Stop Conditions Setting the Data Format Logging Start To Log the Shape for Each Detected Workpiece ♦ Bank Functions Switching Banks Clearing Banks Copying Bank Saving/Loading Bank Settings ♦ Option Functions Data Folder Changing Graph Background Color Alignment of Windows Selecting Connection Destination ROM Recovery Settings List ♦ Did You Know Display measured values ♦ List of Error Messages Software License Agreement This agreement is between OMRON Corporation (hereafter "OMRON") and the user of the software (hereafter called the "user"). 1. The software referred to in this agreement includes all of the computer programs and technical materials included in this package. The copyrights to the software are retained by OMRON and by other parties that have authorized OMRON to use their software and this agreement does not transfer the copyrights to the user. 2. The license is valid to install the software on only one computer per license. 3. The user may not allow the software to be used by, provide the software to, or loan the software to any other party without the prior written permission of OMRON. 4. The user may copy the software only as a backup. The user may not reverse-compile, reverse-assemble, reverse-engineer, or perform any similar process on the software. 5. The user will not disclose the contents of this software to any other party either during or after the validity of this agreement. 6. OMRON will guarantee the operation of the software to not differ from any of the main points described in the manual accompanying the software to any user that registers. If any faults (e.g., important differences from the manual) are discovered in the software by a registered user within 90 days of purchase, OMRON will replace the software at no charge upon return of the faulty software. 7. OMRON's liability for the software is limited to the software replacement mentioned above. OMRON is in no way liable for damages incurred by the user directly, indirectly, or secondarily as a result of using the software. 8. Even in the even that OMRON should become liable for damages incurred by the user, such liability will be limited to the purchase price of the software. 9. If the user violates this agreement, OMRON can revoke the right of the user to use the software by notification. If OMRON revokes the right of the user to use the software, the user must return the software and all copies of it to OMRON. (C)Copyright OMRON Corporation 2012 All Rights Reserved. SPREAD for Windows Forms Copyright (C) 2004-2010 GrapeCity inc. Copyright (C) 2011 by MCCI What is "Smart Monitor ZW?" SmartMonitor ZW is software for the ZW Series fiber coaxial displacement sensor. This software allows you to display displacement sensor settings and measured values as they are or in graphs, and load or save settings to/from a personal computer connected to the controller. Logging function Display of waveforms from multiple channels in the graph window (waveform display) Smart Monitor ZW has the following features. Monitoring of Measurement State Monitoring of measured values over time "Monitoring Waveforms (Graph Window) > Sample Waveforms > Displaying the Waveforms of Measured Values as a Graph (Normal)" Collectively monitoring the measured values of multiple controllers "Monitoring Digital Values (Main Window) > Display Details" Viewing the incident level (sensitivity) of the head "Sensing Condition Settings (Sensing Window) > Advanced Setting Functions not Available on a Controller > Displaying Line Brightness" Setup Support Functions Detailed setting of sensing conditions "Sensing Condition Settings (Sensing Window) > Advanced Setting Functions not Available on a Controller > Displaying Line Brightness" "Sensing Condition Settings (Sensing Window) > Advanced Setting Functions not Available on a Controller > Adjusting Area" Excellent list display settings "Sensing Condition Settings (Sensing Window) >List of Functions" "Function Settings (Function Settings Window) > List of Functions" Threshold setting "Monitoring Digital Values (Main Window) > Threshold Setting" "Monitoring Waveform (Graph Window) > Changing Thresholds > Changing Threshold Values" Data backup "Bank Functions > Saving/Loading Bank Settings" Logging Measured Values "Data Logging (Logging Window) > Setting Sampling Conditions > Setting Logging Start/End" System Configuration Basic configuration 1. Sensor Head Detects the sensing object. The Sensor Head is connected from the controller. The Sensor Head for the fiber coaxial displacement sensor ZW Series is used. 2. Controller Processes measurement, and outputs the processing result. 3. Smart Monitor ZW This software allows you to change the controller settings on a personal computer or monitor measured values. Configuration of Screens Tool Bar The following describes the tool bar on Smart Monitor ZW. (1) Tool bar Button Main Graph Sensing Overview Displays the [Main] window. "Monitoring Digital Values (Main Window)" Displays the [Graph] window. "Monitoring Waveform (Graph Window)" Displays the [Sensing settings] window. "Sensing Condition Settings (Sensing Window)" Displays the [Logging] window. Logging Function "Data Logging (Logging Window)" Displays the [Function settings] window. "Function Settings (Function Settings Window)" Menu Bar The following describes the menu bar on Smart Monitor ZW. Menu File Info Overview Load Settings Loads the settings currently saved in file. Save Settings Saves the current settings to file. Save Screen Saves the currently displayed window in BMP format. Settings list The settings of the controller can be verified in this list. Sets the destination to save the various data files to. The following file save destinations can be set: Graph data files Data Folder One-shot graph data files Bank group data files Logging data "Option Functions > Data Folder" The background color on the graph screen display can be changed. Select from the following three colors: Graph background color Standard Oscilloscope Blackboard Option "Option Functions > Changing Graph Background Color" Alignment of Windows Aligns the currently displayed windows to the top of the window. "Option Functions > Alignment of Windows" Select connection destination Specifies the IP address of the destination for a connection via Ethernet. "Option Functions > Selecting Connection Destination" ROM recovery Help Contents Version Selects a ROM data file to write into the sensor. "Option Functions > ROM Recovery" Displays this Help. Displays the version information of Smart Monitor ZW. Flow of Operations and Setup The following describes the overall setup procedure. 1. Connection and wiring of Sensor Head Connect the Sensor Head to the controller. "Introduction > System Configuration" 2. Installing Smart Monitor ZW Install Smart Monitor ZW on the personal computer. 3. Starting up Smart Monitor ZW Start up Smart Monitor ZW after checking that the controller has been set to the RUN mode. 4. Smart Monitor ZW operations Display displacement data from controller as a waveform or make measurement-related settings. Displaying measured values Displaying measured values as a graph Setting up sensing Setting up functions Logging measured values 5. Controller operations Display the present measured values. The various inputs relating to threshold values set to measured values and relating to measurement can also be typed in from the controller. Do not perform the following when Smart Monitor ZW is used. Otherwise, a communications error will occur, and prevent normal operation of Smart Monitor ZW. Operating keys or changing switch settings on the controller Bank switching using external lead signals Switching from the RUN to FUN modes Disconnecting the Ethernet cable Changing the IP address of the personal computer The same operations as these can also be executed in Smart Monitor ZW. Display Details Clicking the [Main] button displays the [Main] window. (1) Input buttons Item Description Enables/disables the buttons (LED-OFF/TIMING/RESET/ZERO). While an input button on Smart Monitor ZW is enabled, the external lead signals of the controller are disabled. External input Pay attention to this when using external lead signals to perform measurement. (When you exit Smart Monitor ZW, the external lead signals are automatically restored to an enabled state.) LED-OFF Stops emission from the Sensor Head. Clicking the [Start] button stops emission. Clicking the [End] button resumes emission. TIMING Timing input to the controller is ON while the [Enter] button is clicked. Timing input returns to OFF when the [Enter] button is released. RESET Reset input to the controller is ON while the [Exe.] button is clicked. Reset input returns to OFF when the [Exe.] button is released. ZERO Clicking the [Exe.] button executes zero reset processing. Clicking the [Release] button cancels zero reset processing. (2) Indicators Indicators Controller body Description STAB STABILITY indicator The STABILITY indicator lights when the object is placed within the measuring range, and flashes when it is out of the measuring range. It goes out if the intensity is insufficient or saturated. ZERO ZERO indicator The Zero Reset indicator lights when the zero reset function is being executed. ENABLE ENABLE indicator The ENABLE indicator lights when the Sensor is ready for measurement. HIGH HIGH indicator The HIGH indicator lights when the condition “HIGH threshold < measured value” is satisfied. PASS PASS indicator The PASS indicator lights when the condition “LOW threshold ≤ measured value ≤ HIGH threshold” is satisfied. LOW LOW indicator The LOW indicator lights when the condition “measured value < LOW threshold” is satisfied. (3) Data displays Main display The current measured value is displayed. This functions in the same way as the main display on the controller. When the main display on Smart Monitor ZW is saturated (e.g. too many digits past the decimal point), "OVER" is displayed. Sub-display Item Hide Details The sub-display is not displayed. Displays the currently set high threshold value. H threshold The high threshold value can be set in the window that is displayed by clicking the [Set] button. Displays the currently set low threshold value. L threshold The low threshold value can be set in the window that is displayed by clicking the [Set] button. Resolution Present value Displays the unevenness of the measured values on screen. Displays the present value. Switching between Normal (4 items) and Multiitems (10 items) Display Formats In the [Main] window, you can select between Normal (4 items) and Multi-items (10 items) as the number of items to be displayed. Operation Procedure 1. Display the [Main] window and click the [Edit Window] button. 2. Select either [Normal] or [Multi-items] at Select display. Editing Display Details You can change the items to be displayed in the [Main] window. Operation Procedure 1. Select "Select display" in the [Edit display details] window and set the items to be displayed. 2. Select [Area] to display [Incident level] or [Exposure time]. (1) Main display Setting item Details Display/hide checkbox Items whose checkbox is marked here are displayed in the [Main] window. Displayed data TASK No. Title Select the details to be displayed in the [Main] window. Select the TASK No. whose details are to be displayed. TASK Nos. sometimes cannot be selected depending on the channel and display details. Enter the title of the measured value to display. [Normal]: Enter eight characters at most. [Multi-items]: Enter five characters at most. (2) Sub-display Select the value to be displayed in the sub-display. Up to two values can be displayed in the sub-display. Nothing is displayed when "Hide" is selected. Display item options The items that can be set differ according to the Normal or Multi-items settings. - Items that can be displayed in normal display format Item Display areas (1), (2) Display areas (3), (4) Measured value Yes Yes Incident level Yes Yes Exposure time Yes Yes Current Yes Yes Voltage Yes Yes Binary output Yes Yes Absolute distance Yes Yes BANK Yes Yes Indicator Yes - Input button Yes - - Items that can be displayed in multi-item display format Item Display areas (1), (2) Display areas (3) to (10) Item Display areas (1), (2) Display areas (3) to (10) Measured value Yes Yes Voltage Yes Yes H threshold Yes Yes Binary output Yes Yes L threshold Yes Yes Absolute distance Yes Yes Resolution Yes Yes BANK Yes Yes Present Value Yes Yes ZERO (input) Yes - Incident Level Yes Yes Status indicator Yes - Exposure time Yes Yes Output indicator Yes - Current Yes Yes Input button Yes - Threshold Setting Threshold values can be set. When the normal display format is selected, the measured value must be displayed. Also, when multi-item display format is selected, the high and low threshold values must be displayed. Threshold values can be set only directly. Operation Procedure 1. Click the [Set] button. 2. Enter the desired threshold values and click the [OK] button. Controlling Signals from a Personal Computer When the normal display format is selected, the input buttons must be displayed. Also, when the multi-item display format is selected, ZERO (all) must be displayed. Operation Procedure 1. Click the respective button. Item Description Enables/disables the buttons (LED-OFF/TIMING/RESET/ZERO). While an input button on Smart Monitor ZW is enabled, the external lead signals of the contoller of the channel No. to the left of the display item are disabled. External input Pay attention to this when using external lead signals to perform measurement. (When you exit Smart Monitor ZW, the external lead signals are automatically restored to an enabled state.) LED-OFF Stops emission from the Sensor Head. Clicking the [Start] button stops emission. Clicking the [End] button resumes emission. TIMING Timing input to the controller is ON while the [Enter] button is clicked. Timing input returns to OFF when the [Enter] button is released. RESET Reset input to the controller is ON while the [Exe.] button is clicked. Reset input returns to OFF when the [Exe.] button is released. ZERO Clicking the [Exe.] button executes zero reset processing. Clicking the [Release] button cancels zero reset processing. List of Graph Display Modes How waveforms are displayed differs according to the selected display mode. Single 1 waveform Multiple Multi waveforms Normal Yes Yes Yes One-Shot Yes No No Repeat-Shot Yes No No List of Graph Window Specifications One-Shot/ Repeat-Shot Remarks (A)10ms (B)100ms((1)) (A)100µs (B)500µs((2)) (1) (A) In case of 100ms/div, 200ms/div, 400ms/div (B) In case of 500ms/div, 1s/div, 2s/div, 5s/div, 10s/div (2) (A) In case of 5ms/div, 10ms/div, 20ms/div (B) In case of 50ms/div, 100ms/div, 200ms/div 100ms/div, 200ms/div, 400ms/div, 500ms/div, 1s/div, 2s/div, 5s/div, 10s/div 5ms/div, 10ms/div, 20ms/div, 50ms/div, 100ms/div, 200ms/div - Normal Data sampling interval Horizontal Scale (1) Data of total "current window + past 9 windows" is retained regardless of horizontal scale. (A longer horizontal scale results in more points being held.) Max. number of points: 50 s/window x 5 windows = 250 s 250 s / 10 ms=25000 points Number of data retention points Max. 25000 (This is equivalent to the number points ((1)) of points that can be displayed (at 10 s/div: on window/number of waveforms data for total of that can be displayed.)) 250 s) Max. 2000 points (Note 1) x past waveforms (max. 9 waveforms)(Note 2)((2)) (at 200 ms/div: data for total of 1 s) Number of simultaneously plotable windows 4 waveforms(*) ((1)) Only 1 waveform((2)) Max. number of graph planes 4 planes(*)((1)) Only 1 plane((2)) Selection of plot data Select as desired from InputA to I and TASK1 to 4. Max. 4 waveforms (*) Select a waveform as desired from InputA to I and TASK1 to 4. (2) (Note 1) Equivalent to number of points that can be displayed in a single window Calculated by horizontal scale x 5 div / data sampling interval Example: When horizontal scale is 10 ms/div, 10 ms/div x 5 div / 100 µs = 500 points (Note 2) Past waveforms obtained at the same conditions are held. (1) 1 window multiple waveform plotting and 1 waveform plotting in each multiple window can be selected (2) Past waveforms obtained at the same conditions are held. - Browsing past waveforms Not possible Current waveform + past 4 waveforms can be retained and browsed/overwritten. - Common Specifications Vertical Scale 2µm/div,5µm/div,10µm/div,20µm/div,...,20000mm/div - Auto-scale function The vertical scale is automatically adjusted so that plotted data is enclosed. This function is also supported on multiple waveforms. Can be displayed at all times. Cursor information Waveform data at a specified time is displayed. Waveform save format (Note) Can be selected by [Waveform data] Original data format, csv format (Note), selecting [Settings data] Setting data when waveforms are obtained options can be saved in csv file form.(Note) when saving waveforms. *: Waveforms may be broken off midway depending on the specifications of the personal computer. Displaying the Waveform of the Measured Value as a Graph (Normal) The following describes how to display a waveform of the measured values in the [Normal] mode. Waveform Display Example Clicking the [START] button displays the transition of measured values and the various outputs. Display is continued until the [STOP] button is clicked. • In the case of one-shot waveforms, The previous and following waveform are displayed with the rising edge of the timing signal (or self-trigger) used as the trigger. Operation Procedure 1. Display the [Graph] window, and select the [Normal] mode in the mode selection. Normal Plots the waveform in real time. 2. Click the [Graph edit] button, and set the waveform plot mode in the [Graph edit] window. 3. Click the [START] button. Plotting of the waveform starts. 4. Click the [STOP] button. Plotting of the waveform stops. 5. Click the [Auto-scale] button. [Vertical Scale]/[Center Point] are automatically adjusted so that all waveforms currently in the graph plotting area are displayed. [Vertical Scale]/[Center Point] can be set manually. For details on how to manually set [Vertical Scale]/[Center Point], see "Changing Graph Display Scale and Center Point." "Monitoring Waveform (Graph Window) > Observing/Editing Waveforms > "Changing Graph Display Scale and Center Point" 6. Process and analyze the waveform. The waveform can be saved or loaded, or values can be verified by the cursor. Displaying One-shot Waveforms The following describes how to select the mode and set graphic triggers that are required when displaying a waveform of the measured values in the [One-Shot] mode or [Repeat-Shot] mode. For details on other settings and the flow of settings in the [Graph] window, see "Displaying the Waveform of the Measured Value as a Graph (Normal)." "Monitoring Waveform (Graph Window) > Sample Waveforms > Displaying the Waveforms of Measured Values as a Graph (Normal)" Operation Procedure 1. Display the [Graph] window, and select the [One-Shot] or [Repeat-Shot] mode in the mode selection. One-Shot Plots the waveform at a certain moment that satisfies the trigger conditions. Repeat-Shot Repeatedly plots a one-shot waveform until the [STOP] button is cicked. 2. Set the trigger conditions in the [Graphic trigger settings] window. There are two types of graphic triggers, external signal triggers and self-triggers. When starting waveform display by an external signal trigger When starting waveform display by a self-trigger Displaying Multiple Waveforms as a Graph The following describes how to display the waveforms of multiple TASKs in a single screen in the [Normal] mode. Operation Procedure 1. Display the [Graph] window, and select the [Normal] mode in the mode selection. Normal Plots the waveform in real time. 2. Click the [Graph edit] button, and set the waveform plot mode in the [Graph edit] window. [Sub Disp.] displays the judgement result (HIGH/PASS/LOW) and timing input state. (This can be selected on only one of the TASKs.) 3. Click the [START] button. Plotting of the waveform starts. 4. Click the [STOP] button. Plotting of the waveform stops. 5. Set the graph plotting area so that the waveform display is appropriate. For details on how to manually set [Vertical Scale]/[Center Point], see "Changing Graph Display Scale and Center Point." "Monitoring Waveform (Graph Window) > Sample Waveforms > Changing Graph Display Scale and Center Point" 6. Process and analyze the waveform. The waveform can be saved, loaded or values verified by the cursor. Displaying Multiple Waveforms as a Graph in Multiple Screens The following describes how to display the waveforms of multiple TASKs in multiple respective screens in the [Normal] mode. Operation Procedure 1. Display the [Graph] window, and select the [Normal] mode in the mode selection. Normal Plots the waveform in real time. 2. Click the [Graph edit] button, and set the waveform plot mode in the [Graph edit] window. [Sub Disp.] displays the judgement result (HIGH/PASS/LOW) and timing input state. (This can be selected on only one of the TASKs.) 3. Click the [START] button. Plotting of the waveform starts. 4. Click the [STOP] button. Plotting of the waveform stops. 5. Set the graph plotting area so that the waveform display is appropriate. For details on how to manually set [Vertical Scale]/[Center Point], see "Changing Graph Display Scale and Center Point." "Monitoring Waveform (Graph Window) > Sample Waveforms > Changing Graph Display Scale and Center Point" 6. Process and analyze the waveform. The waveform can be saved, loaded or values verified by the cursor. Changing Graph Display Scale and Center Point Here, you adjust the graph so that waveforms are displayed in an easier-to-view format. Operation Procedure 1. Determine [Vertical Scale]/[Horizontal Scale]/[Center Point] to suit the values of the waveform data to be measured. Items Horizontal Scale Description Set the horizontal axis scale of the graph to be plotted. This is applied to all waveforms. Vertical Scale Set the vertical axis scale of the graph plotting area. Center Point Set the center value of the vertical axis of the graph plotting area. Values can be entered directly by clicking the [INPUT] button at [Center Point]. (input range: -40000 to 40000/minimum input increment: 0.5 mm) Using the Cursor to Display the Value of Measurement Points Here, you set the cursor. There are two ways of setting the cursor: By dragging the cursor This method is used to investigate the distance value (minimum and maximum values) while viewing the graph. By entering the time This method is used to learn the distance of an already determined time. Operation Procedure By dragging the cursor 1. Drag the cursor inside the graph plotting area. By entering the time 1. Click the [Cursor] tab in the setting areas by individual windows. 2. Click [Cursor 1] or [Cursor 2] button, and enter the desired value in the [Cursor Bar1] or [Cursor Bar2] window to set the cursor position. Displaying/Overwriting Past Waveforms The following describes how to display past waveforms obtained in the [One-Shot] or [Repeat-Shot] mode in the [Graph] window. This function is enabled only in the [One-Shot] or [Repeat-Shot] mode. Operation Procedure 1. Obtain the waveform of the measured values in the [One-Shot] or [Repeat-Shot] mode. For details on the operations of obtaining waveforms in the [One-Shot] or [Repeat-Shot] mode, see "Displaying One-shot Waveforms." "Monitoring Waveform (Graph Window) > Sample Waveforms > Displaying One-shot Waveforms" 2. Display a past waveform obtained by "monitoring waveform (graph window)." To display a specified waveform Setting items Wave0 Wave1 to 8 Description Previously obtained waveform Wave1: Waveform immediately previous to Wave0 to Wave8: Waveform obtained 9 measurements previously to Wave0 Clicking the [Delete waveform] button deletes all waveforms currently stored in temporary memory. To overwrite the waveform display Clicking the [Delete waveform] button deletes all waveforms currently stored in the temporary memory. Saving/Loading Waveform Data Waveforms displayed on screen can be saved to a file. Waveforms saved to file can be loaded whenever needed for verification. The following describes the procedure for saving and loading waveforms. Procedure for Saving Waveforms 1. Display the [Waveform save options] window. 2. Set comment Input and save additional files. Items Description Select whether or not to add a comment to the file to save Comment Input A file is saved without adding a comment. The waveform is saved without adding a comment. A comment is added and a file is saved. The waveform is saved with a comment added. Enter comments in the entry field below. Save waveform also in CSV format. Save additional file [OK] button [Cancel] button When this checkbox is marked, a graph file and CSV file are saved. If this checkbox is not marked, only the graph file is saved. Save also the setting contents in CSV format. When this checkbox is marked, the settings and waveform are saved in CSV file format. Saves the waveform at the settings you specified. Cancels settings, and returns to the [Graph] window. CSV format files can also be output for handling in spreadsheet programs such as Microsoft Excel in addition to output in a file format for loading waveforms in Smart Monitor ZW. CSV files for graph data and CSV files for setting data can be output. Use these file formats selectively for preparing reports. Procedure for Loading Waveforms 1. Click the [Load Wave] button and select the waveform file to load. When you click the [Load Wave] button while a waveform is displayed, the following dialog box will be displayed. To save the currently displayed waveform, click the [No] button, save the waveform and then load the waveform again. Changing Threshold Values Threshold values can be changed based on the waveform. Operation Procedure 1. Click the H or L threshold, and drag. 2. In the confirmation dialog box, click the [Yes] button. This changes the threshold value. List of Functions The following tables list all the functions that can be set for the controller. Setting items marked in red are settings unique to Smart Monitor ZW. Other settings can also be set on controllers. When the ZS-LDC is Connected Basic setting Only this setting enables stably measuring all measurement objects basically. Items Material Contents Sets the type of workpiece to be measured. Remarks User's Manual Chapter 3 Detailed setting You can set more detailed parameters according to the condition and environment of a workpiece to be measured. Please set this if you cannot obtain stable measured values. Items Contents Remarks Exposure mode Sets the exposure time for the Sensor Head according to the condition of a workpiece surface. User's Manual Chapter 5 Surface subject to exposure time control Sets a reference plane used for adjusting an exposure time. Detail Noise cut level Sets a level of noise reduction. Detail Surface for measurement Sets the data acquisition interval. Area select Selects an area to be measured. Selecting Area 2 for any of the four TASKS moves to the 2-area mode. Surface for measurement1,2 Sets a plane to gain measured values within a selected area. * When "Thickness" of the measurement mode(TASK*) is selected, Measurement surface 2 is also set and its thickness is calculated. Operation parameter X,Y,K,m,n Sets for the measurement mode(TASK*) "Calculation between Tasks". K+mX+nY Detail User's Manual Chapter 5 Displaying Line Brightness The incident level (line brightness) during measurement can be displayed, and the sensing conditions can be set or changed while viewing whether the intensity is insufficient or saturated. The line brightness area can also be specified to eliminate the influence of external light or to optimize the incident level to the front and rear surfaces. For details on how to adjust area, see "Adjusting Areas." "Sensing Condition Settings (Sensing Window) > Advanced Setting Functions not Available on a Controller > Adjusting Areas" In the 2-area mode, the 1st area is displayed in green and the 2nd area is displayed in light blue. The measured value displayed on the sensing settings window is the value measured for the average count of 1 on the surface subject to exposure time control. Adjusting Areas The area used for measurement can be restricted. The influence of external light can be eliminated by removing the section containing external light from the received light area. When the measurement object is set to "Glass," measurement may not be performed correctly as measurement will be influenced by reflection from the rear surface. If this happens, set the measurement area of each measurement surface so that they can be correctly measured. 1. Set area 1 so that only the peak of the front surface is enclosed. Set the area so that the location to be actually measured falls inside the area. The measuring cycle for the 2-area measurement mode is twice as long as the one for Area 1 or 2, which is longer than the other. 2. Set area 2 so that only the peak of the rear surface is enclosed. Area Teaching When using the 2 area mode, the area on the surface to measure (tracking surface) can be automatically set up based on the reference surface in area 1. Operating Procedure 1. Click the [Area follow setting] button to open the set-up area tracking window. 2. Set up the teaching conditions for area 2. After setting the conditions, press the [Update] button. Parameter Details Compensation This allows the measuring area in area 2 to automatically track based on the reference surface. OFF: The track function is disabled. Starting point: Allows area 2 to track only the starting point. Ending point: Allows area 2 to track only the ending point. Starting and ending points: Allows area 2 to track both the starting and ending points. Area follow surface(base) Select a surface from the 1st surface to the 4th surface as a reference for area 2 to automatically track. Area follow surface(follow) Select a surface to measure in area 2. The measuring area selected during area teaching is automatically set up. 3. Place a target to measure and press the [Area teaching] button. Setting Surface Subject to Exposure Time Control Surface subject to exposure time control The adjustable parameter when measuring a transparent object. You can measure an object with a stable received light amount to any plane. Operating Procedure First edge Second edge Surface subject to Third edge exposure time Fourth edge control Peak Adjusts exposure time based on the first plane from NEAR. Adjusts exposure time based on the second plane from NEAR. Adjusts exposure time based on the third plane from NEAR. Adjusts exposure time based on the fourth plane from NEAR. Adjusts the exposure time based on a plane with the greatest received light amount in an area. Setting the Noise Cut Level You can cut noise by setting a larger value than the noise level. Operation Procedure Settings Noise cut level Description Enters the noise cut level (0 to 4095). Notes A too higher noise cut level makes a signal you want smaller, causing instability. List of Functions Setting items differ according to the controller. The following shows lists of functions that can be set by controller type. Setting items marked in red are settings unique to Smart Monitor ZW. Other settings can also be set on controllers. System Item Setting Key lock Key lock OFF, Lock Decimal place 0dig, 1dig, 2dig, 3dig, 4dig, 5dig Zero reset memory OFF, ON Bank mode Standard, Judgment value IP address IP1.IP2.IP3.IP4 IP1: 1 to 233 IP2: 0 to 255 IP3: 0 to 255 IP4: 1 to 254 Subnet mask SUB1.SUB2.SUB3.SUB4 SUB1: 0 to 255 SUB2: 0 to 255 SUB3: 0 to 255 SUB4: 0 to 255 Delimiter CR, LF, CR+LF Analog output Voltage/Current output Sensor Head calibration Calibrates the Sensor Head. Refer to User's Manual. Calibrations conducted in an inappropriate environment may lead to failures in measurement. Timing reset Executes a timing reset. System information This provides four types of system information. Controller version Displays the version of the controller. Controller MAC address Displays the MAC address of the controller. Controller type Displays the type of the controller. ZW-XXX Head serial number Displays the head serial number. Measurement(TASK1) * The following parameters are also applied to TASK2 to TASK4: Processing item Scaling Median filter Parameter Scaling mode ON, OFF Span -999.999999 to 999.999999 Offset -999.999999 to 999.999999 Filter mode OFF, LOW, MID, HIGH Average filter Average count Frequency filter Differential filter Hold Zero reset Judgement Setting Remarks Scaling setup window 1, 2, 4, 8, 16, 32, 64, 128, 256, 512, 1024, 2048, 4096 Filter type OFF, Highpass filter, Lowpass filter, Band pass filter Cut-off frequency 0 to 999.99999 (Hz) Cut-off frequency (upper) 0 to 999.99999 (Hz) Cut-off frequency (lower) 0 to 999.99999 (Hz) Filter mode ON, OFF Diff cycle 1 to 5000 Hold mode Through, Peak, Bottom, Peak to peak, Auto peak, Auto bottom, Auto peak to peak, Average, Sample Trigger External input, Self up, Self down Trigger level -999.999999 to 999.999999 Trigger hys -999.999999 to 999.999999 Trigger delay OFF, ON Delay time 1 to 5000 Sampling time 1 to 5000 Offset value -999.999999 to 999.999999 Status OFF, ON Zero reset mode Real value, Hold value Low -999.999999 to 999.999999 High -999.999999 to 999.999999 Only when Mode is set to "ON" When Trigger is set to "Self up/Self down" Only when Trigger delay is set to "ON" Measurement(I/O) Processing item Judgement(Setting) Non-measurement setting Parameter Setting Hysteresis -999.999999 to 999.999999 Timer mode OFF, OFF-Delay, ON-Delay, One shot Delay time 1 to 5000 Output target TASK1 to 4 Non-measurement setting Keep, Clamp Focus ON, OFF 1st point Distance Value -999.999999 to 999.999999 2nd point Distance Value -999.999999 to 999.999999 Analog output Binary output 1st point Output Value (Current/Voltage) 4 to 20, -10 to 10 2nd point Output Value (Current/Voltage) 4 to 20, -10 to 10 Compensate output mode ON, OFF Remarks Monitor focus window 1st point Current/Voltage 4 to 20, -10 to 10 2nd point Current/Voltage 4 to 20, -10 to 10 1st point Adjustment Value -999 to 999 2nd point Adjustment Value -999 to 999 Output target data None, TASK1, TASK2, TASK3, TASK4 Output type Current output, Voltage output Clamp output MAX, 20 to 4 mA (by 1 mA); -10 to 10 V (by 1 V), MIN Output cycle 1 to 100 Clamp output MIN, MAX GATE period 1 to 100 Output target None, Measured-value 1, Measuredvalue 2, Judgment result Target for measured values 1 to 4 ON, OFF Number of decimal places 0 to 6 digits Linear output adjust window Saving Settings to a Controller The following describes the procedure for saving settings to a controller. When the [Update] button is clicked in each settings screen, the settings are sent to the controller from the personal computer to update the controller's settings. If you turn the controller off in this state, the settings will be cleared from memory. To save settings on a controller, follow the procedure below. Operation Procedure 1. Select [Save] from the [Function settings] window. The [Function settings (save)] dialog box appears. 2. Click the [Save] button and then the [Yes] button in the confirmation dialog box. Logging Function and Flow of Setup Flow of Logging Operation The following shows how data is logged. 1. Sampling start When the [START] button is clicked in the [Logging Standby] window, logging is started. When logging is started, data is collected at the preset sampling interval. (At this stage, data is not yet saved to file.) 2. Generation of logging start trigger When the logging start trigger is turned ON, saving of collected data to file starts. 3. Generation of logging end trigger When the logging end trigger is turned ON, saving of collected data to file ends. Saving of data is performed from when the logging start trigger turns ON until the logging end trigger turns ON. 4. Generation of the logging start/end triggers is monitored until a sampling stop condition is generated. When multiple start/end triggers are generated, you can set whether to save collected data to different files or overwrite one file with the latest data. The logging end trigger sometimes also satisfies the sampling stop condition at the same time (logging ends simultaneously with end of data saving). 5. Sampling stop Collection of data stops when a sampling stop condition is generated. List of Logging Window Specifications Item Specifications Remarks Sampling Interval 1 ms to 999.9 ms The sampling interval can be set to any value regardless of the data to be logged. Logging data Select as desired from TASK1 to 4. Max. 4 data (*) - Possible number of logging points Any number of points can be saved as long as there is enough free space on the personal computer's hard disk. - Possible logging time Up to 24h can be set as the longest logging time. - Logging is started without a trigger/ and is continued until the logging stop condition is satisfied. - None Trigger target selection, Trigger Pattern of I/O edge selection, Delay Trigger setting Trigger target selection, Trigger edge selection, TriggerLevel setting, Delay Trigger setting - Trigger target selection, Trigger Data Window edge selection, TriggerLevel setting, Delay Trigger setting - Data Slope Logging start trigger/ Logging end trigger Clock The clock is specified in hours/minutes/seconds. Elapsed time The elapsed time is specified in hours/minutes/seconds/ms. The number of data after the start Data number trigger is specified. 1 to 500000 Delay Trigger -9999 ms to 9999 ms (*) Repeat times 1 to 10000 (times) Sampling Stop conditions Data Format - The elapsed time is specified in Elapsed time hours/minutes/seconds. 1s to 24h Whether or not to save flag data can be selected. This can be set only for the end trigger. This can be set only for the end trigger. This can be set only when one of Pattern of I/O, Data Slope or Data Window is selected at Start Trigger or End Trigger. When "0" is set, sampling is repeated endlessly. - *: Waveforms may be broken off midway depending on the specifications of the personal computer. Logging files are divided up into sections of approximately 500 Mbytes in size. Pay attention to the number of data to be logged when executing logging as the maximum number of points that can be displayed on Microsoft(R) Excel is 65536. About the Wizard Mode When the logging setting wizard is used, the setting items can be set in order. Operation Procedure 1. Mark the [Wizard ON/OFF] checkbox. 2. Select the logging data, and click the [Next] button. 3. Set the logging start trigger, and click the [Next] button. 4. Set the logging end trigger, and click the [Next] button. 5. Set the sampling interval, and click the [Next] button. 6. Set the sampling stop conditions, and click the [Next] button. 7. Set the data format, and click the [Next] button. 8. Click the [Stanby] button. 9. In the confirmation window, click the [OK] button. 10. Click the [START] button to start logging. 11. Click the [STOP] button to stop logging. 12. Save the logging data. The default save destination is the Log_Data folder in the Smart Monitor ZW installation folder. Setting Logging Data Set the data to be logged. Operation Procedure 1. Display the [Logging] window. A list of the logging data is displayed. 2. Mark the checkbox of the TASK you want to log. Setting Logging Start/End Operation Procedure for Setting the Logging Start Trigger 1. Display the [Logging] window and set the logging start trigger. Selection item Setting Description No triggers are set. Saving of data starts from the moment that the [START] button is clicked in the [Logging Standby] window. None Set this item when you want to apply a trigger by the input result (e.g. trigger input) from a controller assigned as the trigger target or by the output result (HIGH/PASS/LOW, etc.). Trigger target Select the trigger target to be used as the logging start trigger. Range: TASK1 to TASK4 Set which change in state of the signal, from ON to OFF or from OFF to ON, is to be taken as the trigger. Range: OFF to ON, ON to OFF (default: OFF to ON) Pattern of I/O OFF to ON/ ON to OFF Select which I/O signal on the selected trigger target is to be used as the Checked I/O logging start trigger. Range: BUSY, ENABLE, TIMING, ZERO, HIGH, PASS, LOW Set the delay time when you want to start logging a little before or a little after the start trigger. Range: -9999 to 9999 (ms) (default: 0 ms) Delay Trigger This item is for setting the change in the state of the data (measured value) as the logging start trigger. Set the trigger level. When the data falls above or below this preset trigger level value, this is taken to be the start trigger. Trigger target Select the trigger target to be used as the logging start trigger. Range: TASK1 to TASK4 Select which edge, when the data exceeds the trigger level, or when the data falls below the trigger level to be used as the start trigger. Range: Up trigger, Down trigger (default: Up trigger) Up trigger/ Down trigger Data Slope Set the delay time when you want to start logging a little before or a little after the start trigger. Range: -9999 to 9999 (ms) (default: 0 ms) Delay Trigger This item is for setting the change in the state of the data (measured value) as the logging start trigger. Set the upper/lower limit value. When the measured value falls inside or outside of that range, this is taken to be the start trigger. Trigger target Select the trigger target to be used as the logging start trigger. Range: TASK1 to TASK4 UpperLimit Set the upper limit value of the specified range. Range: -999.999 to 999.999 LowerLimit Set the lower limit value of the specified range. Range: -999.999 to 999.999 Select which measured value inside or outside the specified range is to be used as the start trigger. Range: WindowIn, WindowOut (default: WindowIn) Data Window WindowIn/ WindowOut Set the delay time when you want to start logging a little before or a little after the start trigger. Range: -9999 to 9999 (ms) (default: 0 ms) Delay Trigger Clock This item is for setting the time (xx h, xx m, xx s) that logging is to be started. Operation Procedure for Setting the Logging End Trigger 1. Display the [Logging] window and set the logging end trigger. Selection item Setting Description No triggers are set. Saving of data stops from the moment that the [STOP] button is clicked in the [Logging Standby] window. None Set this item when you want to apply a trigger by the input result (e.g. trigger input) from a controller assigned as the trigger target or by the output result (HIGH/PASS/LOW, etc.). Trigger target Select the trigger target to be used as the logging end trigger. Range: TASK1 to TASK4 Set which change in state of the signal, from ON to OFF or from OFF to ON, is to be taken as the trigger. Range: OFF to ON, ON to OFF (default: OFF to ON) Pattern of I/O OFF to ON/ ON to OFF Select which I/O signal on the selected trigger target is to be used as the Checked I/O end trigger. Range: BUSY, ENABLE, TIMING, ZERO, HIGH, PASS, LOW Delay Trigger Set the delay time when you want to start logging a little before or a little after the end trigger. Range: -9999 to 9999 (ms) (default: 0 ms) This item is for setting the change in the state of the data (measured value) as the logging end trigger. Set the trigger level. When the data falls above or below this preset trigger level value, this is taken to be the end trigger. Trigger target Select the trigger target to be used as the logging end trigger. Range: TASK1 to TASK4 Select which edge, when the data exceeds the trigger level, or when the data falls below the trigger level to be used as the end trigger. Range: Up trigger, Down trigger (default: Up triggr) Data Slope Up trigger/ Down trigger Delay Trigger Set the delay time when you want to start logging a little before or a little after the end trigger. Range: -9999 to 9999 (ms) (default: 0 ms) This item is for setting the change in the state of the data (measured value) as the logging end trigger. Set the upper/lower limit value. When the measured value falls inside or outside of that range, this is taken to be the end trigger. Trigger target Select the trigger target to be used as the logging end trigger. Range: TASK1 to TASK4 UpperLimit Set the upper limit value of the specified range. Range: -999.999 to 999.999 LowerLimit Set the lower limit value of the specified range. Range: -999.999 to 999.999 Select either of the measured value inside or outside the specified range is to be used as the end trigger. Range: WindowIn, WindowOut (default: WindowIn) Data Window WindowIn/ WindowOut Delay Trigger Set the delay time when you want to end logging a little before or a little after the end trigger. Range: -9999 to 9999 (ms) (default: 0 ms) Clock This item is for setting the time (xx h, xx m, xx s) that logging is to end. Elapsed time Set the time (xx h, xx m, xx s) from the start trigger up to the end trigger. Data logging ends when the preset time is reached since the start trigger. data number Set the number of data points to acquire. Data logging ends when the preset number of data points has been got since start of logging. Setting the Sampling Interval Set the data acquisition interval. Note that even if a time shorter than the measurement cycle is set, sampling is performed only at each measurement cycle of the controller. Operation Procedure 1. Display the [Logging] window and set the sampling interval. Item Numerical Value Unit 1 to 999.9 ms 1 to 3600 s 1 to 60 min Description Set the data acquisition interval. The numerical value that can be set differs according to the unit. Setting the Sampling Stop Conditions Logging ends when the preset start trigger to end trigger sequence has been repeated for the specified count or when the log time has elapsed since logging was started. Operation Procedure 1. Display the [Logging] window and set the sampling stop conditions. Setting item Description Set how many times the start trigger to end trigger sequence is to be executed. Repeat times Sampling stops when the preset start trigger to end trigger sequence count is repeated. (default: 1) Elapsed time Stops sampling when the specified time has elapsed since the start of logging. 2. Set the file save form for each trigger end. Setting item Save data to same file. Save data to another file. Description Adds and saves data to an existing file at each trigger end. Saves data to another file at each trigger end. This item is active when "Save data to another file." Assign number to auto-made file. When appending a new file with a number, mark this checkbox and set the file number. No. Set the number to append to the auto-made file. Setting the Data Format Select whether or not to also save flag data (e.g. judgment results and ON/OFF state of I/O wires) at the same time. Operation Procedure 1. Display the [Logging] window and set the data format. Setting item Description Data is logged with information (e.g. I/O, states) appended to the measured values. The following information can be selected to the checkbox settings. Save Flag data (1) I/O terminal (ZERO, RESET, TIMING, LED-OFF) states (2) I/O terminal (BUSY, ENABLE, BANK) states (3) Judgment result (HIGH/PASS/LOW) states Not save Flag Only the measured values are logged. 2. When Save Flag data is selected, click the [Details] button and set the flag to save. Logging Start Start logging after you have finished setting up logging. Operation Procedure 1. Display the [Logging Standby] window and start logging. Setting item Description You can select the width of the horizontal axis of the graph according to the Horizontal axis of graph logging time. (Not plot, 1 s, 10 s, 100 s) [START] button [STOP] button [To Setting] button Starts sampling. Data collection is started, and Smart Monitor ZW stands by for the logging start trigger. Data collection is not started unless logging is started. For this reason, note that data will not be saved even if the logging start/end trigger conditions are satisfied. Logging is stopped regardless of the logging end trigger. Returns to the [Logging] window. 2. Stop logging. 3. Save the logging data. Save the logging data. The default save destination is the Log_Data folder in the Smart Monitor ZW installation folder. To Log the Shape for Each Detected Workpiece This is an example of data obtained by sampling for each workpiece (e.g. shape logging) at high speed. The following describes an example of how to log all measurement data for the duration that the timing signal is being input on a single Sensor Controller. Overview Settings list Logging Settings [Logging data] - TASK1 to TASK4 [Trigger target] TASK1 to TASK4 [Start Trigger] [Pattern of I/O] [OFF to ON]/ [ON to OFF] Select [OFF to ON]. [Checked I/O] TIMING [Trigger target] TASK1 to TASK4 [End Trigger] [Sampling Interval] [Pattern of I/O] - [OFF to ON]/ [ON to OFF] Select [ON to OFF]. [Checked I/O] TIMING - 1 ms (desired number of repeat loggings) [Sampling Stop conditions] [Repeat times] [Data Format] - - [Save data to another file.] Mark the "Assign number to automade file." checkbox. Not save Flag data When "Assign number to auto-made file." is set in the sampling stop conditions, a No. for each measured and detected workpiece can be assigned to the save data file. Switching Banks The present bank No. can be switched. Operation Procedure 1. Select the bank to be changed. 2. Click the [Yes] button. The bank is switched to the selected bank. Clearing Banks The bank settings of the currently selected bank are initialized (cleared) to their default values. Operation Procedure 1. Click the [Bank Clear] button. 2. Click the [Yes] button. The bank setting values are cleared. Copying Bank Copies a bank. Operating Procedure 1. Click the [Copy bank] button. 2. Select the copy source bank and copy destination bank. 3. Click the [OK] button. The bank is copied from the source to destination. Saving/Loading Bank Settings The following describes how to save and load bank settings. Procedure for Saving Bank Settings Save the settings of the bank group to the personal computer. 1. Click the [Save Settings] button. 2. Set the directory to save the file and set the file name, and click the [Save] button. The settings are saved. If you set a different file name, files can be saved as long as there is enough space on the personal computer's hard disk. Procedure for Loading Bank Settings The settings of a saved bank can be loaded to the controller selected at "OperatingCH" whenever needed. 1. Click the [Load Settings] button. 2. Select the file to load, and click the [Open] button. The settings are loaded. Only operation of files saved by [Save Settings] on Smart Monitor ZW or compatible controllers is assured. Data Folder The folder for saving graph data or logging to can be set. Operation Procedure 1. Select [Option(O)] - [Data Folder(S)] from the SmartMonitor ZW menu bar. 2. Set the folders for saving the various data. Changing Graph Background Color The background color of the graph window display can be selected from the following three colors: Standard Oscilloscope Blackboard When changing the background color of a graph, the graph window must be displayed. Operation Procedure 1. Select [Option(O)] - [Graph background color(G)] - [Standard(N)]/[Oscilloscope(O)]/ [Blackboard(B)] from the SmartMonitor ZW menu bar. Alignment of Windows The currently displayed windows can be aligned to the top of the window. When a window protrudes outside the screen and can no longer be displayed, this option allows you to redisplay the window in the screen. Operation Procedure 1. Select [Option(O)]-[Alignment of Windows(W)] from the Smart Monitor ZW menu bar. Selecting Connection Destination Specifies the IP address of the destination for a connection via Ethernet. Operating Procedure 1. Select [Option(O)] - [Select Destination(C)] from the SmartMonitor ZW menu bar. 2. Enter an IP address and click the [Set] button. The value will be effective when starting the system next. ROM Recovery This allows ZW controller to operate the sensor temporarily using the Calibration ROM data backed up in the internal memory, if the Calibration ROM broken or was lost. The Calibration ROM data stored in the internal memory can be overwritten. Operating Procedure 1. Select [Option(O)] - [ROM recovery(R)] from the SmartMonitor ZW menu bar. 2. Select a ROM data file to write into the controller and click the [Set] button. The ROM recovery cannot be run when the error window is opened. Before starting the ROM recovery, close the error window. Operation method: (1) With error code 3 displayed on the sub-display, press and hold the Mode switching key. (2) With "OK/CAN" is displayed on the sub-display, press the ZERO/SET key. (3) The measurement can be resumed using the Calibration ROM data read in previously. Cautions: When using this method, always check the Calibration ROM serial number read in previously in the "controller information" and check that it matches the Sensor Head side serial number. Measurement will not be correct unless they match. This operation is disabled for a controller into which no Calibration ROM has ever been inserted and started up. The ROM data file name format is [Sensor Head serial number].bin. Make sure that the serial number matches the one on the Sensor Head side. Measurement will not be correct unless they match. Settings List The settings of the controller can be verified in this list. Operation Procedure 1. Select [Info(I)]-[Settings list(D)] from the Smart Monitor ZW menu bar. Display measured values You can change a measurement result to any value by setting "Offset span input" for scaling. Sets an offset value and span value. Example: For the ZW-S20 Measurement center length : 20mm Measurement range : +/-1mm Operation Procedure 1. Open the [Function settings] window and click the [Scaling] button. 2. After selecting [New] and [Offset span input], click the [Execute] button. 3. Enter an offset value and span value. 4. Display measured values You can check the measured values after setting scaling on the main window and those before scaling on the sensing settings window, respectively. Example: When setting absolute value display Main Window Sensing Settings Window List of Error Messages At Startup Smart Monitor ZW is already started. Smart Monitor ZW is already started up. Another Smart Monitor ZW cannot be started up. Use Smart Monitor ZW that is already started up. Failed to read (write) the setting file. A probable cause is that reading (writing) of the Smart Monitor ZW setting file failed at program startup. Delete "Smart Monitor ZW" from [Control Panel]-[Add/delete applications], and install Smart Monitor ZW again. An error is in a setting of a COM port. The present communication port (COM*) is not effective. Either the target communication port does not exist on the personal computer, or it is being used by a different application. Either specify a different communication port, or quit the application that is using the communication port in question. A communication port does not open. Please end the application which uses a communication port and start again. A probable cause is that the target port is being used by another application, for example. Quit that application, and restart Smart Monitor ZW. Check the operating mode. The controller has been set to the FUN mode. A model not supported on this software is connected. Check the following: Make sure that the ZS Series is connected. Failed to communicate with the controller. Check the following items: Check the IP address of the connecting destination. Check the LAN cable connections. Check the controller has been turned on. If "SYSERR CODE3" is displayed on the controller, make sure that the Calibration ROM has been connected. If it is the case, make sure that the Calibration ROM has been inserted properly. If the error occurs when it is correctly inserted, the Calibration ROM or the controller may be broken. Please contact an OMRON branch or sales office. If error code 3 is displayed, as a temporary measure, you can restart measurement using the Calibration ROM data read in the previous time. Operation method: With error code 3 displayed on the sub-display, hold down the Mode switching key, then when "OK/CAN" is displayed, press the ZERO/SET key. Cautions: When using this method, always check the serial number in the "controller information" and check that it matches the Sensor Head side serial number. Measurement will not be correct unless they match. When restarting the main unit, perform the same operations again. This is disabled for a controller into which no Calibration ROM has ever been inserted. Common Please input a value. A value is not entered in the number entry field. Set a value. There is the possibility which the file to overwrite is under use. The file you tried to save as setting data or waveform data is in use by another application. Quit the other application, and either try to save the file again, or save it under a different name. An error is in the decimal point or the number of digit. The position of the decimal point or the number of digits you entered is in error. Enter number values in the specified format. Only numerical values can be entered. A text string other than a numerical value is entered in the number entry box. Enter numerical values. Communication error occurred. Check the following items. When this message is displayed, you can click the [OK] button and retry. If the retry does not solve the communication error, click the [Cancel] button, and quit Smart Monitor ZW. Is the Ethernet cable connected correctly? Is the controller in the RUN mode? The controller must be turned ON to use Smart Monitor ZW online. Smart Monitor ZW can be started up without a controller connected (i.e. in the offline mode). The input range is xxx to yyy. Entered value is out of range. The value entered in the number entry box is outside the specified range. Enter the numerical value again inside the minimum to maximum range displayed on the window. A path was not found. The specified folder path could not be found on the personal computer. Enter the correct folder path. The following characters cannot be used for a file name. Characters that cannot be used as file names were specified. Specify a different file name. There is no data to save. The waveform could not be saved as there is no waveform. Get the waveform and then save it. Graph The format of data is different. It cannot load. A probable cause is that the data of the file you tried to load is for a different type of data or that the data is corrupted. Specify the correct file data. Sensing settings/Function settings The setting of scaling cannot be changed. The entered data could not be scaled. Check input data ranges in the manual for the controller, and set the entered data again. The setting of monitor focus cannot be changed. Monitor focus could not be set for the entered data. Check input data ranges in the manual for the controller, and set the entered data again. The compensation parameters of analog output are unusual. The parameters for the entered linear output compensation mode are abnormal. Check input data ranges in the manual for the controller, and set the entered data again. OMRON Corporation Industrial Automation Company Authorized Distributor: Tokyo, JAPAN Contact: www.ia.omron.com Regional Headquarters OMRON EUROPE B.V. Wegalaan 67-69-2132 JD Hoofddorp The Netherlands Tel: (31)2356-81-300/Fax: (31)2356-81-388 OMRON ELECTRONICS LLC One Commerce Drive Schaumburg, IL 60173-5302 U.S.A. Tel: (1) 847-843-7900/Fax: (1) 847-843-7787 OMRON ASIA PACIFIC PTE. LTD. No. 438A Alexandra Road # 05-05/08 (Lobby 2), Alexandra Technopark, Singapore 119967 Tel: (65) 6835-3011/Fax: (65) 6835-2711 OMRON (CHINA) CO., LTD. Room 2211, Bank of China Tower, 200 Yin Cheng Zhong Road, PuDong New Area, Shanghai, 200120, China Tel: (86) 21-5037-2222/Fax: (86) 21-5037-2200 © OMRON Corporation 2012 All Rights Reserved. In the interest of product improvement, specifications are subject to change without notice. Cat. No. Z323-E1-01 212