1
NAVAL POSTGRADUATE SCHOOL
Monterey, California
THESIS
DESIGN, DEVELOPMENT, AND TESTING OF
AN
ULTRAVIOLET HYPERSPECTRAL IMAGER
by
Erik 0. Johnson
December, 1996
Thesis Advisors:
D. Geary
S.
Approved
Thesis
J5925
for public release; distribution
Gnanalingam
is
unlimited.
DUDLEY KNOX LIBRARY
NAVAL POSTGRADUATE SCHOOI
MONTEREY CA
93943-5101
REPORT DOCUMENTATION PAGE
Public reporting burden for this collection of information
is
estimated to average
1
Form Approved
OMB
No. 0704-0188
hour per response, including the time for reviewing instruction, searching existing data
sources, gathering and maintaining the data needed, and completing and reviewing the collection of information
other aspect of this collection of information, including suggestions for reducing this burden, to
and Reports, 1215 Jefferson Davis Highway, Suite 1204, Arlington,
(0704-0 88) Washington
1
and
to the Office
of Management and Budget, Paperwork Reduction Project
DC 20503.
AGENCY USE ONLY (Leave blank)
1.
VA 22202-4302,
Send comments regarding this burden estimate or any
Washington Headquarters Services, Directorate for Information Operations
REPORT DATE
3.
December, 1996
TITLE AND SUBTITLE
DESIGN, DEVELOPMENT,
REPORT TYPE AND DATES COVERED
Master's Thesis
5.
FUNDING NUMBERS
AND TESTING OF AN ULTRAVIOLET HYPERSPECTRAL
IMAGER (u)
AUTHOR(S) Johnson, Erik O.
6.
PERFORMING ORGANIZATION NAME(S) AND ADDRESS(ES)
.
8.
PERFORMING
ORGANIZATION
REPORT NUMBER
Naval Postgraduate School
Monterey CA 93943-5000
9.
SPONSORING/MONITORING AGENCY NAME(S) AND ADDRESS(ES)
10.
SPONSORING/MONITORING
AGENCY REPORT NUMBER
11.
SUPPLEMENTARY NOTES The views
official policy or position
12a.
13.
expressed
in this thesis are
those of the author and do not reflect the
of the Department of Defense or the U.S. Government.
DISTRIBUTION/AVAILABILITY STATEMENT
Approved for public release; distribution is unlimited.
ABSTRACT (maximum 200
12b.
DISTRIBUTION CODE
words)
A
This research involved the development of an ultraviolet (UV) hyperspectral imager.
hyperspectral image is a three dimensional image in which two of the dimensions provide spatial
information and the third provides spectral information. In an effort to minimize the cost of this
experiment, the NPS Middle Ultraviolet Spectrograph for Analysis of Nitrogen Gases (MUSTANG)
instrument was modified to fiinction as a hyperspectral imager. This required the design, fabrication,
and testing of hardware and software to coordinate the operation of a two dimensional, charge coupled
Control and synchronization of
device (CCD) detector with a servo-controlled scanning mirror.
(written in Borland C++) run
software
was
accomplished
by
scanning mirror and image collection
hyperspectral
imager are primarily in the
from an Intel microprocessor based PC. The benefits of a UV
principal
applications:
There are two
1) target
area of Support to Military Operations (SMO).
dual
use
has
Additionally, this instrument
identification, and 2) battle damage assessment.
hazards
applications, namely, 1) redirection of jet aircraft to avoid the foreign object damage (FOD)
presented by volcanic ash clouds through analysis of the absorption of solar UV radiation by the sulfur
dioxide (S0 2 ) gas associated with volcanic ash, and 2) forest fire detection.
SUBJECT TERMS Hyperspectral Imaging, Ultraviolet, Imaging Spectroscopy,
Remote Sensing, Dual Use, Support to Military Operations
14.
15.
16.
17.
SECURITY
CLASSIFICATION
OF REPORT
18.
Unclassified
SECURITY
CLASSIFICATION OF
ANSI
Std.
SECURITY
CLASSIFICATION OF
THIS PAGE
ABSTRACT
Unclassified
Unclassified
NSN
Prescribed by
19.
239-18 298-102
NUMBER OF
PAGES 70
20.
PRICE
CODE
LIMITATION OF
ABSTRACT
UL
7540-01-280-5500 Standard Form 298 (Rev. 2-89)
Approved
for public release; distribution
is
unlimited.
AND TESTING OF AN ULTRAVIOLET
HYPERSPECTRAL IMAGER
DESIGN, DEVELOPMENT,
Erik O. Johnson
Lieutenant, United States
B.S., University of
La Verne,
Submitted in
Navy
California, 1988
partial fulfillment
of the requirements for the degree of
MASTER OF SCIENCE IN APPLIED PHYSICS
from the
NAVAL POSTGRADUATE SCHOOL
December 1996
DUDLEY KNOX LIBRARY
NAVAL POSTGRADUATE
SrHnnr
001
MONTEREY CA
ABSTRACT
MWW^"
This research involved the development of an ultraviolet (UV) hyperspectral
A hyperspectral
imager.
dimensions provide
effort to
image
is
a three dimensional image in which two of the
spatial information
and the
third provides spectral information.
minimize the cost of this experiment, the
for Analysis
of Nitrogen Gases
NPS
In an
Middle Ultraviolet SpecTrograph
(MUSTANG) instrument was modified to
function as a
hyperspectral imager. This required the design, fabrication, and testing of hardware and
software to coordinate the operation of a two dimensional, charge coupled device
(CCD)
detector with a servo-controlled scanning mirror. Control and synchronization of
scanning mirror and image collection was accomplished by software (written in Borland
C++) run from an
Intel
imager are primarily
microprocessor based PC. The benefits of a
in the area
principal applications:
of Support to Military Operations (SMO). There are two
1) target identification,
and 2)
battle
damage assessment.
Additionally, this instrument has dual use applications, namely,
aircraft to
1)
redirection of jet
avoid the foreign object damage (FOD) hazards presented by volcanic ash
clouds through analysis of the absorption of solar
(S0 2 ) gas
UV hyperspectral
UV radiation by the sulfur dioxide
associated with volcanic ash, and 2) forest fire detection.
VI
TABLE OF CONTENTS
I.
INTRODUCTION
1
A.
OBJECTIVES
3
B.
THESIS OUTLINE
3
BACKGROUND
II.
A.
B.
C.
D.
III.
B.
C.
D.
V.
REMOTE SENSING
HYPERSPECTRAL IMAGERY
MOTIVATION FOR A UV IMAGING SPECTROGRAPH
MUSTANG DESCRIPTION
MUSTANG CONVERSION
A.
IV.
5
5
6
8
10
13
GRATING SELECTION
DETECTOR UPGRADE
SCANNING MIRROR INSTALLATION
SOFTWARE DEVELOPMENT
DATA COLLECTION
14
17
26
33
39
CONCLUSION
45
A.
SUMMARY OF FINDINGS
45
B.
RECOMMENDATION FOR FURTHER RESEARCH
45
APPENDIX
LIST OF
49
REFERENCES
57
INITIAL DISTRIBUTION LIST
59
Vll
Vlll
LIST OF ABBREVIATIONS
AMI
All-Reflection Michelson Interferometer
AVIRIS
Airborne Visible/Infrared Imaging Spectrometer
CCD
Charge Coupled Device
COTS
Commercial Off The Shelf
CsTe
Cesium
DUUVIS
Dual Use Ultraviolet Imaging Spectrograph
EDD
Electronic Digital Driver
FOV
Field
FUV
Far Ultraviolet
Hg
Mercury
IDL
Interactive
IFOV
Instantaneous Field
LSB
Least Significant Bit
MCP
MicroChannel Plate
MgF
Magnesium Fluoride
2
MOS
MSB
MTF
MUSTANG
Telluride
Of View
Data Language
Of View
Metal Oxide Semiconductor
Most
Significant Bit
Modulation Transfer Function
Middle Ultraviolet SpecTrograph
Gases
MUV
Middle Ultraviolet
NPS
Naval Postgraduate School
NUV
Near
OPD
Optical Path Difference
PSF
Point Spread Function
Pt
Platinum
TIFF
Tagged Image
UAV
uv
Unmanned
Ultraviolet
File
Format
Aerial Vehicle
Ultraviolet
IX
for Analysis of Nitrogen
X
INTRODUCTION
I.
Over
the past decade, advancements in remote sensors have led to an effective
technique for image data acquisition, namely, Hyperspectral Imagery (HSI). The HSI
process
is
a form of "imaging spectrometry" in which an image
contiguous wavelengths
to distinguish features
( 1
in
obtained at
many
00 or more spectral bands) with spectral resolution sufficient
of interest
resolution on the order of
is
1
-
(e.g.
molecular transitions in materials with spectral
2 nm). This technique generates a three dimensional image
which two of the dimensions contain
contains spectral information.
To
spatial information
date,
some 45
and the third dimension
hyperspectral sensor systems are either
deployed or under development. Most of these sensors detect radiation in the visible or
(400
far infra-red
them
nm
detect radiation
testing
of the
first
15 \xm) portions of the electromagnetic spectrum, and only 2 of
below 400 nm. This research involved the design,
mid
MUV to visible (200
(UV) imager
-
-
ultraviolet
(MUV)
fabrication,
and
hyperspectral imager built to operate in the
500 nm) region of the electromagnetic spectrum.
will extend the range of current hyperspectral imagers
This ultraviolet
and enhance existing
capabilities for exploiting the spectral signature of targets.
The
(FUV) (100
UV
-
spectrum can be divided into three regions, namely, the
200 nm),
MUV (200
-
300 nm), and near
nm). Atmospheric transmission of radiation
near
ultraviolet
in the troposphere in
far ultraviolet
(NUV) (300 - 400
both the middle and
UV regions, is mainly determined by scattering (Rayleigh and Mie).
in these
two regions
on wavelength.
is
relatively high for path lengths
up
to tens
In the stratosphere, absorption by molecular
complete extinction of radiation
in the
FUV
Transmissivity
of kilometers, depending
oxygen can
result in
over a distance of less than ten meters, again
depending on wavelength. Since our applications involve remote sensing,
transmissive property of radiation in the
instrument bandwidth to the
In the
NUV,
FUV
caused us to
restrict the
this
lower end of our
MUV.
solar radiation penetrates the earth's atmosphere providing natural
illumination. Radiation in this wavelength region
is
similar to visible light in that target
materials are identified by their reflectance spectrum. Although both the target and
1
background can be
many
relatively bright at these wavelengths,
materials experience
The advantage of operating
electronic transitions in this region.
in the
NUV is that each
transition observed aides in the unique identification of a specific material.
Most of the
Earth's surface
by the ozone layer
below the ozone
altitude
illumination.
layer,
at
still
false alarm.
structures.
It is
natural
sensor operating at an
background
MUV radiation existing between the ground and the
The combined
be appreciable.
sources of
artificial
A MUV
an altitude of 40 km.
favorable atmospheric transmission below
emanating from
prevented from reaching the
is
would observe almost zero
Propagation of any
ozone layer can
MUV region,
solar radiation in the
it,
effects
of the ozone layer and
allow for detection of weak target signatures
MUV radiation with an extremely low probability of
For example, fluorescent
common
lights are
in nearly all buildings
These lamps have a number of atomic Mercury emissions
in the
and
Middle UV.
possible that the scattering of this radiation near building openings such as doors or
windows, could be used
for
overhead detection of human
activity, or
even
battle
damage
assessment (BDA).
The
to
it's
interest in the blue-green (400
-
500 nm) region of the visible spectrum
favorable transmission properties in water. Figure
wavelengths between 380 and 500
i
i
i
i
|
I
i
I
i
[
nm
i
i
1
shows
is
due
that light with
have the lowest coefficients for both absorption
i
i
t
[
t
i
i
]
p
r
i
-r
—n
|-t
0.15
l
o
M
<—*
mrt>
*n
c
S
i\
1
10xa
j
/
-
£u
O
o
>-)
;--»>
JJ
|\\\
o
C3
OQ
n>
o
c
o
0.10
Oh
I
200
1
1
1
IT
300
!—-,
1
1
l__l
400
1
lllil.
1
-500
1
\-^\
1
1
600
.
o
0.05 3
,—
3
.I..I..I..1..L..L..L..I-.
700
Sr
\
0.00
v
r-
800
wavelength X (nm)
Figure
1:
Absorption and Scattering Coefficients vs. Wavelength for Transmission
in Pure Sea Water.
Taken From Mobley (1994).
and scattering
pure sea water.
in
and mine detection
To
This
is
extremely beneficial in the area of submarine
in littoral waters.
briefly recap, the
new NPS Mid Uv
hyperspectral imager would have a
bandwidth covering three principal regions with the following
1.
Mid Uv - overhead
2.
Near
3.
Short-wave Visible
UV
utilities:
detection of human activity /B DA.
observation of electronic transitions to aide in the unique
-
identification of specific materials.
submarine/mine detection
in littoral waters.
OBJECTIVES
A.
The
and
objectives of the research described in this thesis were to design, fabricate,
test the first
two principal
maximum
Mid Uv
hyperspectral imager.
namely, economy and
factors,
Design of the instrument was driven by
size.
Limited funding resources encouraged
of existing components. Thus, the
utilization
SpecTrograph
the
-
for Analysis
of Nitrogen Gases
NPS
(MUSTANG)
Middle Ultraviolet
instrument was chosen to be
backbone of the new design. Furthermore, additional components required
for
MUSTANG'S
conversion were selected from commercial off the shelf (COTS) items.
The
was imposed by
the
B.
size limit
NPS Unmanned
the ultimate goal of flying the instrument aboard one of
Aerial Vehicles (UAV)'s during subsequent research.
THESIS OUTLINE
This thesis
is
divided into five chapters and one appendix. The
introduction. Chapter
development of the
two provides the background information
NPS UV
NPS MUSTANG
MUSTANG into a UV hyperspectral
discusses the data collected by the
goal of this
by generating the
first
to
for the design
is
the
and
instrument. Details of the conversion of
imager are provided
new
for future design
work was
chapter
hyperspectral imager. These areas include an overview of
hyperspectral imagery and the
recommendations
first
in chapter three.
hyperspectral instrument. Conclusions and
improvements are contained
demonstrate the operation of the
UV hypercube.
Chapter four
One appendix
is
of the instrument control and data collection programs.
first
in
Chapter
five.
UV hyperspectral
The
imager
included which contains a listing
BACKGROUND
II.
This chapter provides a brief introduction to remote sensing and the progression
from early imaging techniques
example
it
to hyperspectral imaging. Additionally,
to provide motivation for
introduces the
development of a
it
uses an
UV imaging spectrograph.
Finally,
MUSTANG instrument which will be thoroughly investigated in
follow-on chapters.
A.
REMOTE SENSING
It is
often easier to observe measurable features of an item of interest from a
considerable distance rather than close-up.
a valley
itself.
For example,
it is
easier to construct a
map of
from an observation point high atop a mountain than from within the valley
In the early days of remote sensing, cameras were
kites) to obtain aerial
mounted on balloons (and even
photographs of the land below. The information gained from these
photos proved extremely useful in a variety of applications ranging from locating armies
to surveying
unexplored
territories.
The once mysterious Amazon River and
surrounding rain forest which was impervious to the advance of civilization,
charted and open for development as a result of aerial surveying.
improved, airplanes and
satellites
it's
is
now-
As technology
served as the host platforms for the sensing equipment.
Just as the host platforms improved, so did the sensors.
The
earliest
were bi-spectral
remote sensing images were black and white photographs.
in nature, that
is,
These
distinguishing features of an object were depicted by
varying shades of gray resulting from different combinations of black and white.
Information obtained through
somewhat
limited. This
is
literal interpretation
because the
human eye
of these black and white images was
is
a multi-spectral sensor which allows
us to recognize a multitude of colors through combinations of three spectral bands,
namely, red, green and blue. Unfortunately,
in its resolution
ten.
Since the
of shades of gray. At
initial
this
remarkable color sensor
best, a trained analyst
data obtained from remote sensors
was
is
rather limited
can only distinguish about
in the
form of photographs
which were interpreted by trained human
analysts,
it
was a
natural progression to develop
multi-spectral sensors.
Color images obtained from early multi-spectral sensors provided much more
information than their black and white predecessors. The next logical progression was to
UV and infrared (IR).
extend the sensor's range beyond the visible spectrum into the
Today's multi-spectral sensors have on order of
1
spectral
electromagnetic spectrum at various points between the
bands which sample the
UV and IR regions.
These are
considered to be broad band sensors since their spectral bands (or channels) are fairly
wide, ranging from a few tenths of a micron up to several microns. Images generated
from spectral bands outside the
the
human eye
to data
is
visible region
incapable of viewing
from those
can no longer be
to
Since
UV or IR radiation, false coloring must be applied
many
spectral channels. Additionally, there are
employ techniques of linear algebra
literally interpreted.
algorithms which
perform transformations on the data
in different
multi-spectral bands to enhance their signal to noise ratio. Various combinations of the
bands are then examined
until the characteristic
In addition to providing
of interest
is
exploited.
more information, increasing
the
number of
bands opened the door to an even greater range of applications such as
spectral
terrestrial
land
ecology, bathymetry, and geology. Green plants, for example, use chlorophyll to absorb
the visible light from the the sun, but reflect radiation in the
Near IR
(0.7
\xm
-
2.5 |Ltm).
Sensors operating in this bandwidth will record a significant increase in reflectance
around 0.7 u\m due
this
to the
same phenomenon
tanks,
is
presence of vegetation. Incidentally, a military application of
detection of camouflaged objects such as artillery installations,
and troops. Today, there are IR reflecting camouflage paints capable of deceiving
broad band multi-spectral sensors. However, these paints each have unique spectral
signatures
which could be exploited by an imaging spectrometer.
were designed with
B.
this
Hyperspectral imagers
type of application in mind.
HYPERSPECTRAL IMAGERY
As
previously mentioned, hyperspectral imagers
electromagnetic spectrum into
many
distinct,
split a
portion of the
contiguous, narrow channels
whose widths
are
on the order of a few nanometers or
less.
This allows for very precise spectral
signature discrimination which broad band multi-spectral imagers are incapable of
providing. Exactly which
signature analysis
is
is
method
is
employed
for conducting such a precise spectral
the basis of a great deal of ongoing research.
that literal interpretation
thing of the past. This
is
The general consensus
of remote sensing imagery by trained human analysts
not necessarily bad since
human
precision data which lends itself rather nicely to digital processing.
amount of information
a
interpretations are highly
subjective and not perfectly repeatable. Hyperspectral images contain a vast
the
is
amount of
An appreciation of
collected by a hyperspectral imager can be gained from the
hyperspectral cube provided in Figure
2.
This image was produced by Jet Propulsion
Laboratory's Airborne Visible Infra-Red Imaging Spectrometer (AVIRIS) instrument
during an August 20, 1992 overflight of Moffett Field on a
Figure
2:
NASA ER-2 plane at an
AVIRIS "Hypercube", Taken From JPL
7
(1994)
altitude of
analysis,
20
it
km
(65,000
Although the hypercube
ft).
is
contained in the x-y plane
information
is
contained in the z direction.
nm to
wavelength
1
.9
Two
the top of the cube),
(i.e.
AVIRIS
and
dimensional spatial
spectral
has 224 spectral channels ranging
2.5 |im. In Figure 2, spectral information
ordered such that the shortest
is
The two
the top of the cube and the longest wavelength at the bottom.
is at
solid dark lines traversing the lower half of the
|im and
not a desirable format for data
clearly illustrates the nature of a hyperspectral image.
information
from 400
is
cube represent the absorption of IR
u.m due to the presence of water molecules
in the
atmosphere. Note the
They
rectangular features located in the upper right corner of the cube's larger side.
represent a
marked response
in the red portion
of the visible spectrum (around 700 nm) to
the presence of one centimeter long brine shrimp residing in an evaporation
altitude
pond located
of the top of the cube. The ability to identify such minute features
in the far right corner
from an
at 1.4
of 65,000 feet boggles the mind, however,
this is
only the
tip
of the
iceberg regarding potential capability of a rapidly evolving technology.
C.
MOTIVATION FOR A UV IMAGING SPECTROGRAPH
Figure 3
atmosphere as a
illustrates the vast
result
Object
it
also
commands
Damage (FOD)
into the
of volcanic eruption during recent activity beneath Vatnajokull
While the eruption poses an immediate
glacier in Iceland.
inhabitants,
amount of volcanic ash introduced
threat to nearby land
the respect of aviators as the ash cloud presents a Foreign
hazard to gas turbine engines. Current procedure
is
to give the
ash cloud an extremely wide berth (sometimes entire continents are avoided). Large
savings in time and
money could be achieved through
the accurate identification (or
prediction) of the "safe" ash cloud perimeter.
In addition to the lava, ash,
etc.,
one of the products of a volcanic eruption
is
S0
2
In fact, a strong correlation exists between the presence of volcanic ash and the
concentration of
S0
2
.
This
is
evidenced by the data obtained from the Total Ozone
Mapping Spectrometer (TOMS), an instrument on board
satellite
[Krueger
et. al.,
1995].
Nimbus-7
in a polar
is
the
Nimbus-7 low
sun-synchronous
crosses the equator every 26 degrees of longitude at local noon,
8
earth orbiting
orbit.
That
is, it
making approximately
.
Hii.
1
•+ut&
«A^
-»-
*
'>•
-
:
4B 1^
*
^fc^5"
O '*P
**
J
•Ggr*
4fl
.
V
^*3e|M
'"3!
3:
October
1
"*''
f
Ctf
Figure
..-.*(
hS
-
Eruption Beneath Vatnajokull Glacier in Iceland. Taken
the Nordic Volcanological Institute (1996).
'96
From
13.7 orbits/day, thus observing the entire earth once a day.
instrument with six spectral bands ranging from 312
monitor ozone depletion by measuring the
ratio
nm
-
TOMS
380
nm
is
a multi-spectral
originally designed to
of back-scattered Earth radiance to
incoming solar irradiance representative of UV absorption by the ozone
of TOMS contiguous
absorptions in
its
spatial
mapping of the
shortest wavelengths due to
El Chichon eruption [Krueger
with
it's
earth in the
et. al.,
SO
:
Near UV,
in the volcanic
1995]. Since then,
it
As
a result
recorded strong
plume during
the 1982
TOMS has been monitoring S0
four shorter spectral bands (312.5, 317.5, 331.2, and 339.8
continuous record of volcanism.
layer.
nm)
to provide a
2
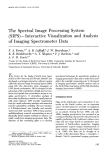
In the previous chapter, the
dual use instrument, meaning that
it's
it
NPS UV
imaging spectrograph was proposed as a
could support commercial applications in addition to
support to military operations. Providing accurate identification of safe ash cloud
perimeters for civilian aircraft as a result of S0 2 analysis
A strong portion of the S0
application.
see Figure 4 below. This
TOMS instrument.
is
2
is
285 nm) which
is difficult to
hyperspectral imaging system
Additionally, the proposed
is
NPS
minimum
example of such an
nm
down to 260 nm,
detectable wavelength of the
an overlap of the
the absorption systems of both ozone (300
nm -
a prime
absorption spectrum extends
well below the
Additionally, there
is
S0
2
absorption spectrum with
360 nm) and sulfur monoxide (SO) (250
-
discern with a multi-spectral instrument.
A
necessary in this situation to properly sort things out.
instrument
is
capable of actually being flown through an
ash cloud in an experiment designed to provide an accurate assessment of the exact
correlation
between SO, concentration and volcanic ash concentration.
S0&S02
!'
Absorption
Figure
D.
4:
SO and SO,
Absorption Lines. Taken From Pearse and Gaydon (1963).
MUSTANG DESCRIPTION
The
NPS MUSTANG
instrument
has been flown on three separate
is
a l/8th
NASA sounding rocket experiments to obtain
information on nitrogen gases in the ionosphere.
illustrated in
by a
Figure
5.
is
MUSTANG'S
major components are
Incident light enters the off-axis telescope where
series of baffles prior to striking a l/8th
telescope mirror
m Ebert-Fastie spectrograph which
focused onto a
5mm by
m spherical mirror.
140
10
|i,m vertical slit.
it
is
collimated
Reflected light from the
After passing through
1/3
[
™^-anra n
j
Mtr
Aptrtutf
Sohtticol Uurcx
_snaa3IS-- ^^
3c
UT»m-.»fa^TT^^..'t.-«HI.Mt».L,.l
Wrc'W
"
.1
»tf,-.'l..-.ft
SSil
1/8 Ifetf Sph!ri«i
Uiircr
>1«cto' tes*n*7
^Or*
Figure
the entrance
slit,
Crtfinq Uirroi
5:
MUSTANG Instrument.
the light
diffraction grating.
The
is
Taken From Atckinson
reflected off the 1/8
(1993).
m Ebert mirror onto a reflective, plane
grating separates the incident polychromatic light into
monochromatic components which
are directed back to the Ebert mirror
it's
and subsequently
focused onto the detector area in the exit focal plane. The instrument's original detector
was
a one dimensional Plasma-Coupled Device (PCD), a monolithic, self scanning linear
array of 512 p-n junction photodiodes.
intensity vs. wavelength.
With a 1200
ruling per
had a band pass of 135
1995].
A typical
MUSTANG'S
nm
at
MUSTANG'S
output was in the form of a plot of
spectrum of the instrument
is
shown
in
Figure
6.
mm grating and a 25mm detector aperture, MUSTANG
a spectral resolution of approximately
1
nm
[Geary
et. al.,
spectrograph provided 135 narrow spectral channels which would
be ideal for hyperspectral imagery
if
the instrument could be modified to produce a
dimensional image.
11
two
4DC"
300-
'55
c
'COH
!
f
-f
.
i
M
i/l'V
.
n
I
I
I
|
1
1
t
i
I
I
1
i
1
1
1
i
n
i
i
i
2000
2200
I
i
I
I
I
I
I
i
M
I
1
1
r
2600
v*
1
I
1 r
i
n
i r
I
I
1
|
1
1
i
I
i
I
I
I
2800
3000
3200
I
240C
I
i
1
1
r
'Wavelength (A)
Figure
6:
Typical Spectrum from
MUSTANG
(1994).
12
Instrument. Taken
From Hymas
III.
MUSTANG CONVERSION
NPS
In an effort to minimize the cost of developing the
decision was
made
to
modify the existing
MUSTANG instrument to enable
as an imaging spectrograph. Additionally, the stipulation
hardware purchased for the conversion had
approach
install
to the
problem was
to retrofit
hyperspectral imager, the
to
be a
COTS
was made
item.
that
Simply
to function
any new piece of
stated, the basic
MUSTANG with a two dimensional detector and
a scanning mirror at the entrance of the telescope. Since both focal length and
entrance
slit
would remain unchanged,
(IFOV)
MUSTANG
as
,
At any given
direction.
the
new
instrument,
(Dual Use
field
instant
of time, a "snapshot" taken with
As
illustrated in
"sliver" contains spatial information in the y-direction
Once a snapshot
in the z-direction.
DUUVIS would produce
Figure 7 below, each
and spectral information (from 135
is
stored, the scanning mirror is
repositioned to obtain the next adjacent sliver and the process
is
mirror has scanned through the entire field of view (FOV),
the slivers are
one image
file
transformation of
of view
namely, 2.3° in the vertical direction and 0.06° in the horizontal
a very narrow sliver of a hyperspectral image.
narrow channels)
DUUVIS
would have the same instantaneous
Ultra-Violet Imaging Spectrograph)
into
it
and the instrument
is
ready to begin
all
all
Grating selection
2.
Detector upgrade
combined
over again. The
MUSTANG into DUUVIS was comprised of
1
repeated. After the
four
main elements:
X
y
Figure
7:
Method
of Constructing a Hyperspectral Image with
13
DUUVIS
Data.
3.
Scanning mirror
4.
Software development.
installation
This chapter will elaborate on each of the aforementioned elements.
A.
GRATING SELECTION
As
DUUVIS
previously mentioned,
is
designed to operate in the
of the electromagnetic spectrum. Unfortunately,
visible portion
instrument to cover the entire spectral range from 200
and maintain the desired spectral resolution.
spectrograph
is
provided in Figure
8.
it
nm through
is
is
not possible for the
path through the
configured such that the
incident angle between the incoming light and the normal of the grating
phi
=
0.
The instrument bandpass
on the grating and the detector
detectable wavelength
maximum
is
that
it is
is
when
a function of the separation distance between rulings
which has an
that
no longer normal
minimum and maximum
9.1°
is
aperture. Detector position dictates that the
detectable wavelength
grating so that
is
UV through
500 run simultaneously
A sketch of the optical
The spectrograph
Mid
exit angle
which has an
of approximately
exit angle
of 20°.
1
minimum
0° and the
Rotating the
to the Ebert mirror causes the values
of the
detectable wavelengths to change. However, the width of the
bandpass remains roughly constant.
A more detailed description of this relationship is
20.0
Figure
8:
Optical Path Through
14
DUUVIS
Spectrograph.
provided below. Since the focal length of our instrument
separation distance between the rulings,
incident and diffracted wavefronts.
As
we assume
is
much
greater than the
the light rays to be parallel in both the
illustrated in
Figure
path
9, the total difference in
length between two incident rays of light after reflecting off adjacent rulings in the
grating
is
given by
d sin a + dsin (3, where d
is
the incident angle, and
to
an integral multiple,
and produce a spectral
n,
is
the separation distance between rulings,
When this
difference in path length
is
equal
of the wavelength of interest, the reflected rays will be
in
phase
is
|3
line
the exit angle.
of order
n.
At
all
other angles, there
destructive interference. Therefore, the diffracted
as prescribed
beams
is
some measure of
will only exist at the angles
(3„
by the grating equation:
rik
= dsin a - dsin (3„
n = order number of the spectral line of interest.
where:
X = wavelength of the spectral line of interest.
a = Incident angle of the incoming light onto the
P„ = Exit angle of spectral line of interest.
It
was previously
detectable wavelength.
stated that rotation of the grating determined the
How is that grating angle determined?
grating.
minimum
Suppose we
rotate the
grating normal
+
9:
-
incident
diffracted
wavetront
wavetront
dsin
dsin/J
Figure
a
a
Geometry of Diffraction. Taken From Milton Roy Company
15
(1994).
grating so that
a
define
to
normal
it's
be the incident angle of the incoming
=
the Ebert mirror, then 6
The
angle.
displaced by an angle
is
(f»
-a
<{)
while keeping
light
rik
rik
=
grating angle
= d[(sin
())
cos a
= d(2 sin $ cos a),
Since this
d[sin
(<j)
- a) + sin
((j)
= ty + a
Once
\.
(J)
is
solving for
(J)
dp
In our instrument,
a
is
known,
it
arrive at
=
ty
=
...
(j)
sin a)
-1
sin
"^
f
2
J
are dealing with first order spectra
fixed at 9.1014°, thus
necessary to obtain the desired
is
we
we
an Ebert monochromator,
minimum
we
can determine the
detectable wavelength from:
1
sin" [(0.5064)*;].
can be substituted back into the grating equation to find the
values for the corresponding
minimum and maximum
example, with a 1200 line/mm grating
and the instrument bandpass
is
at
135 nm.
detectable wavelengths.
an angle of 6.3°,
A,
m
j
n
= 193 nm, X max = 328 nm,
Setting the grating angle at 3.0°,
= 200 nm, X max = 476 nm, with an instrument bandpass of 276 nm. This
bandpass does not come without
cost.
instrument dispersion and entrance
slit
For
A significant increase in bandpass can be
achieved by installing a 600 line/mm grating.
Spectral resolution
is
other things, the grating ruling density. Reducing the
obtain
increase in
is
controlled by,
number of rulings by a
by a factor of two as well. There are three
plane diffraction gratings currently available for
DUUVIS,
and 2400 1/mm. This grating assortment allows
the instrument to a variety of applications.
we
controlled primarily by the
width. Instrument dispersion
factor of two causes a reduction in resolution
1/ram,
the exit
+ a)],
- cos § sin a) + (sin § cos a + cos
<j>
among
We
grating equation becomes:
substituting the proper trigonometric identities
^max
constant.
with respect to the optical axis of
represents the incident angle, and Q'e
nX = dsin 6, + dsin Q'e =
therefore n
a
Table
1
for
these include, 600 1/mm, 1200
extreme
provides a
flexibility in tailoring
summary of capabilities
based on grating ruling density. Note that the bandpass and resolution are subject to
16
change while the number of spectral channels (bandpass/resolution) remains
fairly
constant.
Two
the other,
gratings were utilized during this experiment, one had 1200 lines/mm and
600 lines/mm. The 1200 1/mm grating has a bandpass and resolution which
match well with the challenges of S0 2 analysis while the 600 1/mm
is
better suited for
rocket plume analysis.
Table
B.
Summary
1.
of Capabilities
Grating Density
Instrument Bandpass
(1/mm)
(nm)
7,600
276
2
1,200
135
1
2,400
64
0.5
Resolution (nm)
DETECTOR UPGRADE
The next
one-dimensional
economical
step in
PCD
MUSTANG'S
conversion was replacement of
it's
detector with a two-dimensional detector. Adhering to the
restrictions described earlier, the decision
which was already employed
in the
NPS
was made
to
adopt a detector
(AMI)
All-Reflection Michelson Interferometer
contained in a high resolution digital camera (the
[Hicks 1995]. This detector
is
EDC-1000HR) produced by
the Electrim Corporation and commercially available for
under $1000.00. This created two major challenges:
The
1)
necessity to marry products
from the spectroscopy community (one inch wide rectangular standard aperture) with
those from the photography community in which circular apertures are standard, and 2)
Ensuring that design requirements met the needs of both
DUUVIS
and
AMI
while
maintaining complete interchangeability between the two instruments.
The
at
detector
is
a charge coupled device
wavelengths between 400
between 200
nm
nm
-
1
(CCD) which
sensitive to visible light
100 nm. Since we're interested in wavelengths
and 400 nm, modifications were necessary
light into visible light for the
is
CCD.
(IIT) performs that task quite nicely.
to convert the incident
A commercially available
Image
The image
proximity focused
intensifier is a
channel intensifier tube with dual microchannel plates.
It
Intensifier
was manufactured by
UV
Tube
BV
Delft
Electronische Producten (DEP) located in Holland. The basic intensifier consists of a
17
quartz input window, a photocathode, two microchannel plates, a phosphor screen and a
A quartz window is used to allow UV
fiber-optic face plate for output.
detector since glass
is
opaque
at
Mid
UV wavelengths.
light to enter the
Incident light encounters an S-20
photocathode which converts incident photons into electrons. S-20, the name of the
coating on the photocathode,
which,
among
photocathode
is
made from
others, contains cesium, potassium,
is
compound known
a multi-alkalide
sodium and antimony. The S-20
sensitive to light with wavelengths
between 200
Primary electrons emitted by the photocathode are directed
(MCP)
assembly. Figure 10
The
is
an
illustration
as Suprasil
nm
to the
of a microchannel
and 520 nm.
microchannel plate
plate.
MCP is comprised of millions of glass capillaries (channels) with an inner
diameter of approximately ten (im. Each tube acts as an independent photo-multiplier.
An electric
potential
(+6000 Vdc)
is
established across the
MCP as seen in Figure
11.
Incident primary electrons collide with the capillary walls and strip off electrons from the
glass in the process.
These secondary electrons are accelerated by the difference
electrical potential across the
capillary walls
and
strip
off
MCP.
more
approximately 15,000 electrons
in
Accelerated secondary electrons collide with the
electrons, etc.. This cascading of electrons results in
at the
output of the
MCP for every single electron
emitted by the photocathode. The amplified electron
beam
is
subsequently focused onto
an aluminum screen coated with P-43 luminescent phosphor causing
it
to fluoresce
^CHANNELS
Figure 10:
MCP Construction.
Taken From Hamamatsu Photonics
18
(1985).
CHANNEL WALL
PRIMARY
ELECTRON
ELECTRODE
OUTPUT
ELECTRONS
---I
From
Figure 11: Electric Representation of Electron Amplification. Taken
Hamamatsu Photonics (1985).
thereby emitting photons with wavelengths between 535
nm to
555 nm. Photons are then
directed to the output of the IIT via a 25 millimeter diameter fiber-optic faceplate
preserves the spatial order of the image. The incident
visible light within the
The
CCD's
which
UV light is thus converted into
sensitivity range.
CCD utilized in the digital camera is a TI-241chip
?
manufactured by Texas
Instruments, which consists of a two dimensional array (753(H) x 244(V) pixels) of
closely spaced metal oxide semiconductor
(MOS)
capacitors. Incident photons
energies which exceed the bandgap energy of the silicon material of the
MOS
have
capacitor.
This causes them to be absorbed by the semiconductor material resulting in the formation
of an electron-hole
pair.
Electrons are collected in energy wells generated by each of the
MOS capacitors when their gates are positively biased (i.e.
during the integration portion
of the operation cycle). The amount of charge collected
each of these "packets"
in
proportional to the total integrated light flux incident upon an individual
is
MOS capacitor
during the measurement period [Wilson and Hawkes, 1989]. "Read out" of the charge
packets
is
accomplished by sequentially reversing the bias on the capacitors thereby
transferring the stored charge from the
the vertical shift registers
which
period, each charge packet
is
image columns (exposed
are shielded
from incident
to incident radiation) to
radiation.
During the scan
sequentially transferred from the vertical shift registers to
19
the horizontal shift (readout) register to be processed
by the computer as shown
Using an analog-to-digital (A/D) converter, the output
12.
signal and
used for display or storage
is
in a
tagged image
is
Figure
in
transformed into an 8
file
format
(
TIFF
)
file
bit
for
further analysis.
MUSTANG had a circular aperture IIT very similar to the one previously
described.
However, the one dimensional nature of it's detector did not require any
optical consideration.
The 25
mm diameter of the IIT matched quite well with the one
inch horizontal width of the linear array allowing the fiberoptic output
to
further
be directly mated to the face of the
PCD detector.
In the case of DUUVIS,
necessary to focus the two dimensional image produced by the 25
mm
window of the
it
IIT
became
mm dia. circular
mm rectangular sensing area of the CCD.
aperture IIT
down
onto the 8.67
In the initial
AMI
configuration, a high quality fiber-optic taper with a demagnification
ratio
of
1
.6 is
by 6.59
used to transfer the image
to the
1 1
millimeter cross-diagonal face plate of
Interline transfer
vertical shift
registers
x*:
image column
:v:i
m
|:
:?:
I
Video out
horizontal shift
Figure 12:
CCD Data Output Circuit.
20
Taken From Walters,
(1990).
CCD chip.
the
Unfortunately, the tapered fiber-optic bundle generated an intolerable
amount of distortion
for the
AMI
application due to
it's
demagnification process.
Electro-optical Services Inc. located in Charlottesville,
manufacture an optical coupler between the IIT and
added
our challenge.
to
MUSTANG'S
VA, was
CCD. Now,
direct coupling
the
contracted to
COTS
between IIT and
requirement
PCD made
for a
very compact detector assembly. Since the instrument was used in sounding rocket
experiments,
13).
As
MUSTANG'S
designers were pretty stingy with
a result, there wasn't
much
it's
real estate
clearance between the back of the off axis telescope
and the detector assembly. Naturally, we desired the overall length of the
detector assembly to remain consistent with that of
to build a
new telescope.
consideration for the
new
DUUVIS
MUSTANG in order to avoid having
Unfortunately, the commercially available lenses under
optical coupler possessed focal lengths
matching detector assembly lengths and fabrication of lenses
to
which precluded
meet
were simply cost prohibitive. There were other considerations as
mapping of the IIT be
(See Figure
that requirement
well.
fully contained in the detector or vice versa (i.e.
Should the
should the circle
be contained within the rectangle or the rectangle be contained within the circle)? At that
time, the
AMI
mapping
to
experiment was in
full
swing so we decided on the
maximize the resolution of the
Figure 13: The
"circle in a square"
fringes observed with the
MUSTANG Instrument:
AMI. Figure 14
Telescope, Spectrograph, and Detector
Assembly.
21
illustrates the
the
geometry of the mapping
1
.
Once
the
mapping geometry was determined,
most challenging dimension became the length of the reduced radius section
front
at the
end of the lens coupler assembly. The focal plane of the instrument was located
0.151" from the rear face of the spectrograph. There was only 0.564" clearance between
the back of the grating and the rear face of the spectrograph. This implied the front of the
lens coupler casing could not extend over 3/8 of an inch
for positioning
window
Assuming a
front
focal plane to allow
of the grating. Ideally, the photocathode should have been positioned
the focal plane. In reality, the focal length
entrance
beyond the
to the
(i.e.
the distance
in
from the outer surface of the
S-20 coating) of the photocathode was 0.250" +/- 0.050".
minimum
1/16" (0.0625" +/- 0.005")
of the casing, the worst case scenario was
would extend 0.519" beyond the
thickness for the retaining lip on the
that the front
focal plane. This
0.045" (less than 1/16 of an inch).
would
of the lens coupler casing
clear the
back of the grating by
Figure 15 contains a block diagram of the lens
ecu
Window
Figure 14: Coverage of CCD Input
Device.
While
this decision
Window by
Taken from Hicks
was optimal
for
AMI,
22
it
Image From the Lens Coupling
the
(1995).
was
less than optimal for
DUUVIS.
LfK* CCWLLC
f— StANSAflO
'CROSS-HATCHCD «JC*>
I
-D£P7H DC Pi-crotATfKTC
(SAME AS RRCSCOT)
r-vCI CftKc&i EGX
42IK
Figure 15: Block Diagram of the Lens Coupler Assembly.
coupler assembly. Inspite of the close tolerances, and after numerous phone calls and
facsimile exchanges, an acceptable detector assembly
Upon
arrival
of the
new detector assembly,
was delivered
in
the next challenge
November
was
to
1995.
mount
it
onto the spectrograph while preserving the integrity of the off-axis telescope. This was a
rather delicate operation.
which,
when
A mounting clamp was designed consisting of two half shells
bolted together, provided support for the lens coupler in addition to
providing a means for attaching
the Physics
it
to the spectrograph.
The clamp was manufactured by
Department Machinist and subsequently, the painstaking process of fitting the
lens coupler with the telescope began.
The mounting clamp, located
DUUVIS
at the
detector assembly,
difference between the
is
tear
of the
top of Figure 16 which illustrates the size
MUSTANG and DUUVIS detector assemblies.
telescope and lens coupler were
much
shown
at the front
made of aluminum with
Both the
fairly thin wall thickness.
If too
metal was removed from any given area, the section being reduced would begin to
and the
integrity of the
component would be
violated.
An
iterative cycle
of
disassembly, machining, reassembly, and measurement was implemented to ensure just
23
Figure 16: Comparison of DUUVIS and
enough metal was removed from the
precise
fit
to a tolerance
telescope and the
of 0.001 ".
DUUVIS
MUSTANG Detector Assemblies.
right places.
An
The
result
of this process was a very
appreciation of the close
fit
between the
The
detector assembly can be gained by viewing Figure 17.
shiny ring in the middle of the lens coupler was originally a knurled adjustment ring
similar to those found
on telephoto
lenses.
When the
telescope could no longer be
machined, the coupler was disassembled, the ring removed and machined. Putting a
knurled finish on the ring subsequent to machining would require
tight in the
chuck of the
lathe that
solution to this problem
was
inserted without risking
damage
it
might
result in
to cut longitudinal
damage
to
be clamped so
to the internal threads.
The
grooves in the ring. They could be
to the internal threads
and
still
provide enough texture to
grip onto while adjusting the focus of the lens coupler assembly.
24
it
Figure 17: Comparison of Installed
MUSTANG (top) and DUUVIS (bottom)
Detector Assemblies.
25
C.
SCANNING MIRROR INSTALLATION
Several possibilities were considered for control of the scanning mirror. Initially,
a motor and
cam assembly was
envisioned for positioning the mirror, then the possibility
of making the mirror shaft out of two-way shape
memory NiTi
was considered. Neither of these designs provided
application.
Due
the accuracy required for this
to the position accuracy requirement
was
slewing, a servo-controlled mirror assembly
and potential need for high speed
finally chosen.
scanner, a high speed galvanometer designed for advanced
commercially available from General Scanning
alloy (sexy technology)
Inc.
beam
M3
The
series optical
positioning,
proved worthy of the
scanner uses a "moving-magnet" design which enables
it
to
move
at
task.
M3
The
high speed over wide
angles (total range of +/- 30° of travel) with precise angular positioning. Additionally, the
M3
maintains the low inertia rigidity and temperature control of moving iron devices
while retaining the low inductance of a moving coil
Watertown,
unit.
General Scanning, located in
MA, was chosen based on their outstanding reputation
for high quality
scanning components and their twenty five plus years of experience in the
field.
Again, financial limitations added to the challenge. Our budget did not allow
purchase of the complete system with
chassis. Instead,
we purchased
the
mirror, an electronic digital driver
all
M3
necessary electronics contained in a Eurocard
galvanometer, a
(EDD) with
MgF
2
coated
(UV
sensitive)
backplane, and a six foot cable (for
connecting the galvanometer to the backplane), with the understanding that
have to furnish power to the
Y mirror and M3
EDD and provide the computer interface.
galvanometer are provided
in
"Y"
Figure
18.
we would
Dimensions
While awaiting
arrival
for the
of the
scanner components, computer interface requirements were identified. Control of the
M3
scanner
(PC)
to the
signal
is
accomplished by sending a
EDD. The EDD
1
6 bit binary word from a personal computer
then converts the digital input signal into an analogue output
which repositions the galvanometer. General Scanning provided guidance on
selection of a compatible digital input/output (I/O) card for the
programming suggestions
(written in
C++)
computer as well as some
for galvanometer control.
26
20nn
Y
RCfLEClIVE SURTACE
2208
(5532)
1.384
C35J5)
1.152
(29265
c
"
5
-:oo
>
3X98 [6.345]
.2495 [6337]
|//|0003A|
«2.42±..76]"~]
1.000
REFERENCE DIAMETER
1
l2j,:-02d
r
1
[31
36±.02
2.66*. 12
I
{34.544.51]
[67.56*3.05]
ll
.25
75± 25]
T~
jm
2.00
[so.ea±.2S]
Figure 18:
^
Y Mirror (top) and M3
Galvanometer (bottom) Dimensions, Taken From
General Scanning (1992).
PCDI048-P
After thorough study of the sample General Scanning code, a
dual
channel digital I/O board was purchased from Industrial Computer Source in San Diego,
CA. The PCDI048-P
contains two Intel 8255A-5 programmable peripheral interface
integrated circuits (IC's) designed for use with Intel microprocessors
Intel
and
486DX2/50
is
In this
microprocessor).
The 8255 has 24 I/O
mode, Ports
C
is
A and B
in
Table
is
basic I/O.
comprised of two 8-bit words.
A passes the low order byte.
decimal value of 1797 passed to the 8255 from a
shown
0,
used for control of the 8255. Each of the 8 pins (or channels) assigned to
passes the high order byte and port
voltages
Mode
are utilized for transferring a 16-bit (2 byte) binary word,
an I/O port can be toggled individually. The 16-bit word
B
uses an
pins, constituting 3 I/O ports,
capable of several modes of operation. Our application calls for
while Port
Port
(DUUVIS
2.
27
C program would
For example, a
result in the output
Table
2.
Example of PCDIO-48P Signal Transfer
MSB
1797=
Port Address:
0000
B7
A0
PIN
VOLTAGE
NUMBER
(Vdc)
A
A
A
A
A
A
A
A
the factory to set
1
2
movement
5
5
3
4
5
6
7
DUUVIS
are driven
by two
to
A
factors, the horizontal
CCD to collect the image.
216 (65,536). This implies
total arc
word allows us
that the
of travel
M3
is
minimum
60/65,536 degrees or
minimum
increments in the
at
increment of
yields 20/65,536 degrees or 5.3 (irad. Actual positioning of the mirror
bit
to
galvanometer was tuned
arc of travel to +/- 10°. Recalculation of the
be in one mrad increments which translates to 188
The
mrad, pause, save the image,
1
16 bit binary
did not require 60o of rotation so our
it's
5
+
+
7
increment of movement for a scanner with a 60°
DUUVIS
+
6
and repeat through the desired horizontal FOV.
16 p.rad.
5
5
scan cycle would be to step the mirror
express integers ranging from
+
3
(1.12 mrad), and the exposure time required for the
DUUVIS
5
4
Scanning requirements for
typical
+
1
2
B
B
B
B
B
B
B
B
IFOV
0101
A7
BO
PORT
LSB
0000
0111
would
C program
controlling mirror position.
Upon
receipt of the scanning equipment, several additional
fabricated. First, an adapter
had
to
be designed to house the
M3
components had
to
be
scanner and allow for
mating with both the telescope and the sun shade. The adapter was designed to position
28
the scanning mirror at a 45° angle to the optical centerline of the telescope. This
minimize the vignetting
casing dictated that
it
of the scanning mirror. The height of the galvanometer
effect
should be mounted on top of the adapter. Figure 19 shows the
configuration of the scanning mirror adapter
Figure 19 reveals a seam
galvanometer
barrel.
when
fully assembled.
in the adapter at the base
The scanning mirror
is
Close inspection of
of the cylinder which houses the
wider than the diameter of the galvanometer
necessary to remove the top of the adapter to attach the scanning mirror
barrel
making
to the
galvanometer
it
would
shaft.
This
The next items needed
is illustrated
to
more
clearly in
Figure 20.
be fabricated were a chassis to mount the
EDD and
backplane, and ribbon cable to provide the connection between the 50 pin I/O connector
on the PCDI048-P and the input
in the student
to the
EDD. The
chassis,
shown
workshop out of excess material from discarded
in
Figure 21, was made
items.
ribbon cable was modified to make the connections shown in Table
A standard
3.
Figure 19: Scanning Mirror Adapter Completely Assembled.
29
50 pin
Figure 20: Scanning Mirror Adapter Partially Disassembled.
Figure 21:
EDD Chassis with
30
Backplane.
Table
Signal
Name
3.
PCIO
48 to
8255 Port
EDD Wiring List
PCDI048
Address
Pin#
DO
BO
31
Dl
Bl
29
D2
D3
D4
D5
D6
D7
D8
D9
D10
B2
B3
B4
B5
B6
B7
27
D12
D13
D14
D15
Al
A2
A3
A4
RESET
STROBE
RD/WR(DIR)
+ 5Vdc
GND
17
AO
47
CI
Al
45
C2
C3
C4
C5
C6
C7
C8
25
21
19
43
41
39
37
35
CO
15
CI
13
C2
C3
C4
C7
C5
11
N/A
N/A
49
to
9
C13
C14
C15
C16
7
NOT USED
A10
A12
1
5
C32
A32
50
Table 3 seem
listed in
J
Pin#
Al
23
Although the wiring requirements
accomplishment of the task proved
Backplane
A2
A3
A4
A5
A6
A7
A8
A2
A3
A4
A5
A6
A7
Dll
PI
pretty straight forward,
be non-trivial. Jl and J2 on the backplane are 96
pin connectors, configured as 3 columns of 32 rows, with the center column not used. The
backplane only had a female connector for
EDD plugs
into the
32.
No
to plug in a 90° connector (if
clear the backplane.
The
M3
connect the
EDD and the backplane.
There
one were even available) into PI and
isn't
still
Scanner/Driver User Manual furnished by General Scanning
does not contain a schematic of the
to
.
backplane so as to form a "T". This leaves approximately 1/4 inch of
clearance between the male connector (PI) on the
enough room
connector was provided for Jl The
EDD,
EDD to a digital I/O card.
nor does
it
outline a detailed procedure
Initially, this
1
on how
caused considerable amount of
confusion as to the function of Jl. Time was growing short and no 96 pin female
connectors were locally available, so ingenuity was forced to take control. Pin extenders
were made by soldering IC socket pins (See Figure 22) onto female connectors from a
standard 25 pin "D" connector. The extenders were insulated with heat shrink tubing and
slipped onto the appropriate pins of PI. Proper alignment of the
to
EDD with the backplane
allow the 25 pin extenders to pass through the correct holes on the backplane required
a significant
amount of patience. Once
the
the chassis served to lock the pins in place.
EDD was mated with the backplane the top of
Female socket connectors were then soldered
onto the appropriate leads on the ribbon cable. Each of the ribbon cable connectors was
Figure 22: Pin Extenders for
EDD Connector PI.
then insulated with heat shrink tubing, labeled, and attached to the appropriate pin of Jl
The
M3
last
items to be acquired were power supplies. Power requirements for the
scanner are identified in Table
4.
EDD Power Requirements
VOLTAGE
CURRENT
+ 18Vdc
1.5 A @ continuous
3 A peak
-18Vdc
1.5 A @ continuous
3 A peak
+ 5Vdc
1.5 A Max.
Table
4.
Three Hewlett Packard power supplies, two HPE3615A's and one HP6216B, were
obtained and a connector cable was fabricated to plug into J5 on the backplane.
was completely assembled.
32
DUUVIS
The
final
system including
in
DUUVIS
EDD,
configuration
is illustrated in
backplane, PC, power supplies, and associated cabling
Figure 24. As mentioned previously, the closest thing
M3
D.
Figure 23. The entire
Scanner/Driver User Manual
is illustrated
to a
DUUVIS
is
shown
schematic available in the
Figure 25.
SOFTWARE DEVELOPMENT
With
DUUVIS
completely assembled, the only missing ingredient was the
software to coordinate the operation of all
effort required to
accomplish
DUUVIS
experiment. If
is
this task
to operate
individual components.
it's
was by
on a
far the
The amount of
most underestimated aspect of the
UAV in future experiments,
it
must be able
to
function autonomously. This requires "hands-off operation after initiation of a master
program. As previously mentioned,
all
the individual
DUUVIS
components are
advertised as being capable of operating in this manner. Unfortunately, there are
subtle barriers that are not readily apparent until the individual
many
components begin
to
interact.
The
principle of operation
is
simple enough. After the desired
FOV
has been
determined, the main program slews the mirror over to one end and begins to step
through the
FOV
in
mrad increments. At each
1
incident radiation for the appropriate
disk as a
this
TIFF
file.
The cycle
step, the detector is
amount of time,
after
which
it
exposed
to the
stores the
repeats for each step through the entire
FOV.
it
image
to
In practice,
process would continue until the entire area of interest were imaged. For the sake of
simplicity, this discussion will only address one
attempt to minimize
of a program
in
C++
start
up time
for the instrument, this effort
for instrument control. This
with the equipment manufactures since most
Saving the
files in
sweep through the
TIFF format
array for data analysis
is
PC
was
entire
FOV.
In an
pushed the development
the easiest path to compatibility
application software
is
written in C.
for subsequent compilation into a multi-dimensional
a cumbersome method of operation. That bridge will have to be
crossed at a later time. The numerous bugs which surfaced during this experiment
precluded software development beyond successful control of the instrument. The actual
program "MSCNSCAN.C",
is
provided in the Appendix.
A general
overview of the
Figure 23: Final
Figure 24:
DUUVIS with
DUUVIS
Configuration.
Associated Support Equipment.
34
f o
Figure 25:
S
J^
*"'
V-.
EDD Backplane Wiring Schematic. Taken from
General Scanning (1992)
program and some of the problems encountered during
development are discussed
it's
herein.
There are three primary components which must successfully interact for
DUUVIS
namely, the
to function,
digital I/O card, the
camera. Program development was aimed
them
prior to incorporating
The
into the
component addressed was
first
PCDI048
which,
scanner, and the digital
conquering each component individually
main program.
previous section, control of the mirror
the
at
M3
the digital I/O card.
As mentioned
accomplished by passing a 16
is
in turn, delivers a digital signal to the
EDD card.
bit
in the
binary
word
to
In decimal values,
represents the limit of travel in one direction (+ 10°), 32,768 represents the center of
travel (0°),
and 65,536 represents the
PCDI048
Operation of the
300 hex. Addition of a
respectively.
To
0, 1,
set the
This sets only the
MSB
PCDI048 from
is
of travel in the opposite direction
pretty simple.
The base address of the I/O card
for
is
C
the 8255, add a 3 to the base address and send an 80 hex.
of the control register of the 8255
mode
operation with
program automatically
the
10°).
(-
or 2 to the base address provides access to Port A, B, or
mode on
which configures the 8255
to the
Mode
in
limit
all
HIGH
with
other bits
all
LOW
output ports. Every word passed
results in a corresponding digital signal
being sent to the backplane through the ribbon cable.
Once
the digital signal
directed to read
it
and convert
is
it
present at Jl of the backplane, the
to a position
command. This
direction
toggling the strobe. Refer to the timing diagram in Figure 26.
triggered control signal.
that value for the rest
digital signal is sent
When STROBE
through
D15 and
Now
position,
problems
it
the
At program
over
goes
DO
HIGH
through
RD/WR is
their cameras.
STROBE
achieved by
a leading edge
is
set
is
D15
again, the
(Port
B and
Port
A respectively,
EDD reads in the new digital
all
signal
pins).
on
DO
new position command.
converts
it
into a
program
is
able to control the position of the scanning mirror.
must obtain an image and subsequently
arise.
is
LOW (WRITE) and remains at
Strobe (Port C, pin 7)
set LOW before a new
start,
of the program.
EDD must be
store
it
to disk. This is
At each
where the
real
Electrim Corporation furnishes several programs to facilitate the use of
However, they keep the source code
36
for manipulation of the
CCD
itself
Ji SCripl .0:1
Symbol
CojieoI Setup
Data, S«tjp
Strobe-
TCVSL
TDVSK
Cor-trol
TSLSH
TSHCX
TSHDX
T5HCC
Hold
Baa Ho Id
DACc«dc
NOTE
Address Scaip
iiKnl.:.i
Typ,
Mill
Unit!
LO
_
.
nS
2Q
I'M
20
:oo
-
_
-
.
.
.
.
.
-
S
-
nS
nS
nS
nS
^S
l«
tfnei
Mdt.
idsitica] 10 ficse ot Ceacira-] Jincg.
• /
AI-A4
>
:HCV
TSLSH
SHT'>:
TDViH
X
r
SC-'DIJ
>
/ /
ALD
TSHCC
EDC-
- '
/-
OUT
Figure 26: Bus Write Cycle Diagram. Taken from General Scanning (1992).
proprietary.
their
programs
format.
files
They do provide "Linkable Routines" which allow
to
for slight modification
perform a variety of functions including saving images to disk
The functions
called out
by the linkable routines are contained
in
TIFF
in various object
(furnished by Electrim) which have already been compiled in Microsoft
C
The
8.0.
C
source code for control of the scanner was written in Borland C++. That version of
was chosen because
it
contains the outportb
command which was
Scanning's sample program for scanner control. After
many
compiling and linking, the incompatibility of Borland
C++ and
insurmountable obstacle. There was no
way
and the linkable routine for writing TIFF
utilized only
one
file
name
as
it
to
files
was designed
of
referenced in General
painful hours of self study in
Microsoft
C became
an
determine Electrim's function protocols,
would never
to terminate
suffice as written, since
upon successful image
it
storage.
After successfully writing a routine for generating sequential filenames, a copy of
Microsoft Visual
files.
C++ Ver.
One minor problem,
_outp
command had
to
1.52c.
Visual
was obtained
C++
to
be compatible with the Electrim object
doesn't contain the outportb
command
so the
be used for sending binary words to the digital I/O card.
17
"MSCNSCAN.C",
listed in the
in stepping the scanning mirror
Appendix,
is
the
program which
finally
proved successful
through a scene while collecting an image
file at
each
position increment along the way. Results obtained with this program are provided in the
following chapter.
38
IV.
Two UV
source lamps were used to conduct
mercury (Hg) lamp with
and a platinum
340
nm
(Pt)
is illustrated in
grating installed in the instrument.
Comparison of the
illustrate the
The
some of the
Figure 27, a
be the strong
Figure 27:
nm to
is
80
nm
and
unknown.
spectral features
static
of the source
image taken with the 1200
spectra along the bottom of the image
image
330 nm. Also, the bright
Hg emission at 254 nm.
DUUVIS
1
In this image, the two source lamps are
spectral features contained in the
estimated value of 195
254 nm,
two-dimensional property of the
is
that
to those
nice correlation of the Pt spectra leading us to believe the bandpass
to
is at
a
A wavelength calibration has not yet been conducted on
detector in addition to exploiting
separated in height.
DUUVIS,
which
thus the exact correlation between pixel and wavelength
lamps themselves. This
1/mm
of
5 spectral emission lines, the strongest of
However, the images contained herein do
DUUVIS
initial testing
hollow cathode lamp with 23 spectral emissions between
[Hymas, 1994].
DUUVIS,
DATA COLLECTION
Figure 29
"Snapshot" of Pt and
39
is
line
of the Pt lamp.
of Figure 28 show a
is
fairly close to the
above the Pt spectra, appears
an image of the same scene with
Hg Lamp
Spectra taken on 02
DEC 96.
-6C0-
500-
r V
2
r-"
400
30C -
200-
ri
f
,
!< *
vgw
800
200C
22C0
24C0
?*00
Figure 28: Platinum Hollow Cathode
Figure 29:
DUUVIS
i/'
u
23C0
Lamp
"Snapshot" of Pt and
40
1
w
!^v^/^agj[as
J000
Spectra.
Hg Lamp
32C0
34C0
Taken from Cleary
Spectra taken on 04
(1996).
DEC 96.
the
600 1/mm grating
In the left
installed.
The
pattern to that of Figure 27.
two
thirds
of the image
images presented
is
have been
problems curtailed progress
in the area
A feel
hyperspectral cube to display.
gained through Figure 30 a thru
for the
are observing
and 480 nm. So
far,
the
previously mentioned, software
of data analysis. As a
To
o.
As
static.
nm
image are
we
If this is true, then
approximately between 190
in this section
observe a similar
bright lines in the right one third of the
believed to be in the visible portion of the spectrum.
a spectral bandpass which
we
result, there is
no
dynamic properties of DUUVIS may be
actually scan through a 2.5°
FOV
would require
88 "snapshots". In Figure 30, 15 consecutive snapshots are presented thus
illustrating
the scanning capability of the instrument. For this image, a slight separation distance
introduced between the source lamps in both the horizontal and vertical directions.
DUUVIS
page)
we
scans through a 0.9°
FOV
observe a very strong
Hg
fade out around frame "g" and
signature continues to
grow
is
(moving from
signature in the
first
it
to
As
bottom on the
The Hg begins
few frames.
completely gone by frame
stronger until
and top
left to right
was
to
In similar fashion, the Pt
"i".
peaks out in frame "o".
All the images presented thus far have been in the form of vertical spectral lines.
Although
this is quite
normal
in spectroscopy,
not very desirable for imaging
A simple test to obtain a feel for the instrument's point spread function
applications.
(PSF) was conducted by positioning the
the entrance of DUUVIS' sun shade.
holes where poked through
it.
observed a vertical spectral
line
realized this
it is
is
Hg lamp approximately two
A shroud was placed over the
Initially,
we observed no
meters away from
lamp and two pin
difference, that
is,
we
still
even from a point source. After some consideration,
a property of an "off-axis" optical instrument.
appreciable distance off of the optical axis (as
is
When
the case in the
an object
DUUVIS
lies
we
an
spectrograph),
the incident cone of rays originating from that object strike the lens asymmetrically. This
causes an aberration
there are
two
known
as astigmatism. See Figure 31. In an off-axis instrument,
distinct focal lengths
focal plane of our instrument
illustration) in
which the
is
which cause the cone of rays
to
become
the tangential focal plane (represented by
ellipse degenerates into a line. This explains
41
elliptical.
FT
why
The
in the
our simulated
d
f
e
1.
Figure 30: Pt and
Hg Lamp
Spectra Obtained During
on 08
DEC
42
96.
DUUVIS
:
II
Scan of 0.9°
iK
FOV
-
taken
Circle of Icasi
contusion
Figure 31: Illustration of Astigmatism. Taken from Hecht (1987).
point source appeared as a line on the detector. Again, this
is
good
for spectroscopy but
doesn't lend itself to imaging.
Seeking improved performance, the mounting clamp for the lens coupler
assembly was loosened and the
spectrograph) in an attempt to
entire
move
assembly was moved back (away from the
the photocathode behind the tangential focal plane.
shown
in
Figure 32. The point spread function was
clearly reduced but further adjustment
is
necessary.
The
result
of this adjustment
is
43
Figure 32:
DUUVIS
"Snapshot" of a Simulated
09
DEC
44
96.
Hg
Point Source taken on
V.
A.
CONCLUSION
SUMMARY OF FINDINGS
The main objective of the research described
and
fabricate,
test the first
in this thesis
MUV hyperspectral imager.
was
to design,
Design began with the
NPS
MUSTANG instrument. MUSTANG'S one-dimensional detector was replaced with a
two-dimensional image intensified
optical coupler to
detector area.
As
map
the
CCD. The new two-dimensional
image from a
circular aperture IIT
a result of the optical coupler, the
new
down
onto a rectangular
detector assembly
length of it's predecessor. Great care was taken in mounting the
preserve the integrity of the existing off-axis telescope.
detector required an
new
was twice
the
detector assembly to
A servo-controlled scanning
mirror was then mounted to the front of the telescope. Budget constraints required design
and fabrication of a chassis
to
house the control circuitry for the scanning motor
addition to design and fabrication of special cabling to connect the
card. Three
power supplies were acquired
EDD to the digital
to provide the proper voltages to the
I/O
EDD.
A
of the instrument was written and compiled in Microsoft Visual C++.
program
for control
The
successful operation of DUUVIS occurred
first
in
compatibility problems between Borland
C++ and
on 08
DEC
Microsoft
C
96. Unforeseen
8.0 resulted in schedule
delays which precluded extensive testing of the instrument. The only data obtained by
DUUVIS
B.
to date is spectra
from two calibrated
UV source lamps.
RECOMMENDATION FOR FURTHER RESEARCH
There are two categories of software development associated with
this effort;
software for control of the instrument, and software to enable analysis of the data after
has been collected.
initial
Numerous problems encountered during
the
it
development of the
instrument control software, precluded any progress toward data analysis. In this
experiment,
it
was necessary
for instrument-control software to
be developed
first in
order to obtain a working instrument. Approaching the problem from the opposite end
might prove
to
be more productive. The premiere software on the market for analysis of
45
hyperspectral imagery
the Interactive Data
devices.
ENVI.
a very powerful software package that
It is
Language (IDL). IDL has the
to
files to
an
ENVI
file
efficiently if
is
it
could continuously
TIFF and subsequently
vice store each snapshot as a
make an image. There
written in
is
capability to control peripheral
The instrument would operate much more
download data
combine
is
potential for very productive research in this
area.
Before
it
can provide useful data, the instrument must undergo a wavelength
calibration. Additionally, the scanning mirror
determine
it's
FOV
This
performed on the instrument prior to
These three items could easily work
initial
to precisely
at the center position.
Finally, sensitivity tests should be
UAV flight.
must be bore sighted
it's first
into a thesis.
was conducted on a
cut at building a hyperspectral instrument
shoestring budget. There are several aspects of the design which were accepted mostly
An example
because there was no other alternative.
intensifier
image down onto the
detector.
of this
Another example
is
the
mapping of the
the scanning mirror
is
selection. Ideally, a larger mirror is desirable to eliminate vignetting.
currently installed in the instrument
manufacturer offered with a
conducted to determine
current design and at
(UV
was one of only two mirror
sensitive)
MgF
how much improvement
what point does
it
2
coating.
a compact
power supply needs
to
which the
A trade off analysis
should be
could be gained by upgrading the
become advantageous
instrument from the ground up based on lessons learned from
least,
sizes
The mirror
to design a
new
DUUVIS. At the
be manufactured for the instrument
bulky laboratory type power supplies currently in use prior to
DUUVIS's
very
to replace the
first
UAV
flight.
Finally,
now that we have
an instrument which extends the spectral range of the
hyperspectral imagers currently in operation, there should be a schedule for frequent data
collection. In the grand
scheme of things
volcanic ash cloud. There are
many
DUUVIS
is
working
it's
opportunities right here in our
shouldn't be overlooked, such as rocket
plume spectra over
46
at the
way towards
own back
NPS
a
yard that
rocket engine test
facility.
the
400
A
nm
trip to the
to
500
beach might prove interesting to see
nm portion
how well DUUVIS
of the visible spectrum. Even in the
lab,
more
performs
tests
should
be conducted to determine the optimum positioning of the photocathode to minimize
aberrations associated with off-axis optics.
47
in
48
APPENDIX
49
50
/*
Erik O. Johnson */
/*
1 1
/*
Program Name:
DEC
96
*/
MSCNSCAN.C
*/
/*
*/
/*This program controls the operation of DUUVIS through one complete
*/
FOV.
commands
*/
obtained from the
/*
scan through
/*
htfsamp.c program provided by Electrim Corp. to save images to disk
/* in
TIFF
/* the
it's
format.
It
It
contains
also contains the basic I/O functions required
Electronics Digital Driver
(EDD)
to control the
galvanometer for
DUUVIS'
/*
pages 44 thru 48 of the
/*
Scanning Inc. Detailed descriptions of the functions called out in
/* this
scanning mirror.
M3
*/
by
/*
based upon the sample code
*/
Scanner/Driver Users Manual by General
*/
listed
*/
program are contained in the M3 Scanner/Driver Users Manual and
source code for htfsamp.c. This program was compiled in
Microsoft Visual
C++
*/
*/
*/
Ver. 1.52.
/*
/*
*/
on
It is
/* in the
/*
*/
*/
SCENE SCAN FOR MICROSOFT VISUAL C++
*/
#include <stdio.h>
#include <stdlib.h>
#include <conio.h>
#include <dos.h>
#include <malloc.h>
#include <math.h>
#include <string.h>
MefineBASEl 0x300
//
#defineDEV 0x000
#define
A 0x0
#define
B 0x1
C 0x2
#define
//
Base address of IO board
for
scanning mirror interface
#define P 0x3
#define
BASE
(Ox
//
//
V
#define H
#define
Base address of camera
must match camera address
(244)
//
Lines per field
(753)
//
Bytes returned per line
51
#define
KEYBOARD_CHECK
#defme
DEF AULT_EXPOSURE
(!0)
(
1
OOL)
//
100 millisecond exposure
#define BiasValue (127)
//
mid
#define GainValue (175)
//
2/3 scale of gain range
typedef unsigned char pixel;
//
one byte per pixel
//
field is a pointer to
//
array of pointers
typedef pixel
//
far
*
int
cdecl
highcaml (unsigned
_cdecl
far
int, int, int, int, int,
unsigned long
void _cdecl
cdecl
int,
unsigned
cdecl
converter
initialize
int,
unsigned
int);
//
set bias
D/A
converter
//
set
gain
D/A
converter
far
unsigned short
int
write_TIFF(char
cdecl
*,
int,
cdecl
unsigned
int);
far
unsigned
int,
unsigned
int, field,
unsigned
unsigned
int,
unsigned
int);
//save
int.
unsigned
image as a
int,
tiff file
far
set_ch_mode();
HIGHCAM1
int
D/A
//
far
cdecl
unsigned
int);
int);
SetGainValue (unsigned
void
800 x 600
far
SetBias Value (unsigned
void
to
far
InitDAC (unsigned
void
vga
// init
display image (field, unsigned
void
int, field, int);
far
init800 (void);
//
an
Linkable Routines Function Prototypes:
unsigned short
int
far *field;
scale of bias range
//
set
VGA to character mode
argument definitions:
base =
BASE;
//
52
base address of camera
unsigned long
exposuretime =
//
DEFAULT_EXPOSURE;
far* buffer [V];
pixel
//
//
DISPLAYJMAGE argument definition:
//
Each
//
line is displayed to the screen twice to give
exposure time value in milliseconds
for
EDC- 000HR
1
exposure control
image buffer
488
lines total.
Define storage for display buffer line pointers:
pixel
//
//
far* display_buffer[V*2];
//
display buffer pointers
//
numbers
Define the passing parameters
unsigned
int
AspcrXN, AspcrXD, AspcrYN, AspcrYD;
unsigned
int
FV, FH;
//
height
for aspect ratio
& width of the tiff image
void _cdecl
main(void)
{
void startup(int);
void shutdown(int);
void galvo_send(unsigned
void
int);
clrscr();
char image_name[12], *duvis, *strl, *str2 = ".tif, *fname;
double eoj_counter;
keyboard_check, ndig =
int dec, sign,
unsigned
int
int ctrlport,
MINPOS, MAXPOS,
i,
j,
0;
ILength, IWidth, position, retCode;
refresh_flag, ab_flag, interlace_flag, field_flag;
long counter;
//
MINPOS=3 1452.0;
//
MAXPOS= 34460.0;
MINPOS=24576.0;
MAXPOS= 40960.0;
eoj_counter = 100.0;
position=32767.0;
ctrlport=(B ASE 1 +(DEV«2)+P);
startup(ctrlport);
for(position=32767.0; position>MINPOS; position=position- 188.0)
{
galvo_send(position);
for(counter=1.0; counter<50.0; counter++)
{}
}
for(position=MINPOS; position<MAXPOS; position=position+188.0)
{
galvo_send(position);
//
Flags:
=
refresh_flag
ab_flag
=
!0;
!0;
interlace_flag
field_flag
=
=
disables
//
disables anti-blooming
!0 for interlace
//
0;
0;
the return code
is
for first frame,
!0 for
=
of saving the
initialize the return
//
file
code
number of lines to display
number of pixels to display
//
Width = H;
duvis
second frame
!KEYBOARD_CHECK;
ILength = V*2;
I
mode,
interlace
//
for checking the status
retCode=99;
keyboard_check -
mode
// if
//
//
RAM refresh
//
//
"duvis";
eoj_counter++;
strl
= _fcvt(eoj_counter.
&dec, &sign);
ndig,
strcpy(image_name, duvis);
strcat(image_name,
strl);
strcat(image_name,
str2);
InitDAC
(base);
//
call
only once at
SetBiasValue (base, BiasValue);
//
call to set bias
SetGainValue (base, 255
//
call to set
//
-
GainValue);
start
voltage
gain voltage
Allocate the image buffers:
for (i=0; i<V; i++)
{
if((buffer[i]
=
far *) calloc ((size_t)
(pixel
=
(pixel
_far
*)
NULL)
cprintf ("\n\n\rCannot allocate
exit ((char) -1);
}
H, sizeof (pixel)))
{
memory
for buffer !\n\r");
}
Build display buffers from image buffers:
for(i=0,j=0;i<V;i++,j+=2){
display_buffer[j] = display_buffer[j+l] =
//
54
buffer[i];
}
if (init8000)
// init
{
cprintf ("\r\nVESA
exit(l);
//
mode
VESA mode
1
03
103 not supported by display adapter!\r\n");
}
Read
for (i=0; i<4;
800 x 600 by 256 color
i
the
camera and display image:
= ++i
//
% V)
Read
the
{
camera (ignore keyboard
interrupt):
highcaml (base, refresh_flag, ab_flag, interlace_flag,
field_flag,
exposure_time, buffer, keyboardcheck);
display_image (display buffer, ILength, IWidth);
//
Set the
}
VGA to character/text mode
set_ch_mode();
image as a TIFF
//
Save the
//
Assign values to the parameters of write_TIFF before passing
last
file
FV=244;
FH=753;
AspcrXN=753;
AspcrXD=4;
AspcrYN=244;
AspcrYD=3;
//
buffer
is
already defined, buffer will be loaded by highcaml procedure
fname=image_name;
write_big_TIFF proc
//
for
//
filename, tif extension
//
in the filename is necessary.
retCode=write_TIFF(fname, FV, FH, buffer, AspcrXN. AspcrXD,
AspcrYN, AspcrYD);
//
print the return
code
cprintf ("\r\nThe return code
for (i=0; i<V; i++)
{
free(buffer[i]);
}
55
is
%d \r\n",
retCode);
for(position=MAXPOS; position>32766.0; position=position- 188.0)
{
galvo_send(position);
for(counter=1.0; counter<50.0; counter++)
{}
}
shutdown(ctrlport);
return;
}
/*
end of main
*/
void startup(int ctrlport)
{
int
modeOout,
cport, x_vvrite;
mode0_out=0x80;
_outp(ctrlport, mode0_out);
cport=(BASE 1 +(DEV«2)+C);
x_write=0x0a;
_outp(cport, x_write);
_outp(cport, (x_write
/*
|
set
RD/WR to
0x80));
/*
write
(LOW)
set strobe inactive
*/
(HIGH)
*/
return;
/*
}
*/
end of startup
void shutdown(int ctrlport)
1
int
modeOin;
mode0_in=0x9b;
_outp(ctrlport, mode0_in);
return;
}
/*
end of shutdown
*/
void galvo_send(unsigned
int position)
{
x_write;
int aport, bport, cport,
aport=(B ASE 1 +(DEV«2)+A);
bport=(B ASE 1 +(DEV«2)+B);
cport=(B ASE 1 +(DEV«2)+C);
x_write=0x0a;
& 0x7f));
_outp(bport, (position & Oxff));
_outp(aport, ((position & 0xff00)»8));
/*
set strobe active
/*
send
LS Byte
/*
send
MS Byte
_outp(cport, (x_write
/*
set strobe inactive
_outp(cport, (xwrite
|
0x80));
return;
}
/
end of galvo_send
*/
56
(LOW)
*/
*/
*/
(HIGH)
*/
LIST OF REFERENCES
Atkinson,
D. IV, "Implementation and use of a computational ray-tracing program for the
J.
design and analysis of complex optical systems", Master's Thesis, Naval Postgraduate School,
Monterey, California, (1993).
Cleary, D. D., Private Conversation, (1996).
Cleary, D. D., S. Gnanalingam, R. P.
ultraviolet
dayglow spectrum,"
Electrim Corp.,
Inc.,
M3
(AMI)
F.
G. Eparvier, "The middle
.
,
(1992).
Photonics, Characteristics and Applications of MicroChannel Plates (1985).
.
.
J.
and
Technical Manual (1992).
Scanner/Driver User Manual
Hecht, Eugene, Optics 2nd
Hicks,
Dymond
F.
Geophys. Res., 100, 9729-9739, (1995).
J.
EDC-100QHR Computer Camera
General Scanning
Hamamatsu
McCoy, K.
ed.,
Addison- Wesley Publishing Co., Menlo Park, CA, (1987).
D., "Design, development, and testing of the All-reflection Michelson Interferometer
Naval Postgraduate School,
for use in the mid-ultraviolet region", Master's Thesis,
Monterey, California, (1995).
Hoist, G.
C,
Electro-Optical Imaging System Performance
.
SPIE Press and JCD Publishing,
Winter Park, FL, (1995).
Hymas, H. M., "A
calibration of the
and a analysis of the Oil 2470
C
Naval Postgraduate School middle
ultraviolet spectrograph
emission obtained by the middle ultraviolet spectrograph",
Master's Thesis, Naval Postgraduate School, Monterey, California, (1994).
Industrial
Jet
Computer Source, Model PCDIO
Series Product
Manual (1995).
.
Propulsion Laboratory, "AVIRIS in a nutshell", ftp://ophelia.jpl.nasa.gov/, (1996).
Klein,
M.
V., T. E. Furtak, Optics
Krueger, A.
J.,
.
2nd
ed.,
John Wiley
&
Sons,
New York,
L. S. Walter, P. K. Bhartia, C. C. Schnetzler, N. A. Krotkov,
Bluth, "Volcanic Sulfur dioxide measurements from the total ozone
instruments",
J.
Geophys. Res., 100, 14057-14076, (1995).
Milton Roy Company, Diffraction Grating Handbook 2nd
.
57
ed., (1994).
(1986).
I.
Sprod, and G.
J.
S.
mapping spectrometer
Mobley, C. D., Light and Water. Radiative Transfer
in Natural
Waters Academic Press
.
Inc.,
New York, (1994).
Nordic Volcanological
Pearse, R.
Sons,
W.
Richards,
Springer- Verlag,
Samson,
J.
.
ed.,
(1996).
John Wiley
&
(1963).
A.,
J.
"NORDVULK Home Page", http://www.norvol.hi.is/,
A. G. Gaydon, The Identification of Molecular Spectra 3rd
B.,
New York,
Institute,
Remote
New York,
Sensing
Digital
Image
Analysis.
An
Introduction
.
2nd
ed.,
Sons,
New
(1993).
A. R., Techniques of
Vacuum
Ultraviolet Spectroscopy
.
John Wiley
&
York, (1967).
Walters, D. L.,
Wilson,
J., J.
PH4050
F. B.
Class Notes, (1990).
Hawkes, Optoelectronics. An Introduction 2nd
.
ed., Prentice Hall,
New York,
(1989).
Wolfe,
W.
L.,
G.
J.
Navy, Washington,
Zissis,
DC
The
Infrared
Handbook Office of Naval Research, Department of the
.
(1978).
58
INITIAL DISTRIBUTION LIST
1
Defense Technical Information Center
8725 John
Ft.
2.
J.
Kingman
Rd.,
STE 0944
Belvoir, Virginia 22060-6218
Dudley Knox Library
Naval Postgraduate School
411 DyerRd.
Monterey, California 93943-5101
3.
Dr.
Anthony A. Atchley, Chairman
PH
Physics Department
Naval Postgraduate School
Monterey, California 93943-5002
4.
Dr. D. D. Cleary,
Code PH/CL
Physics Department
Naval Postgraduate School
Monterey, California 93943-5002
5.
Dr. S.Gnanalingam,
Code
PH/GM
Physics Department
Naval Postgraduate School
Monterey, California 93943-5002
6.
LT
Erik O. Johnson
592 Belden Ave.
Camarillo,
C A 93010
59
DUDLEY KNOX LIBRARY
NAVAL POSTGRADUATE SCHOOl
MONTEREY CA
93943-5101