1
Validate: A Workflow for Evaluating the Performance of
GWAS/QTL Tools Using Known-Truth Datasets
Ann Stapleton, Kurt Michels, and Dustin Landers
University of North Carolina Wilmington
Abstract
Understanding the effectiveness of Genome-Wide Association
(GWAS) and Quantitative Trait Loci (QTL) analytical tools
under various situations is crucial to deciding which tools are
best given a particular problem. Validate provides a way to return classification and regression performance measures for large
amounts of tool outputs generated using known-truth simulations.
We also provide solutions for aggregating hundreds or thousands
of outputs in to a single folder on the iPlant data store, so that
Validate can be used.
Contents
1 Introduction
3
1.1
About the Developers . . . . . . . . . . . . . . . . . . . .
3
1.2
Why Validate? . . . . . . . . . . . . . . . . . . . . . . . .
3
1.3
Getting iPlant Credentials . . . . . . . . . . . . . . . . . .
4
1.4
Getting Your Application on an API . . . . . . . . . . . .
4
1.5
Where Can I Get These Softwares? . . . . . . . . . . . . .
4
1.6
How to Use This Manual
4
. . . . . . . . . . . . . . . . . .
2 Running Simulations
6
2.1
How To Run Simulations with rPlant . . . . . . . . . . . .
6
2.2
Using rPlant to Sample From Your Known-Truth Data Sets
9
3 Aggregating with Aggregate
10
3.1
How to Use the GUI Aggregate Tool . . . . . . . . . . . .
10
3.2
How to Use the Aggregate Function in rPlant . . . . . . .
16
3.3
How to Use Aggregate on Atmosphere . . . . . . . . . . .
16
4 Validating with Validate
4.1
How to Use Validate on the DE . . . . . . . . . . . . . . .
16
16
5 Visualizing the Validation
2
20
5.1
How to Use the Demonstrate R Package . . . . . . . . . .
20
5.2
How to Use Demonstrate on the DE . . . . . . . . . . . .
20
5.3
How to Use Demonstrate on Atmosphere
20
. . . . . . . . .
6 Acknowledgements
20
7 How to Interpret Performance Measures
20
7.1
AUC . . . . . . . . . . . . . . . . . . . . . . . . . . . . . .
20
7.2
H. . . . . . . . . . . . . . . . . . . . . . . . . . . . . . . .
20
7.3
KS . . . . . . . . . . . . . . . . . . . . . . . . . . . . . . .
20
7.4
TPR . . . . . . . . . . . . . . . . . . . . . . . . . . . . . .
20
7.5
FPR . . . . . . . . . . . . . . . . . . . . . . . . . . . . . .
20
7.6
Accuracy . . . . . . . . . . . . . . . . . . . . . . . . . . .
20
7.7
MAE . . . . . . . . . . . . . . . . . . . . . . . . . . . . . .
20
7.8
RMSE . . . . . . . . . . . . . . . . . . . . . . . . . . . . .
20
Validate: A Workflow for Evaluating GWAS/QTL Tools
1
1.1
Introduction
About the Developers
Project Lead and Principal
Investigator
Dr. Ann Stapleton works at the interfaces, such as the junctions between
research and teaching, individual research projects and large collaborative projects, the organization of international meetings and high-school
teacher inquiry labs. Most recently, she has worked at the interface between plant biology and software engineering, leading the way to broad
methods applicable to evaluating genotype-to-phenotype analytical methods.
Statistical Analyst and
Developer
Dustin Landers received a BS from Appalachian State where he learned
a lot about survey research and using statistics to solve problems and
answer questions. He continued his education at UNCW by studying
Applied Statistics. Moving from world of polling and survey statistics
to the that of Big Data, he has an interest in bridging the gap between
statistics and software engineering and seeing the combined discipline
brought to bear on problems once considered impossible.
1.2
Why Validate?
To test known-truth data sets, we originally weren’t sure of the best way
to approach the problem. We had the idea of using ROC plots. We
wanted to look at true positive rates, false positive rates and accuracy.
Of course, this was never really feasible because any one simulation run
could be atypical, and all of these methods could only analyze a single
simulation run. We asked ourselves how could we run lots of simulations
through a tool, and test the outputs in a way that gave us insight in to
the performance of these GWAS and QTL tools?
We decided that in order to allow lots of simulations to be tested, we
needed a method that that allowed iterations over hundreds or even thousands of simulation-runs. This birthed the idea of Validate, which is a tool
that returns these sorts of measures of tool success for massive amounts
of outputs.
Validate: A Workflow for Evaluating GWAS/QTL Tools
3
But how do we run all these simulations? How do we store them all in a
single location so we can calculate these measures? How do we visualize
them?
These are the problems we sought to solve. For each problem, we have
our own solution. We also left them divided. This way you can decide
whether to use our solution or to use your own if you have a unique
scenario.
1.3
Getting iPlant Credentials
1.4
Getting Your Application on an API
1.5
Where Can I Get These Softwares?
1.6
How to Use This Manual
Evaluating a GWAS/QTL tool with Validate is essentially four major
steps after your application is installed on either the iPlant Foundation
API or the Agave API:
→ Section 2
1. Running the Tool With Simulations As Inputs. This step
involves deciding what simulations to use and then iterating over
those simulations and submitting them as job requests through the
API. We recommend using some sort of scripting method that you
are comfortable with. At this point, we don’t have a standalone
application for submitting jobs. We use rPlant, which is freely
available R package that allows you to connect with iPlant’s API
layer to submit job requests.
→ Section 3
2. Aggregating the Outputs into a Single Folder. This part
is a bit of a logistical exercise. You need to put all the tool outputs (from Step 1) that you want to be analyzed using the same
known-truth metadata in to aggregate folders. For example, say
we are using simulations that are generated using varying levels of
heritability. Since the varying heritability values in essence produce
different SNP effects, we need to essentially run Validate three separate times. Validate requires an input on an entire folder, and
then iterates over those tool outputs. So the first step here, is to
decide how many different runs we need to do and then create that
many folders. We provide a GUI tool, Aggregate that allows you to
select files from multiple folders on your iPlant data store (multiple
runs of a single tool) and move those (or aggregate them) in to a
single folder.
→ Section 4
3. Running Validate on the Aggregated Folder. Once you have
all your outputs in aggregated folders. You can simply log in to the
iPlant Discovery Environment and run Validate on that folder. You
must have at least two columns with header names in the outputs:
The name of the SNP column, and the name of threshold column
(such as P-value). Further, if you wish the get back effect size
estimation errors, you must also know the column on the estimated
effect size column (for example, PLINK’s is BETA). Text files with
known SNPs and effect sizes must also be included. Once you
submit Validate, you will receive a notification when it is completed.
The Validate output will be columns of performance measures for
each tool output.
4. Running Demonstrate on the Validate Output. Finally, once
you have outputs from Validate (which may be more than one), you
→ Section 5
4
Validate: A Workflow for Evaluating GWAS/QTL Tools
need to combine them and test the differences in your measures between your simulation’s parameters. Demonstrate is an R package
(to be installed on the iPlant DE) that quickly combines all your results files in a folder you specify and returns sciplot factorial graphs
for parameters you specify. It also returns the combined results file
so that you can perform your own analyses.
Validate: A Workflow for Evaluating GWAS/QTL Tools
5
2
2.1
Running Simulations
How To Run Simulations with rPlant
Step 1-A) Install R and rPlant
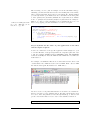
We will first show you how to batch run simulations with rPlant. First,
we are using the latest R version, 3.0.2. When you open the R console, it
should look something like this (we are using a Mac, so yours may look
slightly different, but it will function essentially the same).
If you haven’t already installed rPlant, we recommend that you do that.
After that, you need to validate your iPlant credentials so that you can
access your simulation files. Then, you will need to get a list of the names
of your simulations files and iterate over them in a for loop, submitting
jobs to your installed application.
Step 1-B) Consider the strategy you want to use. Do you want
to use all your known-truth data sets, or just a sample? And if
a sample, should you take a stratified sample?
6
Validate: A Workflow for Evaluating GWAS/QTL Tools
→ These are mainly just example codes. Although you are
welcome to copy ours.
The following code is to just an example of how the submission may go
assuming your known-truth data sets are in something like a raw format,
where each known-truth data set is stored in a single file. rPlant assumes
you already include your iPlant data store username in the files path,
so that ”iplant/home/username/simulations” is just written as ”simulations” or ”iplant/home/username/analyses” is just written as ”analyses”.
This is, of course, because validating your credentials allows you to not
have to keep typing you user information over and over again.
>
>
>
>
>
+
i n s t a l l . packages ( ” rPlant ” )
require ( rPlant )
V a l i d a t e ( ” username ” , ” password ” )
mydir <− L i s t D i r ( ” s i m u l a t i o n s ” )
f o r ( i i n 1 : nrow ( mydir ) ) {
SubmitJob ( j o b . name=NULL,
a p p l i c a t i o n=” myGWASapplication ” ,
+
f i l e . path=” s i m u l a t i o n s ” , f i l e . l i s t = l i s t ( mydir [ i , 1 ] ) )
+
print ( i )
+ }
Step 1-C) Find out the name of your application on the API,
and the inputs required.
You need to make sure of the specific application name assigned to your
tool in the API and of any special parameters or inputs required in order
to run. For example, PLINK requires a PEDMAP format. The PEDMAP
format is essentially two files, the .PED and the .MAP file for each knowntruth data set.
For example, our simulation files are stored in a shared folder, where each
odd file number is a .PED and each even is a .MAP. Each odd is a .PED
file and the subsequent file number is a .MAP like so:
As can be seen, for our particular structure we would need to submit two
files for each run. So let’s walk through it. We first can list all the apps
in order to find ours (which we have already installed), so that we can
get the exact name that we need to use for the SubmitJob function.
> ListApps ( )
Validate: A Workflow for Evaluating GWAS/QTL Tools
7
We can see that the exact name of PLINK on the Foundation API is
”plink-1.07ul”. We will revisit the earlier explanation to see how we
would submit a PLINK job using the PEDMAP format.
Step 1-D) Use the short R script to select known-truth data
sets and submit a job run for each one using your application.
>
>
>
>
>
+
+
+
+
+
i n s t a l l . packages ( ” rPlant ” )
require ( rPlant )
V a l i d a t e ( ” username ” , ” password ” )
mydir <− L i s t D i r ( ” s i m u l a t i o n s ” )
f o r ( i i n 1 : nrow ( mydir ) ) {
SubmitJob ( j o b . name=NULL,
a p p l i c a t i o n=” p l i n k −1.07 u l ” ,
f i l e . path=” s i m u l a t i o n s ” , f i l e . l i s t = l i s t ( mydir [ i , 1 ] ,
mydir [ i + 1 , 1 ] ) )
print ( i )
}
This should iterate over each simulation in our data set and submit a
PLINK job to the iPlant hardware. Since iPlant uses a queuing system,
8
Validate: A Workflow for Evaluating GWAS/QTL Tools
this effectively distributes your workload over many computer nodes as
needed. This is obviously helpful in achieving a high volume of runs, even
outside of known-truth testing. Now you know how!
2.2
Using rPlant to Sample From Your Known-Truth Data Sets
Let’s say, for example, that we had 600 total known-truth data sets: Our
known-truth datasets are generated from hundred different genotypes,
with three different types of simulated missing values such as 0%, 3%,
and 8%. In addition, we have data generated with and without population structure (meaning the stochastic processes generated the data have
either a single population mean or varying group means).
Say that we didn’t want to run all of them, but maybe just half of them.
In many cases, you may have substantially more than 600 and thus sampling makes much more sense then it does in this example.
We can use some scripting in R and rPlant to accomplish the same thing
we did earlier but with some random sampling. Here is the code we used
to sample 300 known-truth PEDMAPs for PLINK.
>
>
>
>
>
>
+
+
+
>
>
+
+
+
>
>
>
+
+
+
+
+
+
>
>
>
+
+
+
+
+
+
+
>
>
+
+
+
+
+
set . seed ()
require ( rPlant )
V a l i d a t e ( ” username ” , ” password ” )
mydir <− L i s t D i r ( ” s i m u l a t i o n s ” )
g e n o s <− m a t r i x ( nrow =1200 , n c o l =1)
b r e a k . data <− f u n c t i o n ( x , y=2) {
broken <− u n l i s t ( s t r s p l i t ( x , ’ ’ ,TRUE) )
r e t u r n ( broken [ y ] )
}
mydir <− mydir [ , 1 ]
f o r ( i i n 1 : l e n g t h ( mydir ) ) {
g e n o s [ i ] <− b r e a k . data ( f i l e s [ i ] , 2 )
g e n s <− na . omit ( u n i q u e ( g e n o s ) )
}
oddsamp <− s e q ( 1 , 1 1 , 2 )
t o t e s t <− l i s t ( )
f o r ( i i n 1 : l e n g t h ( genoa ) ) {
m y f i l e s <− l i s t ( )
for ( j in 1: length ( f i l e s )) {
i f ( b r e a k d a t ( f i l e s [ j ] ,2)== g e n o s [ i ] ) {
m y f i l e s <− append ( m y f i l e s , f i l e s [ j ] )
}
}
m y f i l e s <− m y f i l e s [ sample ( oddsamp , 2 , FALSE ) ]
m y f i l e s <− u n l i s t ( m y f i l e s )
for (k in 1: length ( f i l e s )) {
for (p in 1: length ( myfiles )) {
i f ( f i l e s [ k]== m y f i l e s [ p ] ) {
t o t e s t <− append ( t o t e s t , k )
}
}
}
}
t o t e s t <− u n l i s t ( t o t e s t )
for ( i in 1: length ( totest )) {
SubmitJob ( j o b . name=NULL,
a p p l i c a t i o n=” p l i n k −1.07 u l ” , f i l e . l i s t =
l i s t ( f i l e s [ totest [ i ] ] , f i l e s [ totest [ i ]+1]) ,
f i l e . path=” s i m u l a t i o n s ” )
print ( i )
}
Every situation is unique in this case, which is part of the reason we have
yet to develop a graphical user interface method for submitting jobs. All
Validate: A Workflow for Evaluating GWAS/QTL Tools
9
that we did in the code above, is demonstrate how rPlant may be used
to break up some files that had naming conventions that were separated
by underscores. If you look back to the earlier image that showed what
our known-truth data sets looked like, you would see that phenotype,
heritability information, and population structure are all in the naming
format for each data set.
This is an important piece of information, because without an appropriate
naming structure, there would be no way for us to keep metadata on the
known-truth data sets throughout this testing process.
We break up the names to grab the pieces about phenotype information
in order to essentially stratify-sample our data sets by genotype. We then
have six data sets for any one genotype (three missing values types and
two population structure types), and then we just pick two at random.
This insures that we include all of our genotypes in our runs, but there are
simpler ways to do this, that basically just random sample from all of our
data sets. The following code again assumes you are using PEDMAPs to
run PLINK, but that you just want to sample a random 300 (as opposed
to a stratified-random sample).
>
>
>
>
>
>
>
>
+
+
+
+
+
3
3.1
set . seed ()
require ( rPlant )
V a l i d a t e ( ” username ” , ” password ” )
mydir <− L i s t D i r ( ” s i m u l a t i o n s ” )
mydir <− mydir [ , 1 ]
oddsamp <− s e q ( 1 , 5 9 9 , 2 )
t o t e s t <− sample ( oddsamp , 3 0 0 , FALSE)
for ( i in 1: length ( totest )) {
SubmitJob ( j o b . name=NULL,
a p p l i c a t i o n=” p l i n k −1.07 u l ” , f i l e . l i s t =
l i s t ( mydir [ t o t e s t [ i ] ] , mydir [ t o t e s t [ i ] + 1 ] ,
f i l e . path=” s i m u l a t i o n ”
}
Aggregating with Aggregate
How to Use the GUI Aggregate Tool
The second major step is accomplished once all the runs have finished. In
our example, depending on the resources available, PLINK can finish in
a range from ten seconds to two and half minutes per run (not including
the queuing process). This is non-linear as well, because many will be
running simultaneously on separate nodes while some remain in queues.
Its hard to gauge exactly how long your tool will take, but it will almost
definitely run faster on multiple nodes this way.
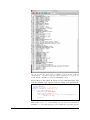
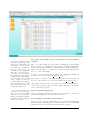
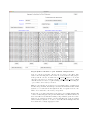
Step 2-A) Log in to the DE and make sure all runs are complete.
Let’s say that we have already run all of our runs. Then we would want
to log in to the iPlant Discovery Environment to make sure all the folders
are in our analyses folder. As can be seen, each run of PLINK with each
distinct known-truth data set has been put in to each folder. If we were
to open up each folder, we would see a set of files, of which only one
we will want to put through Validate. In the case of this PLINK run,
you need to put each file ending in .qassoc (the standard PLINK output
filetype) in to a single folder, so that we can run Validate on that folder.
10
Validate: A Workflow for Evaluating GWAS/QTL Tools
→ If you are testing for effect
sizes that are different for different levels of heritability, you
may want to create more folders in this step. Actually, for
the rest of this process, you
would have to everything multiple times for each folder you
create here. Say for example,
I’m testing three different heritability levels, which will have
three different groups of actual
effects. Then I would need
to run Validate three different
times, and thus need to make
three folders in this step and
separate them that way.
→ Note that in rPlant, your
don’t have to type your username and you begin iPlant
data store file locations immediately. For example, in rPlant,
the same location would just be
written as ”analyses”
Step 2-B) In the DE, create a new folder for your Validate
analysis.
The .qassoc files in this case, are the files containing the actual analysis
that we will use for evaluating the effectiveness of PLINK. Particularly,
those are the predicted values for each SNP based on the PLINK algorithm. Now, it’s time to compare those predicted values with what we
know to be the actual values.
You need to create a folder that we will use for our Validate analysis. In
the DE, create a folder called my Validate analysis.
The goal is to look inside each of the 300 folders we created, and pull out
the .qassoc file and move it to the folder marked my Validate analysis.
Since this would take hours, we suggest you launch the application we
created called Aggregate that provides a fairly easy way to do this (at
least, comparatively easier).
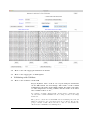
Step 2-C) Launch Aggregate.
Once you launched Aggregate you will see there is a place to enter your
username and password. Go ahead and enter those.
Step 2-D) Enter username and password.
Now, you need to type the out the full location of the folder starting with
username where your analyses are located. In this case, all of our PLINK
analyses folders are located in the folder dalanders/analyses.
Validate: A Workflow for Evaluating GWAS/QTL Tools
11
Step 2-E) Enter the folder location where all your tool analyses
are located and click View Folders in Directory.
We will enter dalanders/analyses and click the button View Folders in
Directory. This is provide us with a list of all the files and folders in that
directory on the iPlant data store in the left-most listbox.
Step 2-F) Select only folders from the known-truth data sets
runs.
12
Validate: A Workflow for Evaluating GWAS/QTL Tools
Now, we want to just select the folders that we just created. You can
select them all using Control + Click to select individual ones, or if you
wish to just select the whole list you can select all between two files by
using Shift + Click.
We also provide a method selecting many at us by using the Select All
Containing: logic button at the bottom of the listbox.
For example, our analyses folders all contain the words ”GenotypeData”
or even ”Trait”.
We can type in the box just to the right of Select All Containing: ”Trait”
and then click the button. This should select just the folders we are
interesting obtaining the contents of.
We can scroll up and down to make sure that we have only selected the
ones that we need. If we have selected a few that we didn’t intend to.
We can select those using the mouse and then click the Delete button to
remove those from the list.
Step 2-G) Click View Contents of Selected Folders
Once you’ve got all your folders in the first listbox, click the button on the
Validate: A Workflow for Evaluating GWAS/QTL Tools
13
right call View Contents of Selected Folders and this will iterate over the
folders in the left-most listbox and add the contents of all those folders
to the right-most listbox. It should take a few minutes, so give it some
time. Once its done, see if you can spot the files that you were interested
in moving. In our case, they are the files ending in .qassoc.
As you can see, every single item in the right-most listbox is a file or
folder contained with one of the folders in the left-most listbox. Now,
we need to select all the files from the right-most listbox that we wish to
move to the folder we created in order to run Validate.
Step 2-H) Select just the tool outputs from the right-most listbox.
In order to select just the right files that you intend to move, you can use
the same Select All Containing: logic button we used earlier, or if they
all have the same file extension (as ours do with .qassoc) then we can use
another option.
Above the right-most listbox is a button labelled Select File Type. Next
to that, we type qassoc in and then click the button in order to just select
the file types that we want to move.
14
Validate: A Workflow for Evaluating GWAS/QTL Tools
Step 2-I) Move the files to your Validate analysis folder.
Now, we can move the files. In the text box next to the Move Files
button enter the full path of the folder we created just for this purpose
in Step 2-B. In our case, we named it my Validate analysis so we would
enter in to the text box: dalanders/analyses/my Validate analysis. Then
click Move Files in order to begin iterating over that list and sending the
.qassoc files to the folder you created.
This process can take about as long or longer than it did to actually view
the files. Keep in mind, that this process uses the iPlant Foundation API
system, so for each item in the right-most list, a request is send to the
API to move that file to the folder you specified.
It may also be worth noting that by the time you read this manual, this
could be a fully-integrated step in the iPlant Discovery Environment, as
there was talk about this functionality being available given more time.
However, we found it necessary, even though this part of the problem is
almost entirely logistical, to be able to select files from multiple files and
move them in to a single aggregate folder.
Validate: A Workflow for Evaluating GWAS/QTL Tools
15
3.2
How to Use the Aggregate Function in rPlant
3.3
How to Use Aggregate on Atmosphere
4
4.1
Validating with Validate
How to Use Validate on the DE
Step 3-A) First, take a look at one of your analyses documents
on the DE. Check for four things: The nature of the column
delimitation, the name of the SNP column, the name of P-value
or other importance scoring column, and the name of an effect
size column if there is one.
For example, our SNP column is SNP, our importance column is P, and
our effect size column is BETA. You are looking for those four things
mentioned.
The goal is to assess how well PLINK was at identifying those known
SNPs as compared to the ones where there are no effects. We are also
going to include a SNP effects text file, so that we can measure the
effectiveness for PLINK at determining those.
16
Validate: A Workflow for Evaluating GWAS/QTL Tools
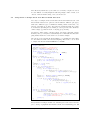
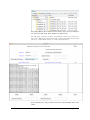
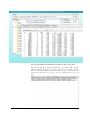
Step 3-B) Gather known SNP and known effect text files.
The known SNP file contains essentially just text with a list of all the
SNPs with known effects in our case, its a list of 35 SNPs. For us,
these are called syntruth.txt and synbetas03.txt respectively and we have
included screenshots so you can get an idea of what they need to look
like.
Validate: A Workflow for Evaluating GWAS/QTL Tools
17
The known effects text file is the same way and it must be in the same
order as the SNPs. This means (looking at the above screenshots) that
SNP CWAW1335 has effect 0.0324 and so on. This information ordering
information is used by Validate to assign true effect sizes to all the SNPs
in your outputs (and in doing so labels all others as zero). Also, Validate
uses the information from the known SNPs file to label all SNPs in your
output as either TRUE or FALSE based on whether or not they are
included in that file.
This is how performance measures are inherently generated, so this must
be included. By default, Validate includes classification measures such
as AUC and so you must include known SNPs file. However, the known
effects file is optional.
Step 3-C) Upload your known SNPs file and the known effects
file using the DE.
Upload both of these text files using the Discovery Environment. This is
extremely easy to do. It also does not matter where you upload them to.
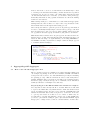
Step 3-D) Run Validate!
It’s time to run Validate finally! Open up the Apps icon on the DE and
select Validate. Then you need to just fill in the form. Select a name and
a description of your choice.
Then fill in the inputs section. For the folder containing GWAS/QTL,
you input the folder that contains all of your tool outputs. In our
case, our PLINK outputs are contained in the folder dalanders/analyses/my Validate folder.
The truth file is what we have been referring to as the known SNPs file,
and the effects file is what we have been referring to as the known effects
file. Again, they need to be in that format.
On the column names and additional options tab, input the names of
columns that we discussed earlier. For us, it was P, SNP, and BETA.
18
Validate: A Workflow for Evaluating GWAS/QTL Tools
→ To see more about how these
severity ratio priors influence
the H measure, see section 7.2
We also input severity ratios here as well for the H measure. We advise
that you always do at least two: the first one should be the proportion of
positives divided by the proportion of negatives. In our case, that would
be 35/780000. The second one should be just 1.
Validate: A Workflow for Evaluating GWAS/QTL Tools
19
5
Visualizing the Validation
5.1
How to Use the Demonstrate R Package
5.2
How to Use Demonstrate on the DE
5.3
How to Use Demonstrate on Atmosphere
6
Acknowledgements
7
How to Interpret Performance Measures
7.1
AUC
7.2
H
7.3
KS
7.4
TPR
7.5
FPR
7.6
Accuracy
7.7
MAE
7.8
RMSE
hmeasure.net
20
Validate: A Workflow for Evaluating GWAS/QTL Tools