1
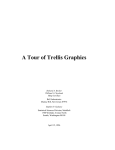
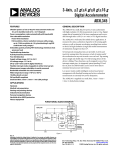
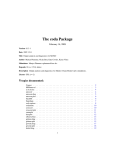
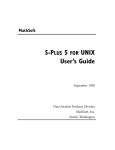
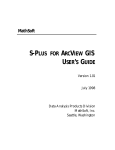
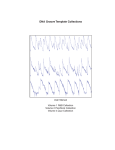
Trellis Graphics User’s Manual
Richard A. Becker and William S. Cleveland
AT&T Bell Laboratories, Murray Hill, NJ 07974
December 21, 1995
Copyright 1995 AT&T Bell Laboratories. All Rights Reserved.
Chapter 1
About Trellis Graphics
Making graphs is very basic to data analysis. Whether you use the
leading edge of statistical methods, or whether you want to quickly see
the main features of your data, graphs are a must. They are the single
most powerful class of tools for analyzing data.
Trellis Graphics is a new system for making graphs, written using the core
S-PLUS graphics functions. Trellis has many exciting features, some of
them quite glitzy, but the true measure of a visualization system is how
much it enables you to learn from your data. So in this chapter we will
begin with two sets of data, then discuss features, and finally, tell you
who developed Trellis.
2
CHAPTER 1. ABOUT TRELLIS GRAPHICS
1.1 Discovering the Missed Happening at Morris
Figure 1.1 is a Trellis display of data from an agricultural field trial to
study the crop barley. At six sites in Minnesota, ten varieties of barley
were grown in each of two years. The data are the yields for all
combinations of site, variety, and year, so there are 6 10 2 = 120
observations. In figure 1.1, each panel displays the 20 yields at a single
site.
The barley experiment was run in the 1930s. The data first appeared in a
1934 report published by the experimenters. Since then, the data have
been analyzed and re-analyzed. R. A. Fisher presented the data for five of
the sites in his classic book, The Design of Experiments. Publication in the
book made the data famous, and many others subsequently analyzed the
them, usually to illustrate a new statistical method.
Then in the early 1990s, the data were visualized by Trellis Graphics. The
result was a big surprise. Through 60 years and many analyses, an
important happening in the data had gone undetected. Figure 1.1 shows
the happening, which occurs at Morris. For all other sites, 1931 produced
a significantly higher overall yield than 1932. The reverse is true at
Morris. But most importantly, the amount by which 1932 exceeds 1931 at
Morris is similar to the amounts by which 1931 exceeds 1932 at the other
sites. Either an extraordinary natural event, such as disease or a local
weather anomaly, produced a strange coincidence, or the years for Morris
were inadvertently reversed. More Trellis displays, a statistical modeling
of the data, and some background checks on the experiment led to the
conclusion that the data are in error. But it was Trellis displays such as
figure 1.1 that provided the “Aha!” which led to the conclusion.
1.1. DISCOVERING THE MISSED HAPPENING AT MORRIS
1932
o
3
1931
o
Waseca
o
Trebi
Wisconsin No. 38
No. 457
Glabron
Peatland
Velvet
No. 475
Manchuria
No. 462
Svansota
o
o
o
o
o
o
o
o
o
o
o
o
o
oo
o
o
o
o
Crookston
Trebi
Wisconsin No. 38
No. 457
Glabron
Peatland
Velvet
No. 475
Manchuria
No. 462
Svansota
o
o
o
o
o o
o
o
o
o
o
o
o
o
o
o
o
o
o
o
Morris
Trebi
Wisconsin No. 38
No. 457
Glabron
Peatland
Velvet
No. 475
Manchuria
No. 462
Svansota
o
o
o
o
o o
o
o
o
oo
o
o
o
o
o
o
o
o
o
University Farm
o
Trebi
Wisconsin No. 38
No. 457
Glabron
Peatland
Velvet
No. 475
Manchuria
No. 462
Svansota
o
oo
o
o
o o
o
o
o
o
o
o
o
o
o
o
o
Duluth
Trebi
Wisconsin No. 38
No. 457
Glabron
Peatland
Velvet
No. 475
Manchuria
No. 462
Svansota
o
o
o
o
o
oo
oo
o
o o
oo
o
o o
o
o
o
Grand Rapids
Trebi
Wisconsin No. 38
No. 457
Glabron
Peatland
Velvet
No. 475
Manchuria
No. 462
Svansota
o
o
o
o
o o
o
o
o
o
o
o o
20
o
o
o
o
o
o
o
30
40
50
60
Barley Yield (bushels/acre)
Figure 1.1
4
CHAPTER 1. ABOUT TRELLIS GRAPHICS
1.2 Seeing the Sunspot Cycles
The top panel of figure 1.2 graphs the yearly sunspot numbers from 1849
to 1924. The aspect ratio, the height of the data region of the graph
divided by the width, is 1.0. An aspect ratio of 1.0 is what you might
expect to see as a default in cases where aspect ratio has not been
considered. But the graph fails to reveal an important property of the
cycles. In the bottom panel, the data are graphed again, but this time the
aspect ratio has been chosen by an algorithm in Trellis Graphics called
banking to 45 . Now the property is revealed. The sunspot cycles typically
rise more rapidly than they fall; this behavior is pronounced for the cycles
with high peaks, is less pronounced for those with medium peaks, and
disappears for those cycles with the lowest peaks. In the top panel, the
aspect ratio of 1.0 prevents an accurate visual decoding of the slopes of
the line segments connecting successive observations. In the bottom
panel, banking allows a more accurate visual decoding of the slopes.
1.2. SEEING THE SUNSPOT CYCLES
5
150
100
50
0
1750
1800
1850
1900
Sunspot Number vs. Year
150
0
1750
1800
1850
1900
Sunspot Number vs. Year
Figure 1.2
6
CHAPTER 1. ABOUT TRELLIS GRAPHICS
1.3 Trellis Features
Trellis Graphics is a large leap forward in helping you to understand the
structure of your data, to understand the properties of models fitted to
your data, and to understand how well such models describe the
structure of your data. Here are a few of its many new features.
Multipanel Conditioning
Figure 1.1 illustrates multipanel conditioning: each panel of the figure
shows the dependence of yield on variety, conditional on year and site.
Multipanel conditioning is an exceptionally powerful visualization tool
for studying the dependence of a response on two or more explanatory
variables. It is particularly effective for ferreting out interactions. The
panels are laid out into columns, rows, and pages. Figure 1.1 has only one
page, but for large data sets, conditioning can result in a large number of
panels, so more than one page is needed. This layout of panels is
reminiscent of a garden trelliswork, and hence, the name “Trellis
Graphics”.
Banking to 45
Selecting the aspect ratio, or shape, of a graph to maximize the accuracy
of our visual decoding of information was an outstanding problem of
statistical graphics for decades. The solution, a breakthrough in data
display, has been implemented in Trellis Graphics. Banking to 45 chooses
the aspect ratio to center the absolute values of the slopes of selected line
segments on 45 . Perceptual experiments have shown that this maximizes
the accuracy of our visual decoding of the relative values of the slopes.
1.4. TRELLIS AND THE CORE S-PLUS GRAPHICS
7
Automation
Trellis Graphics employs automation methods that save you time by
automatically selecting rendering aspects—for example, multipanel
layout, line types, plotting symbols, colors, and character sizes—to
achieve effective visual perception of the structure of data. These
automation methods are tuned to the graphics device you are using.
Tailoring Trellis to Your Data
Still, even though our automation methods work well, you will want to
alter displays.
You can alter what goes in the data region of your graph by altering a
panel function, a simple procedure that describes what the panel display
method should be. And you can alter panel functions to produce
completely new types of displays tailored to the needs of your data.
You have very delicate control over labels and scales if you need it. Yet
this control is direct and easy to exert.
1.4 Trellis and the Core S-PLUS Graphics
The core S-PLUS graphics is a collection of low-level drawing functions
and graphics parameter settings. The low-level functions draw graphical
elements. For example, points(), draws plotting symbols and lines()
draws lines. The parameter settings govern the details of how graphical
elements are rendered. For example, pch = "+" sets the plotting symbol
to a plus sign.
Trellis Graphics employs the core graphics in two ways. First, Trellis has
been implemented using the core graphics. Second, when you write a
panel function to tailor the display to your data, you use features of the
core graphics; typically, these are very simple features, considerably
simpler than the Trellis implementation, which used just about every
feature of the core.
8
CHAPTER 1. ABOUT TRELLIS GRAPHICS
1.5 Trellis vs. the Old S-PLUS High-Level Graphics
Since the very beginning of S-PLUS there has been a collection of
high-level graphics functions that are used to display graphs. Examples
are plot(), qqnorm(), and persp(). These routines, like Trellis
Graphics, are also implemented using the core graphics.
Trellis Graphics provides more functionality than the old high-level
capabilities; there are many new ways to display data, such as multipanel
conditioning. It has also greatly improved some of the old display
methods. For example, wireframe() does a better job of 3-D rendering
than persp(). Trellis Graphics also has a better mechanism for the
details of rendering graphs—aspect ratio, plotting symbols, colors, line
types, panel layouts, coordinated scales on different graphs, and so forth.
The defaults work better and users can now make changes with much
more effective and predictable results.
1.6 Who
The visualization methods of Trellis Graphics and the design and
implementation of the S-PLUS code resulted from several years of hard
running by Rick Becker, Bill Cleveland, and Ming Shyu at AT&T Bell
Laboratories in Murray Hill, N.J. At StatSci, Stephen Kaluzny took the
baton pass with great skill and integrated the system into S-PLUS.
Chapter 2
About This User’s Manual
2.1 What Does this Manual Cover?
This User’s Manual provides an introduction to Trellis Graphics Version
2.0. This version first appeared in S-PLUS releases in the fall of 1995.
The Manual was meant to be read from the beginning to teach you how to
use Trellis. It was also meant to serve as a reference while you are using
Trellis; the Table of Contents should be helpful for locating sections that
describe the feature in which you are interested. Also, the Manual was
meant to be introductory. To keep things simple, some of the more
detailed features are mentioned but not discussed. You can use the online
help to get the details.
The Manual was written by two of the Trellis Graphics developers, Rick
Becker and Bill Cleveland of AT&T Bell Laboratories.
10
CHAPTER 2. ABOUT THIS USER’S MANUAL
2.2 What You Need to Know About the Rest of S-PLUS to
Use Trellis
You can employ Trellis Graphics to do quite useful things with just a
minimum of knowledge of the rest of S-PLUS. All you need to get started
is a knowledge of the material in chapters 1-5, 7, and 10-11 of A Gentle
Introduction to S-PLUS, one of the manuals available from StatSci.
2.3 Other Reading About Trellis
Color and black and white versions of this Manual are available on the
Web from Statistics Research at AT&T Bell Labs:
http://netlib.att.com/netlib/att/stat/info/trellis.html
Another document, A Tour of Trellis Graphics by Rick Becker, Bill
Cleveland, Ming Shyu, and Stephen Kaluzny is more narrative, and less
of a reference guide; and it presents usages not presented here. This
document is also available at the above Web site.
But even more fundamentally, this User’s Manual does not show you
examples of the use of Trellis to analyze data, complete with problem
description, data description, analysis, and conclusions. Data analysis is
discussed in The Visual Design and Control of Trellis Display by Rick Becker,
Bill Cleveland, and Ming Shyu. This document is also available at the
above Web site.
Even more examples can be found in the book Visualizing Data by Bill
Cleveland. It was written at a time when Trellis Graphics was in its
infancy, so not all of today’s capabilities are discussed, but the examples it
does have are presented in great detail. The book is available from the
publisher, Hobart Press, at [email protected].
2.4. SOME IMPORTANT CONVENTIONS USED IN THIS MANUAL
11
2.4 Some Important Conventions Used in this Manual
S-PLUS commands and expressions, names of S-PLUS objects, and the
arguments of S-PLUS functions appear in bold. For example, in this guide
we will make use of a data frame gas, which has two numeric variables,
NOx and E. Later we will use the function xyplot() and its argument
formula= to make a scatterplot of NOx against E:
xyplot(formula = gas$NOx ˜ gas$E)
In the previous paragraph we used two other conventions. The name of
the function that makes the scatterplot is actually xyplot, but we write it
as xyplot() to signal that this S-PLUS object is a function. Similarly, the
argument is formula, but we write it as formula= to signal that we are
making reference to an argument.
Some material is a bit detailed and could stand reading after you have a little experience with
Trellis Graphics. We have used smaller type for such material just as in this paragraph.
12
CHAPTER 2. ABOUT THIS USER’S MANUAL
2.5 Data Sets
In this Manual, a number of data sets are used as examples. In addition,
Trellis Graphics contains functions that draw graphs to show how the
system works; these functions use data sets. The data sets in these
examples are contained in either the Trellis library or other S-PLUS
databases, or are computed by commands given in the Manual.
Chapter 3
Getting Started
3.1 library()
In S-PLUS, the Trellis Graphics library is named trellis; it contains
functions, objects that are used by the Trellis code, data sets, and example
functions that draw displays to help you to see how Trellis Graphics
works. If you are on Windows, the library is automatically attached. If
you are on UNIX running S-PLUS Version 3.3 or earlier, you need to
attach the library:
> library(trellis)
3.2 trellis.device()
You need to have a graphics device on which to draw. If you have not
specified a device, but you execute a function that draws a graph, then a
color screen device is automatically set up for you.
14
CHAPTER 3. GETTING STARTED
The two devices that come up automatically can also be specified directly
with trellis.device(). On Windows the command is
trellis.device(win.graph)
On UNIX the command is
trellis.device(motif)
For some UNIX systems, there is another screen device, openlook.
You can send Trellis graphs to a printer. Also, you can set up multiple
devices; for example, you might have two devices that are graphics
windows on your screen and one device that is a printer. Information is
given about this in chapter 11.
WARNING: If you have used the old S-PLUS graphics, then you will
know that you set up devices in a different way. For example, on
Windows, you set up the screen device by
win.graph()
If you do this by mistake, you will find the Trellis graphs are not rendered
nearly as well because the graphical parameters of the core S-PLUS
graphics will not be customized to the device as they are when you use
trellis.device().
3.3 dev.off()
You turn off a graphics device by the command
dev.off()
3.4. TRELLIS OBJECTS
15
3.4 Trellis Objects
Trellis display functions return objects of class trellis. The expression
xyplot(formula = gas$NOx ˜ gas$E)
draws a graph on the graphics device. The expression
foo <- xyplot(formula = gas$NOx ˜ gas$E)
saves the graph in foo but does not draw it. If you then type
foo
the graph is drawn.
3.5 print.trellis()
It is the print method for trellis objects that sends a graph to a device. In
the example of the previous section, typing foo causes S-PLUS to use
print(foo) to display the graph. The reason for mentioning this is that
you must sometimes explicitly use print(foo)—when the graph is
made from a function or from a source file.
16
CHAPTER 3. GETTING STARTED
3.6 Example Functions
The example functions in the Trellis library draw displays to show you
the Trellis capabilities and a bit about how Trellis works. The names of the
example functions all begin with example. You can see a list of all of
these functions using the online help:
?trellis.examples
Figure 3.1 shows the result of executing one of these example functions:
example.normal.qq()
3.6. EXAMPLE FUNCTIONS
17
-2
Soprano 2
-1
0
1
2
Soprano 1
75
70
65
60
Alto 2
Alto 1
Tenor 2
Tenor 1
75
70
Height (inches)
65
60
75
70
65
60
Bass 2
Bass 1
75
70
65
60
-2
-1
0
1
2
Unit Normal Quantile
Figure 3.1
18
CHAPTER 3. GETTING STARTED
Chapter 4
A Roadmap of Trellis Graphics
4.1 General Display Functions
The Trellis library has a collection of general display functions that draw
different types of graphs. For example, xyplot() makes x-y plots,
dotplot() makes dot plots, and wireframe() makes 3-D wireframe
displays. The functions are general because they have the full capability of
Trellis Graphics including multipanel conditioning.
The general display functions are introduced in chapter 7.
4.2 Common Arguments
There are a set of common arguments that all general display functions
employ. The usage of some of these arguments varies, but each has a
common purpose across all functions. Many of the general display
functions also have arguments that are specific to the types of graphs that
they draw.
The common arguments are discussed in chapters 5, 6, 9, 10, and 12.
20
CHAPTER 4. A ROADMAP OF TRELLIS GRAPHICS
4.3 Panel Functions
Panel functions are a critical aspect of Trellis Graphics. They make it easy
to tailor displays to your data even when the displays are quite
complicated ones with many panels.
The data region of a panel on a graph resulting from a general display
function is a rectangle that just encloses the data. The sole responsibility
for drawing in a data region is given to a panel function that is an
argument of the general display function. The other arguments of the
general display function manage the superstructure of the graph—scales,
labels, boxes around the data region, and keys. The panel function
manages the symbols, lines, and so forth that encode the data in the data
region.
Panel functions are discussed in chapter 12.
4.4 Core S-PLUS Graphics
Trellis Graphics is implemented in the core S-PLUS graphics. Also, when
you write a panel function you use functions and graphics parameters
from the core.
Core S-PLUS graphics is discussed in chapter 12.
4.5 Devices and Settings
You need an output device to see a graph. The specification of a screen
device was introduced in chapter 3. Of course, you also want to send
graphs to printers and to files. Trellis Graphics allows you to do this in
many ways.
Sending graphs to files and printers is discussed in chapter 11.
4.6. DATA STRUCTURES
21
Trellis Graphics has many settings for graph rendering details—plotting
symbols, colors, line types and so forth— that are automatically chosen
depending on the device you select.
Chapter 12 mentions the settings functions.
4.6 Data Structures
The general display functions take in data in certain ways. The Trellis
library contains several functions that change data structures of certain
types to a data frame, which makes it easier to pass the data on to the
display functions.
Chapter 5 mentions functions that restructure arrays, time series, and
groups of vectors into data frames.
22
CHAPTER 4. A ROADMAP OF TRELLIS GRAPHICS
Chapter 5
Giving Data to General Display
Functions
For a graphics function to draw a graph, it needs to know the data on
which the drawing is based. This chapter is about arguments to the Trellis
drawing functions that allow you to specify the data.
24
CHAPTER 5. GIVING DATA TO GENERAL DISPLAY FUNCTIONS
5.1 A Data Set: gas
The data frame gas contains two variables from an industrial experiment
with 22 runs in which the concentrations of oxides of nitrogen (NOx) in
the exhaust of an engine were measured for different settings of
equivalence ratio (E).
> names(gas)
[1] "NOx" "E"
> dim(gas)
[1] 22 2
5.2 formula=
The function xyplot() makes an x-y plot, a graph of two numerical
variables; the result might be scattered points, curves, or both. xyplot()
has its own section in chapter 7, but for now we will use it to illustrate
how to specify data.
Figure 5.1 is a scatterplot of gas$NOx against gas$E:
xyplot(formula = gas$NOx ˜ gas$E)
The argument formula specifies the variables that are to be graphed. In
this case they are gas$NOx and gas$C. For xyplot(), the variable to the
left of the ˜ goes on the vertical axis, and the variable to the right of the ˜
goes on the horizontal axis. The formula gas$NOx ˜ gas$E is read as
gas$NOx “is graphed against” gas$E.
5.2. FORMULA=
25
5
gas$NOx
4
3
2
1
0.7
0.8
0.9
1.0
1.1
1.2
gas$E
Figure 5.1
26
CHAPTER 5. GIVING DATA TO GENERAL DISPLAY FUNCTIONS
The use of formula here is the same as that in the S-PLUS statistical
modeling functions such as lm and aov. To the left or right of the ˜ you
can use any S-PLUS expression. For example, if you had wanted to graph
the log base 2 of gas$NOx, you would have used the formula
log(gas$NOx,base=2) ˜ gas$E
The argument formula is a special one in Trellis Graphics. It is always
the first argument of a general display functions such as xyplot(). We
can omit typing formula= provided the formula is the first argument.
Thus the expression
xyplot(gas$NOx ˜ gas$C)
also produces figure 5.1. formula is the only argument that should be
given by position; all others must be given by name.
Certain single-symbol operators that perform functions in S-PLUS have a new meaning in the
formula language (e.g., +, *, /, |, and :), although Trellis, as we will see, uses only * and |. If
you want to use any of these operators for their general meaning in any formula expression— for
example, if you want to use * as multiplication—you must put the expression inside the identity
function I() unless it is already given as an argument to a function. Here is an example:
log(2*gas$NOx,base=2) ˜ I(2*gas$E)
We use I() on the right of the formula to protect against the * in 2*gas$E, but not on the left
because 2*gas$NOx sits inside a function.
5.3 data=
One annoyance in the use of the above formulas is that we had to
continually refer to the data frame gas. This is not necessary if we attach
gas to the search list of databases. We can draw figure 5.1 by
5.3. DATA=
attach(gas)
xyplot(NOx ˜ E)
Another possibility is to use the argument data=:
xyplot(NOx ˜ E, data = gas)
In this case, the variables of gas are available for use in formula just
during the execution of xyplot(). The effect is the same as
attach(gas)
xyplot(NOx ˜ E)
detach(gas)
The use of data has another benefit. In the call to xyplot() we see
explicitly that the data frame gas is being used; this can be helpful for
understanding, at some future point, how the graph was produced.
27
28
CHAPTER 5. GIVING DATA TO GENERAL DISPLAY FUNCTIONS
5.4 subset=
Suppose you want to redo figure 5.1 and omit the observations for which
E is 1.1 or greater. You could do this by
xyplot(NOx[E < 1.1] ˜ E[E < 1.1], data = gas)
But it is a nuisance to repeat the logical subsetting, E < 1.1. And the
nuisance would be much greater if there were many variables in the
formula instead of just two. It is typically easier to use the argument
subset instead:
xyplot(NOx ˜ E, data = gas, subset = E < 1.1)
The result is shown in figure 5.2. The argument subset can take any
expression that subsets vectors.
5.4. SUBSET=
29
5
NOx
4
3
2
0.7
0.8
0.9
1.0
1.1
E
Figure 5.2
30
CHAPTER 5. GIVING DATA TO GENERAL DISPLAY FUNCTIONS
5.5 as.data.frame.array(), as.data.frame.ts(), make.groups()
This chapter began our description of the standardization in specifying data for the general
display functions. Because of this standardization it is sometimes convenient to have the data
placed on a data frame, with subsets of the data delineated by the levels of a factor. Data do not
always start out in this form, but three functions can help get them there.
as.data.frame.array() converts arrays to data frames, as.data.frame.ts() converts
time series, and make.groups converts a collection of vectors. Use ?as.data.frame.array,
?as.data.frame.ts, and ?make.groups to see how they work.
Chapter 6
Aspect Ratio
The aspect ratio of a graph, the height of a panel data region divided by
its width, is so important that we are going to introduce it early to have it
available for ensuing displays. See chapter 1 for an example where
choosing the aspect ratio to carry out banking to 45 shows information in
the data that cannot be seen if the graph is square, that is, has an aspect
ratio of 1.
32
CHAPTER 6. ASPECT RATIO
One advance of Trellis Graphics is the direct control of the aspect ratio.
The argument is aspect. You can set the ratio to a specific value. In
figure 6.1 the aspect ratio has been set to 3/4:
xyplot(NOx ˜ E, data = gas, aspect = 3/4)
33
5
NOx
4
3
2
1
0.7
0.8
0.9
1.0
1.1
1.2
E
Figure 6.1
34
CHAPTER 6. ASPECT RATIO
Setting aspect = "xy" banks line segments to 45 . Here is how it
works. Suppose x and y are data points to be plotted. Consider the line
segments that connect successive points. The aspect ratio is chosen so that
the absolute values of the slopes of these segments is centered on 45 .
This done in figure 6.2 by the expression
xyplot(NOx ˜ E, data = gas, aspect = "xy")
We have used the data themselves in this example to carry out banking,
just to illustrate how it works. The resulting aspect ratio is about 0.4.
Ordinarily, though, we should bank based on a smooth underlying
pattern in the data; that is, we should bank based on the line segments of
a fitted curve. You can do that with Trellis Graphics as well.
35
5
NOx
4
3
2
1
0.7
0.8
0.9
1.0
1.1
1.2
E
Figure 6.2
36
CHAPTER 6. ASPECT RATIO
Chapter 7
General Display Functions
Each general display function draws a particular type of graph. For
example, dotplot() makes dot plots, wireframe() makes 3-D
wireframe displays, histogram() makes histograms, and xyplot()
makes x-y plots. This chapter describes a collection of general display
functions.
7.1 A Data Set: fuel.frame
The data frame fuel.frame contains five variables that measure
characteristics of 60 automobile models:
> names(fuel.frame)
[1] "Weight" "Disp."
> dim(fuel.frame)
[1] 60 5
"Mileage" "Fuel"
"Type"
The variables are weight, displacement of the engine, fuel consumption in
miles per gallon, fuel consumption in gallons per mile, and a classification
into type of vehicle. The first four variables are numeric. The fifth
variable is a factor:
> table(fuel.frame$Type)
Compact Large Medium Small Sporty Van
15
3
13
13
9
7
38
CHAPTER 7. GENERAL DISPLAY FUNCTIONS
7.2 xyplot()
We have already seen xyplot() in action in many of our previous
examples. This function is a basic graphical method—graphing one set of
numerical values on a vertical scale against another set of numerical
values on a horizontal scale.
Figure 7.1 is a scatterplot of mileage against weight:
xyplot(Mileage ˜ Weight, data = fuel.frame,
aspect = 1)
The variable on the left of the ˜ goes on the vertical, or y, axis and the
variable on the right goes on the horizontal, or x, axis.
7.2. XYPLOT()
39
35
Mileage
30
25
20
2000
2500
3000
3500
Weight
Figure 7.1
40
CHAPTER 7. GENERAL DISPLAY FUNCTIONS
7.3 bwplot()
The box and whisker plot, or box plot, is a very clever invention of John
Tukey that is widely used for comparing the distributions of several data
sets.
Figure 7.2 is a box plot of mileage classified by vehicle type:
bwplot(Type ˜ Mileage, data = fuel.frame,
aspect = 1)
The factor Type is on the left of the formula because it goes on the vertical
axis and the numeric vector Mileage is on the right because it goes on the
horizontal axis. (You cannot reverse the arguments to reverse the axes.)
7.3. BWPLOT()
41
Van
Sporty
Small
Medium
Large
Compact
20
25
30
35
Mileage
Figure 7.2
42
CHAPTER 7. GENERAL DISPLAY FUNCTIONS
7.4 stripplot()
A strip plot, sometimes called a one-dimensional scatterplot, is similar to
a box plot in general layout but the individual data points are shown
instead of the box plot summary.
Figure 7.3 is a stripplot:
stripplot(Type ˜ Mileage, data = fuel.frame,
jitter = TRUE,
aspect = 1)
Setting jitter = TRUE causes some random noise to be added
vertically to the points to alleviate the overlap of the plotting symbols.
When jitter = FALSE, the default, the points for each level lie on a
horizontal line.
7.4. STRIPPLOT()
43
Van
Sporty
Small
Medium
Large
Compact
20
25
30
35
Mileage
Figure 7.3
44
CHAPTER 7. GENERAL DISPLAY FUNCTIONS
7.5 qq()
The quantile-quantile plot, or q-q plot, is an extremely powerful tool for
comparing the distributions of two sets of data. The idea is quite simple;
quantiles of one data set are graphed against corresponding quantiles of
the other data set.
The variable fuel.frame$Type has five levels:
> table(fuel.frame$Type)
Compact Large Medium Small Sporty Van
15
3
13
13
9
7
Figure 7.4 is a q-q plot comparing the quantiles of mileage for compact
cars with the corresponding quantiles for small cars:
qq(Type ˜ Mileage, data = fuel.frame,
aspect = 1,
subset = (Type == "Compact")|(Type == "Small"))
The factor on the right side of the formula should have two levels. Note
that the default labels for the two scales are the names of the levels.
7.5. QQ()
45
35
Small
30
25
25
30
35
Compact
Figure 7.4
46
CHAPTER 7. GENERAL DISPLAY FUNCTIONS
7.6 dotplot()
The dot plot, which displays data with labels, provides highly accurate
visual decodings, typically far more accurate than other methods for
displaying labeled data.
Let us compute the mean mileage for each vehicle type:
> mileage.means <- tapply(fuel.frame$Mileage,
+ fuel.frame$Type, mean)
> mileage.means
Compact
Large
Medium Small Sporty
Van
24.13333 20.33333 21.76923
31
26 18.85714
Figure 7.5 is a dotplot of the log base 2 means:
dotplot(names(mileage.means) ˜ log(mileage.means,base=2),
aspect = 1,
cex = 1.25)
The argument cex is passed to the panel function to change the size of the
dot of the dot plot in this case; more on this in chapter 12.
7.6. DOTPLOT()
Van
47
•
•
Sporty
•
Small
•
Medium
Large
•
•
Compact
4.4
4.6
4.8
log(mileage.means, base = 2)
Figure 7.5
48
CHAPTER 7. GENERAL DISPLAY FUNCTIONS
7.7 barchart()
Overall, dot plots are a more effective display method than bar charts,
avoiding some of the perceptual problems of bar charts. Still, there are
circumstances where bar charts are harmless.
Figure 7.6 is a bar chart of the mileage means (without logs):
barchart(names(mileage.means) ˜ mileage.means,
aspect = 1)
7.7. BARCHART()
49
Van
Sporty
Small
Medium
Large
Compact
20
22
24
26
28
30
mileage.means
Figure 7.6
50
CHAPTER 7. GENERAL DISPLAY FUNCTIONS
7.8 piechart()
Pie charts have severe perceptual problems. Experiments in graphical
perception have shown that compared with dot plots, they convey
information far less reliably. But if you want to display some data, and
perceiving the information is not so important, then a pie chart is fine.
Figure 7.7 is a pie chart of the mileage means:
piechart(names(mileage.means) ˜ mileage.means)
7.8. PIECHART()
M
ed
ium
Large
51
Co
Van
all
Sporty
Sm
ct
a
mp
Figure 7.7
52
CHAPTER 7. GENERAL DISPLAY FUNCTIONS
7.9 qqmath()
Normal probability plots, or normal q-q plots, are the single most
powerful tool for determining if the distribution of a set of measurements
is well approximated by the normal distribution.
Figure 7.8 is a normal probability plot of the mileages for small cars:
qqmath(˜Mileage, data = fuel.frame,
subset = (Type == "Small"))
That is, the ordered data are graphed against quantiles of the standard
normal distribution.
Note that the formula for qqmath() is used in a way unlike any of the
previous examples. Only one data object appears in the formula, to the
right of the ˜, because this graphical method utilizes only one data object.
qqmath() can also make probability plots for other distributions. It has
an argument distribution whose input is any function that computes
quantiles. The default is qnorm. If we used
qqmath(˜Mileage, data = fuel.frame,
subset = (Type == "Small"),
aspect = 1,
distribution = qexp)
the result would be an exponential probability plot. Note that the name of
the function appears as the default label on the horizontal scale of the plot.
7.9. QQMATH()
53
36
34
Mileage
32
30
28
26
-1
0
1
qnorm
Figure 7.8
54
CHAPTER 7. GENERAL DISPLAY FUNCTIONS
7.10 histogram()
A histogram can be useful for showing the distribution of a single set of
data, but two or more histograms are typically not nearly as powerful as a
box plot or q-q plot for comparing data distributions.
Figure 7.9 is a histogram of mileage:
histogram(˜Mileage, data = fuel.frame,
aspect = 1,
nint = 10)
The argument nint determines the number of intervals. The histogram
algorithm chooses the intervals to make the bar widths be simple numbers
while trying to make the number of intervals as close to nint as possible.
7.10. HISTOGRAM()
55
20
Percent of Total
15
10
5
0
20
25
30
35
Mileage
Figure 7.9
CHAPTER 7. GENERAL DISPLAY FUNCTIONS
56
7.11
densityplot()
Like histograms, density plots can be of help in understanding the
distribution of a single set of data, but box plots and q-q plots typically
give more incisive comparisons of distributions.
Figure 7.10 is a density plot of mileage:
densityplot(˜Mileage, data = fuel.frame,
aspect = 1/2,
width = 5)
The argument width controls the width of the smoothing window in the
same units as the data, mpg here; as the width increases, the smoothness
increases.
7.11. DENSITYPLOT()
57
0.10
Density
0.08
0.06
0.04
0.02
0.0
15
20
25
30
35
40
Mileage
Figure 7.10
58
CHAPTER 7. GENERAL DISPLAY FUNCTIONS
7.12 splom()
The scatterplot matrix is an exceedingly powerful tool for displaying
measurements of three or more variables.
Figure 7.11 is a scatterplot matrix of the variables in fuel.frame:
splom(˜fuel.frame)
Note that the factor Type has been converted to a numeric variable and
plotted just like the other variables, which are numeric. The six levels of
Type simply take the values 1 to 6 in this conversion.
7.12. SPLOM()
Van
Small
Van
Sporty
59
Sporty
5.5
4.5
5.0
Type
Medium
Medium
Large
Large
Compact
Small
Compact
5.5
5.0
4.5
Fuel
4.0
3.5
3.0
3.0
30
35
3.5
4.0
35
30
Mileage
25
20
20
300
200
250
25
300
250
200
Disp.
200
150
100
100
3000
150
200
3500
3500
3000
Weight
2500
2000
2500
2000
Figure 7.11
60
CHAPTER 7. GENERAL DISPLAY FUNCTIONS
7.13 parallel()
Parallel coordinates are an interesting method, but it is unclear at the time
of this writing whether they have the power to uncover structure that is
not more readily apparent using other graphical methods.
Figure 7.12 is a parallel coordinates display of the variables in
fuel.frame:
parallel(˜fuel.frame)
7.13. PARALLEL()
61
Type
Fuel
Mileage
Disp.
Weight
Min
Max
Figure 7.12
CHAPTER 7. GENERAL DISPLAY FUNCTIONS
62
7.14 A Data Set: gauss
To further illustrate the general display routines, we will compute a
function of two variables over a grid.
datax
datay
dataz
gauss
<<<<-
rep(seq(-1.5, 1.5, length = 50), 50)
rep(seq(-1.5, 1.5, length = 50), rep(50, 50))
exp(-(dataxˆ2 + datayˆ2 + datax*datay))
data.frame(datax, datay, dataz)
Thus dataz is the exponential of a quadratic function defined over a 50
by 50 grid; in other words, the surface is proportional to a normal density.
7.15 contourplot()
Contour plots are helpful displays for studying a function, f (x; y ), when
we have no need to study the conditional dependence of f on x given y or
of f on y given x. Conditional dependence is revealed far better by
multipanel conditioning.
Figure 7.13 is a contour plot of the gaussian surface:
contourplot(dataz ˜ datax * datay, data = gauss,
aspect = 1,
at = seq(.1, .9, by = .2))
The argument at specifies the values as which the contours are to be
computed and drawn. If the argument is not specified, reasonable default
values are chosen.
7.15. CONTOURPLOT()
63
1.5
1.0
datay
0.5
0.1
0.0
0.9
0.7
0.5
-0.5
0.3
-1.0
0.1
-1.5
-1.5
-1.0
-0.5
0.0
0.5
1.0
1.5
datax
Figure 7.13
64
CHAPTER 7. GENERAL DISPLAY FUNCTIONS
7.16 levelplot()
Level plots are also helpful displays for studying a function, f (x; y ). They
are no better than contour plots when the function is simple, but often are
better when there is much fine detail, for example, many peaks and
valleys.
Figure 7.14 is a level plot of the gauss surface:
levelplot(dataz ˜ datax * datay, data = gauss,
aspect = 1,
cuts = 6)
The values of the surface are encoded by color or gray scale. For devices
with full color, the scale goes from pure magenta to white and then to
pure cyan. If the device does not have full color, a gray scale is used.
For a levelplot, the range of the function values is divided into intervals
and each interval is assigned a color. A rectangle centered on each grid
point is given the color of the interval containing the value of the function
at the grid point. In figure 7.14 there are six intervals. The argument cuts
specifies the number of intervals.
7.16. LEVELPLOT()
65
1.5
1.0
0.8
0.5
datay
0.6
0.0
0.4
-0.5
0.2
-1.0
-1.5
-1.5
-1.0
-0.5
0.0
0.5
1.0
1.5
datax
Figure 7.14
66
CHAPTER 7. GENERAL DISPLAY FUNCTIONS
7.17 wireframe()
Wireframe displays can be quite useful for displaying f (x; y ) when we
have no need to study conditional dependence, which is revealed far
better by multipanel conditioning.
Figure 7.15 is a 3-D wireframe plot of the gauss surface:
wireframe(dataz ˜ datax * datay, data = gauss,
drape = F,
screen = list(z=45,x=-60,y=0))
The arrows point in the direction of increasing values of the variables.
The argument screen is a list. The three components of the list—x, y,
and z—refer to screen axes. The first component is horizontal and the
second is vertical, both in the plane of the screen. The third component is
perpendicular to the screen. The surface is rotated about these axes in the
order given in the list. Here is how it worked for figure 7.15. The surface
began with datax as the horizontal screen axis, datay as the vertical,
and dataz as the perpendicular. The origin was at the lower left in the
back. First, the surface was rotated 45 about the perpendicular screen
axis, where a positive rotation is counterclockwise. Then, there was a
;60 rotation about the horizontal screen axis, where a negative rotation
brings the picture at the top of the screen away from the viewer and the
bottom toward the viewer. Finally, there was no rotation about the
vertical screen axis; had there been one with a positive number of degrees,
then the left side of the picture would have moved toward the viewer and
the right away.
If drape = T, a color encoding is added to the surface using the same
encoding method of the level plot.
7.17. WIREFRAME()
67
dataz
datay
datax
Figure 7.15
68
CHAPTER 7. GENERAL DISPLAY FUNCTIONS
7.18 cloud()
A static 3-D plot of a scatter of points is typically not effective because the
depth cues are insufficient to give a strong 3-D effect. Still, on rare
occasions, such a plot can be useful, sometimes as a presentation or
teaching tool.
Figure 7.16 is a 3-D scatterplot of the first three variables in the data frame
fuel.frame:
cloud(Mileage ˜ Weight * Disp., data = fuel.frame,
screen = list(z=-30,x=-60,y = 0),
xlab = "W",
ylab = "D",
zlab = "M")
The behavior of the argument screen is the same as that for wireframe.
We have used three additional arguments to specify scale labels; such
labeling will be discussed in chapter 10.
7.18. CLOUD()
69
M
D
W
Figure 7.16
CHAPTER 7. GENERAL DISPLAY FUNCTIONS
70
7.19 The Display Functions and Their Formulas
The following listing of the general display functions and their formulas
is instructive because it shows certain conventions and consistencies in
the formula mechanism:
Graph One Numerical Variable Against Another
xyplot(numeric1 ˜ numeric2)
Compare the Sample Distributions of Two or More Sets of Data
bwplot(factor ˜ numeric)
stripplot(factor ˜ numeric)
qq(factor ˜ numeric)
Graph Measurements with Labels
dotplot(character ˜ numeric)
barchart(character ˜ numeric)
piechart(character ˜ numeric)
Graph the Sample Distribution of One Set of Data
qqmath(˜numeric)
histogram(˜numeric)
densityplot(˜numeric)
Graph Multivariate Data
splom(˜data.frame)
parallel(˜data.frame)
7.19. THE DISPLAY FUNCTIONS AND THEIR FORMULAS
Graph a Function of Two Variables Evaluated on a Grid
contourplot(numeric1 ˜ numeric2 * numeric3)
levelplot(numeric1 ˜ numeric2 * numeric3)
wireframe(numeric1 ˜ numeric2 * numeric3)
Graph Three Numerical Variables
cloud(numeric1 ˜ numeric2 * numeric3)
71
72
CHAPTER 7. GENERAL DISPLAY FUNCTIONS
Chapter 8
Arranging Several Graphs On One Page:
print()
Several graphs, made separately by Trellis display functions, can be
displayed on a single page. There is one restriction. None of the
individual graphs may be a multipanel conditioning display with more
than one page.
74
CHAPTER 8. ARRANGING SEVERAL GRAPHS ON ONE PAGE: PRINT()
Figure 8.1 shows two graphs arranged on one page:
attach(fuel.frame)
box.plot <- bwplot(Type ˜ Mileage)
scatter.plot <- xyplot(Mileage ˜ Weight)
detach()
print(box.plot,
position = c(0,0,1,.4),
more = T)
print(scatter.plot,
position = c(0,.35,1,1))
The argument position specifies the position of each graph on the page
using a page coordinate system in which the lower left corner of the page
is (0, 0) and the upper right corner is (1, 1). The graph rectangle is the
portion of the page allocated to a graph. position takes a vector of four
numbers; the first two numbers are the coordinates of the lower left
corner of the graph rectangle, and the second two numbers are the
coordinates of the upper right corner.
Notice that in the above example the graph rectangles overlap somewhat.
Here is the reason. The description of a graph by the software contains
margins (empty space) around the edges of the graph. But in arranging
graphs on a page, we might well want to overlap margin space to use the
page space as efficiently as possible. Also, to create visual harmony, the
right side of the box plot was bought in .05 units to make it line up with
the right side of the scatterplot.
Arranging graphs on a page usually requires a few iterations using the
eye as a judge of graph placement. But it’s fun.
75
35
Mileage
30
25
20
2000
2500
3000
3500
Weight
Van
Sporty
Small
Medium
Large
Compact
20
25
30
35
Mileage
Figure 8.1
76
CHAPTER 8. ARRANGING SEVERAL GRAPHS ON ONE PAGE: PRINT()
Chapter 9
Multipanel Conditioning
9.1 A Data Set: barley
The data frame barley contains data from the barley experiment
discussed in section 1.1.
> names(barley)
[1] "yield"
"variety" "year"
"site"
The first of these four variables is numeric, and the remaining three are
factors. The experiment was run in the state of Minnesota in the 1930s. At
six sites, ten varieties of barley were grown in each of two years. The data
collected for the experiment are the yields for all combinations of site,
variety, and year, so there are 6 10 2 = 120 observations.
78
CHAPTER 9. MULTIPANEL CONDITIONING
9.2 About Multipanel Display
Figure 9.1 uses multipanel conditioning to display the barley data. Each
panel displays the yields of the ten varieties for one year at one site;
variety is graphed along the vertical scale and yield is graphed along the
horizontal scale. For example, the lower left panel displays values of
variety and yield for Grand Rapids in 1932. The panel variables are yield
and variety and the conditioning variables are year and site.
9.3 formula=
Figure 9.1 was made by the following command:
dotplot(variety ˜ yield | year * site, data = barley)
The | is read as “given”. Thus the formula is read as variety “is
graphed against” yield “given” year and site. Thus a simple use of
formula creates a complex multipanel display.
9.3. FORMULA=
79
20
30
40
Waseca
1932
•
Trebi
Wisconsin No. 38
No. 457
Glabron
Peatland
Velvet
No. 475
Manchuria
No. 462
Svansota
•
•
•
•
•
•
•
•
Crookston
1932
•
•
•
•
•
•
•
•
•
Morris
1932
Trebi
Wisconsin No. 38
No. 457
Glabron
Peatland
Velvet
No. 475
Manchuria
No. 462
Svansota
•
•
•
•
•
•
•
•
•
•
•
•
•
•
•
•
Trebi
Wisconsin No. 38
No. 457
Glabron
Peatland
Velvet
No. 475
Manchuria
No. 462
Svansota
Trebi
Wisconsin No. 38
No. 457
Glabron
Peatland
Velvet
No. 475
Manchuria
No. 462
Svansota
•
•
•
•
•
•
•
•
•
•
•
•
•
•
20
•
•
•
•
•
•
Grand Rapids
1932
•
•
•
•
•
30
40
50
•
•
•
•
•
Duluth
1931
Grand Rapids
1931
•
•
•
•
•
•
•
•
•
•
Duluth
1932
•
•
•
•
•
•
•
•
University Farm
1931
•
•
•
•
•
•
•
•
•
•
•
•
•
•
•
•
•
•
•
•
•
•
•
•
•
•
•
•
Morris
1931
University Farm
1932
Trebi
Wisconsin No. 38
No. 457
Glabron
Peatland
Velvet
No. 475
Manchuria
No. 462
Svansota
•
•
•
Crookston
1931
•
•
60
•
•
•
Trebi
Wisconsin No. 38
No. 457
Glabron
Peatland
Velvet
No. 475
Manchuria
No. 462
Svansota
50
Waseca
1931
•
•
60
yield
Figure 9.1
80
CHAPTER 9. MULTIPANEL CONDITIONING
9.4 Columns, Rows, and Pages
A multipanel conditioning display is a three-way rectangular array laid
out into columns, rows, and pages. In figure 9.1 there are two columns,
six rows and one page. The numbers of columns, rows, and pages are
selected by an algorithm that attempts of fill up as much of the graphics
region as possible subject to certain constraints. As we will see in
section 9.6, there is an argument layout= that allows you to choose the
numbers.
9.5 Packet Order and Panel Order
In the above formula, the conditioning variable year appeared first and
site appeared second. This gives an explicit ordering to the
conditioning variables. Each of these variables is a factor with levels:
> levels(barley$year)
[1] "1932" "1931"
> levels(barley$site)
[1] "Grand Rapids"
"Duluth"
[4] "Morris"
"Crookston"
"University Farm"
"Waseca"
The levels of each factor are ordered by their order of appearance in the
levels attribute. As we will discuss shortly, we can control the order by
making the factor an ordered one.
A packet is information sent to a panel for display. For figure 9.1, each
packet includes the values of variety and yield for a particular
combination of year and site. Packets are ordered by the orderings of the
conditioning variables and their levels; the levels of the first conditioning
variable vary the fastest, the levels of the second conditioning variable
vary the next fastest, and so forth. For figure 9.1, the order of the packets is
9.5. PACKET ORDER AND PANEL ORDER
1932
1931
1932
1931
1932
1931
1932
1931
1932
1931
1932
1931
81
Grand Rapids
Grand Rapids
Duluth
Duluth
University Farm
University Farm
Morris
Morris
Crookston
Crookston
Waseca
Waseca.
The panels of a multipanel display are also ordered. The bottom left panel
is panel one. From there we move fastest through the columns, next
fastest through the rows, and the slowest through the pages. The panel
ordering rule is like a graph, not like a table; the origin is at the lower left
and as we move either from left to right or from bottom to top, the panel
order increases. The following shows the panel order for figure 9.1, which
has two columns, six rows, and one page:
11 12
9 10
7 8
5 6
3 4
1 2
In Trellis Graphics, packets are assigned to panels according to the packet
order and the panel order. Packet 1 goes in panel 1, packet 2 goes into
panel 2 and so forth. In figure 9.1, the two orderings result in the year
variable changing along the columns and the site variable changing along
the rows. Note that as the levels for one of these factors increase, the
darkened bars in the strip label for the factor move from left to right.
82
CHAPTER 9. MULTIPANEL CONDITIONING
9.6 layout=
Multipanel conditioning is a powerful tool for understanding how a
response depends on two or more explanatory variables. In such an
analysis, it is typically important to make as many displays as necessary
to have each explanatory variable appear at least once as a panel variable.
In figure 9.1 variety, an explanatory variable, appears as a panel variable.
We will make a new display with site as a panel variable. The argument
layout= specifies the numbers of columns, rows, and pages:
dotplot(site ˜ yield | year * variety, data = barley,
layout = c(2,5,2))
The result is shown in figure 9.2, the first page, and in figure 9.3, the
second page.
If we do not specify layout, Trellis Graphics chooses the numbers of
columns, rows, and pages by a layout algorithm. The algorithm takes into
account the aspect ratio, the number of packets, the number of
conditioning variables, and the number of levels of each conditioning
variable. It chooses the numbers to maximize the size of the graph within
the graphics region.
9.6. LAYOUT=
83
20
30
40
Velvet
1932
•
•
Crookston
•
•
Morris
•
•
University Farm
•
•
Duluth
•
•
Grand Rapids
•
No. 475
1932
No. 475
1931
•
Waseca
•
•
Crookston
•
•
Morris
•
•
University Farm
•
•
Duluth
•
•
•
Manchuria
1932
Manchuria
1931
•
•
•
Waseca
Crookston
Morris
•
•
•
•
•
University Farm
•
•
Duluth
Grand Rapids
•
•
No. 462
1932
No. 462
1931
•
Waseca
•
•
Crookston
•
•
Morris
•
•
University Farm
•
•
Duluth
•
•
Grand Rapids
•
Svansota
1932
•
•
•
•
Morris
•
•
University Farm
•
•
Duluth
Grand Rapids
Svansota
1931
•
Waseca
Crookston
60
Velvet
1931
•
Waseca
Grand Rapids
50
•
•
•
20
30
40
50
60
yield
Figure 9.2
CHAPTER 9. MULTIPANEL CONDITIONING
84
20
30
40
Trebi
1932
60
Trebi
1931
•
Waseca
•
•
Crookston
•
•
Morris
•
•
•
University Farm
Duluth
•
•
•
Grand Rapids
•
Wisconsin No. 38
1932
Wisconsin No. 38
1931
•
Waseca
•
•
Crookston
•
•
Morris
•
•
University Farm
•
•
Duluth
•
•
Grand Rapids
•
No. 457
1932
No. 457
1931
•
Waseca
•
•
Crookston
•
•
Morris
•
•
University Farm
•
•
Duluth
•
•
•
Grand Rapids
Glabron
1932
Glabron
1931
•
Waseca
•
•
Crookston
•
•
Morris
•
•
University Farm
•
•
Duluth
Grand Rapids
50
•
•
•
Peatland
1932
Peatland
1931
•
Waseca
•
•
Crookston
•
•
Morris
•
•
University Farm
•
•
•
Duluth
•
Grand Rapids
20
•
30
40
50
60
yield
Figure 9.3
9.7. MAIN-EFFECTS ORDERING
85
9.7 Main-Effects Ordering
For the barley data, the explanatory variables are categorical. The data set
for each is a factor. (Since there are only two years, the year variable is
treated as a factor rather than a numeric vector.) For each factor, consider
the median yield for each level. For example, for variety, the level
medians are
> variety.medians <- tapply(barley$yield,
+ barley$variety, median)
> variety.medians
Svansota No. 462 Manchuria No. 475 Velvet Peatland
28.55
30.45 30.96667 31.06667 32.15 32.38334
Glabron No. 457 Wisconsin No. 38 Trebi
32.4 33.96666
36.95 39.2
The barley displays in figures 9.1 to 9.3 use an important display method:
main-effects ordering of levels. This greatly enhances our ability to perceive
effects. Consider figure 9.1. On each panel, the varieties are ordered from
bottom to top by the variety medians; Svansota has the smallest median
and Trebi has the largest. The site panels have been ordered from bottom
to top by the site medians; Grand Rapids has the smallest median and
Waseca has the largest. Finally, the year panels are ordered from left to
right by the year medians; 1932 has the smaller median and 1931 has the
larger.
This median ordering is achieved by making the data set for each
explanatory variable an ordered factor, where the levels are ordered by the
medians. For example, suppose variety started out as a factor without
the median ordering. We get the ordered factor through the following:
barley$variety <- ordered(barley$variety,
levels = names(sort(variety.medians)))
CHAPTER 9. MULTIPANEL CONDITIONING
86
9.8 Controlling the Pages of a Multipage Display
If a multipage display is sent to a screen device, the default behavior is for
the pages to be drawn in succession; in other words, a page is overwritten
by the drawing of its successor. This gives you little time to look at any
but the last page. You can control the page flow by
par(ask = TRUE)
S-PLUS queries you before each page is drawn; hit return to go to the next
page.
9.9 Summary: How to Lay Out a Multipanel Display
To lay out a multipanel display in a certain way you specify the following:
An ordering of the conditioning variables by the order you enter
them in the argument formula
An ordering of the levels of each factor, possibly by creating an
ordered factor
The number of columns, rows, and pages through the argument
layout.
9.10 A Data Set: ethanol
The data frame ethanol contains three variables from an industrial
experiment with 88 runs:
9.10. A DATA SET: ETHANOL
87
> names(ethanol)
[1] "NOx" "C"
"E"
> dim(ethanol)
[1] 88 3
The concentrations of oxides of nitrogen (NOx) in the exhaust of an
engine were measured for different settings of compression ratio (C) and
equivalence ratio (E). These measurements were part of the same
experiment that produced the measurements in the data frame gas
introduced in section 5.1.
CHAPTER 9. MULTIPANEL CONDITIONING
88
9.11
Conditioning On Discrete Values of a Numeric
Variable
For the barley data, the explanatory variables are factors, so it is natural to
condition on the levels of each factor. This is not the case for the ethanol
data; both explanatory variables, C and E, are numeric. Suppose for the
ethanol data, that we want to graph NOx against E given C. The variable
C has five unique values; in other words, the variable, while numeric, is
discrete:
> table(ethanol$C)
7.5 9 12 15 18
22 17 14 19 16
It makes sense then to condition on the unique values of C . Figure 9.4
does this:
xyplot(NOx ˜ E | C, data = ethanol, aspect = 1/2)
When a numeric variable is used as a conditioning variable in the
argument formula, then conditioning is automatically carried out on the
sorted unique values. In other words, the levels of the variable in such a
case are the unique values. The order of the levels is from smallest to
largest. For C, the first level is 7.5, the second is 9, and so forth. Thus the
first packet includes values of NOx and E for C = 7.5, the second packet
includes the values for C = 9, and so forth. As before, the packets fill the
panels according to the packet order and the panel order. In figure 9.4, the
values of C, which are indicated by the thin darkened bars in the strip
labels, increase from bottom to top.
9.11. CONDITIONING ON DISCRETE VALUES OF A NUMERIC VARIABLE
89
C
4
3
2
1
C
4
3
2
1
C
4
NOx
3
2
1
C
4
3
2
1
C
4
3
2
1
0.6
0.8
1.0
1.2
E
Figure 9.4
90
CHAPTER 9. MULTIPANEL CONDITIONING
9.12 Conditioning On Intervals of a Numeric Variable
For the ethanol data we graphed NOx against E given C in figure 9.4. We
would like to see NOx against C given E as well. But E varies in a nearly
continuous way; there are 83 unique values out of total of 88 values.
Clearly we cannot condition on single values.
Instead, we condition on intervals. This is done in figure 9.5. On each
panel, NOx is graphed against C for E in an interval. The intervals, which
are portrayed by the darkened bars in the strip, are ordered from low to
high, so as we go left to right and bottom to top through the panels, the
intervals go from low to high. The intervals overlap. In the next section
we will see how they were created and the expression that produced the
graph.
9.13 equal.count()
The nine intervals in figure 9.5 were produced by the equal count algorithm:
GIVEN.E <- equal.count(ethanol$E, number = 9,
overlap = 1/4)
There are two inputs to the algorithm, the number of intervals and a
target fraction of points to be shared by each pair of successive intervals.
In figure 9.5, the inputs are 9 and 1/4. The algorithm picks interval
endpoints that are values of the data; the left endpoint of the lowest
interval is the minimum of the data, and the right endpoint of the highest
interval is the maximum of the data. The endpoints are chosen to make
the counts of points in the intervals as nearly equal as possible, and the
fractions of points shared by successive intervals as close to the target
fraction as possible.
9.13. EQUAL.COUNT()
8
GIVEN.E
91
10
12
14
16
18
8
GIVEN.E
GIVEN.E
10
12
14
16
18
GIVEN.E
4
3
2
NOx
1
GIVEN.E
GIVEN.E
GIVEN.E
GIVEN.E
GIVEN.E
4
3
2
1
8
10
12
14
16
18
8
10
12
14
16
18
8
10
12
14
16
18
C
Figure 9.5
92
CHAPTER 9. MULTIPANEL CONDITIONING
The command that produced figure 9.5 is
xyplot(NOx ˜ C | GIVEN.E, data = ethanol, aspect = 2.5)
The aspect ratio was chosen to be 2.5 to approximately bank the
underlying pattern of the points to 45 . Notice that the automatic layout
algorithm chose five columns and two rows.
9.14 Shingles: shingle()
The result of equal.count() is an object of class shingle. The class is
named “shingle” because of the overlap, like shingles on a roof. First, a
shingle contains the numerical values of the variable and can be treated as
an ordinary numeric variable:
> range(GIVEN.E)
[1] 0.535 1.232
> range(ethanol$E)
[1] 0.535 1.232
Second, a shingle has the intervals attached as an attribute. There is a plot
method, a special Trellis function, that displays the intervals. Figure 9.6
shows the intervals of GIVEN.E:
plot(GIVEN.E)
9.14. SHINGLES: SHINGLE()
93
9
8
7
Panel
6
5
4
3
2
1
0.6
0.8
1.0
1.2
GIVEN.E
Figure 9.6
94
CHAPTER 9. MULTIPANEL CONDITIONING
You can use the function levels() to extract the intervals from the
shingle:
> levels(GIVEN.E)
min
max
0.535 0.686
0.655 0.761
0.733 0.811
0.808 0.899
0.892 1.002
0.990 1.045
1.042 1.125
1.115 1.189
1.175 1.232
A shingle can be specified directly by the function shingle(). Use
?shingle to see how it works.
9.15 skip=, between=, page=, prepanel=
The multipanel conditioning of Trellis Graphics has four more arguments that assist in the
control of the layout, visual design, labeling, and scaling. skip allows a panel position to be
skipped when packets are sent to the panels for drawing. between puts space between any two
adjacent columns or any two adjacent rows. page can add page numbers, text or even graphics
to each page of a multipage Trellis display. prepanel can help achieve a desired aspect ratio or
scale limits when the ratio or the limits depend on what is drawn by a panel function. For more
information use ?trellis.args.
Chapter 10
Scales and Labels
The general display functions presented in chapter 7 have arguments that
specify the scales and labels of graphs. These arguments are discussed in
this chapter.
10.1 Little Languages
Three of the arguments —scales, key, and strip— are powerful
arguments with many specifications. scales controls the tick marks and
their labels, key allows a key, or legend, to be added to a graph, and
strip controls the strip labels. Each of these arguments is complex
enough to be regarded as a little language. We will discuss them only
briefly. For more information use ?trellis.args, ?key, and
?strip.default.
96
CHAPTER 10. SCALES AND LABELS
10.2 xlab=, ylab=, main=, sub=
Figure 10.1 is a scatterplot of NOx against E for the gas data, which were
introduced in section 5.1:
xyplot(NOx ˜ E, data = gas, aspect = 1/2)
10.2. XLAB=, YLAB=, MAIN=, SUB=
97
5
NOx
4
3
2
1
0.7
0.8
0.9
1.0
1.1
1.2
E
Figure 10.1
98
CHAPTER 10. SCALES AND LABELS
In figure 10.1, the label for the horizontal, or x, scale, and the label for the
vertical, or y, scale are taken from the argument formula. We can specify
these scale labels as well as a main title at the top and a subtitle at the
bottom. This is illustrated in figure 10.2:
xyplot(NOx ˜ E, data = gas,
aspect = 1/2,
xlab = "Equivalence Ratio",
ylab = "Oxides of Nitrogen",
main = "Air Pollution",
sub = "Single-Cylinder Engine")
10.2. XLAB=, YLAB=, MAIN=, SUB=
99
Air Pollution
Oxides of Nitrogen
5
4
3
2
1
0.7
0.8
0.9
1.0
1.1
1.2
Equivalence Ratio
Single-Cylinder Engine
Figure 10.2
100
CHAPTER 10. SCALES AND LABELS
Each of these four label arguments can also be a list. One component of
the list can be a new character string for the text of the label. The other
components specify the size, font, and color of the text. The component
cex specifies the size; font, a positive integer, specifies the font; and col,
a positive integer, specifies the color. Figure 10.3 changes the sizes of the
title and subtitle:
xyplot(NOx ˜ E, data = gas,
aspect = 1/2,
xlab = "Equivalence Ratio",
ylab = "Oxides of Nitrogen",
main = list("Air Pollution", cex = 2),
sub = list("Single-Cylinder Engine", cex = 1.25))
10.2. XLAB=, YLAB=, MAIN=, SUB=
101
Air Pollution
Oxides of Nitrogen
5
4
3
2
1
0.7
0.8
0.9
1.0
1.1
1.2
Equivalence Ratio
Single-Cylinder Engine
Figure 10.3
102
CHAPTER 10. SCALES AND LABELS
10.3 xlim=, ylim=
In Trellis, the upper value of the scale line for a numeric variable is the
maximum of the data to be plotted plus 4% of the range of the data.
Similarly, the lower value of the scale line for a numeric variable is the
minimum of the data to be plotted minus 4% of the range of the data. The
4% helps prevent the data values from running into the edge of the plot.
We can alter the extremes of the horizontal scale line by the argument
xlim, a vector of two values. The first value replaces the minimum of the
data in the above procedure, and the second value replaces the maximum.
Similarly, we can alter the vertical scale by ylim.
In figures 10.1 to 10.3, NOx is graphed along the vertical scale. The limits
of this variable are
> range(gas$NOx)
[1] 0.537 5.344
In figure 10.4, the values 0 and 6 have been included in the vertical scale:
xyplot(NOx ˜ E, data = gas,
aspect = 1/2,
ylim = c(0, 6))
10.3. XLIM=, YLIM=
103
6
5
NOx
4
3
2
1
0
0.7
0.8
0.9
1.0
1.1
1.2
E
Figure 10.4
104
CHAPTER 10. SCALES AND LABELS
10.4 scales=
The argument scales= affects tick marks and tick mark labels. In
figure 10.4 there are seven tick marks and tick mark labels along the
vertical scale and six along the horizontal. In figure 10.5, scales= is used
to reduce the number of ticks and increase the size of the tick labels:
xyplot(NOx ˜ E, data = gas,
aspect = 1/2,
ylim = c(0,6),
scales = list(cex = 2, tick.number = 4))
The argument scales= is a list. The list component cex affects the size.
The list component tick.number affects the number, but it is just a
suggestion; an algorithm goes off and tries to find tick values that are
pretty, while trying to come as close as possible to the specified number.
We can also specify the tick marks and labels separately for each scale.
The specification
scales = list(cex = 2,
x = list(tick.number = 4),
y = list(tick.number = 10))
changes cex on both scales, but tick.number has been set to 4 for the
horizontal, or x, scale, and has been set to 10 for the vertical, or y, scale.
Thus the rule is this: specifications for the horizontal scale appear in
scales= as a component x that is itself a list, specifications for the
vertical scale appear in scales= as a component y that is a list, and
specifications for both scales appear as remaining components of
scales=.
There is an exception to the behavior of scales=. The two 3-D general
display functions wireframe() and cloud() currently do not accept
changes to each scale separately; in other words, components x y, and z
cannot be used. Also, the general display functions splom() and
piechart() have no tick marks and labels, so scales= does not apply
at all.
10.4. SCALES=
105
NOx
6
4
2
0
0.8
1.0
1.2
E
Figure 10.5
106
CHAPTER 10. SCALES AND LABELS
10.5 aspect=
The aspect ratio, the height of a panel data region divided by the width, is
controlled by aspect=. This argument was introduced in chapter 6 for
2-D displays. The behavior of aspect for the two 3-D general display
functions, wireframe() and cloud(), is somewhat different. Since
there are three axes, we must specify two aspect ratios to specify the
shape of the 3-D box around the data. Suppose the formula and the aspect
arguments are
formula = z ˜ x * y, aspect = c(1, 2)
Then the ratio of the length of the y-axis to the length of the x-axis is 1,
and the ratio of the length of the z-axis to the length of the x-axis is 2.
10.6 The Text in Strip Labels
The default text in the strip label for a numeric conditioning variable is
the name of the variable. This is illustrated in figure 10.6, which displays
the ethanol data introduced in section 9.10:
xyplot(NOx ˜ E | C, data = ethanol)
10.6. THE TEXT IN STRIP LABELS
107
C
4
3
2
1
0.6
C
0.8
1.0
1.2
C
4
NOx
3
2
1
C
C
4
3
2
1
0.6
0.8
1.0
1.2
E
Figure 10.6
108
CHAPTER 10. SCALES AND LABELS
The default text in the strip label of a factor conditioning variable is the
name of the factor level for the panel. This is illustrated in figure 10.7,
which displays the barley data introduced in section 9.1.
dotplot(variety ˜ yield | year * site, data = barley)
The name of the factor, for example, site, does not appear because
seeing the names of the levels is typically enough to convey the name of
the factor.
Thus the text comes from the names given to variables and factor levels in
the data sets that are plotted. If we want to change the text we can change
the names. For example, if we want to change the long label “University
Farm” to “U. Farm” then we can change the names of the levels of the
factor site:
> levels(barley$site)
[1] "Grand Rapids"
"Duluth"
[4] "Morris"
"Crookston"
> levels(barley$site)[3] <- "U. Farm"
"University Farm"
"Waseca"
10.6. THE TEXT IN STRIP LABELS
109
20
30
40
Waseca
1932
•
Trebi
Wisconsin No. 38
No. 457
Glabron
Peatland
Velvet
No. 475
Manchuria
No. 462
Svansota
•
•
•
•
•
•
•
•
Crookston
1932
•
•
•
•
•
•
•
•
•
Morris
1932
Trebi
Wisconsin No. 38
No. 457
Glabron
Peatland
Velvet
No. 475
Manchuria
No. 462
Svansota
•
•
•
•
•
•
•
•
•
•
•
•
•
•
•
•
Trebi
Wisconsin No. 38
No. 457
Glabron
Peatland
Velvet
No. 475
Manchuria
No. 462
Svansota
Trebi
Wisconsin No. 38
No. 457
Glabron
Peatland
Velvet
No. 475
Manchuria
No. 462
Svansota
•
•
•
•
•
•
•
•
•
•
•
•
•
•
20
•
•
•
•
•
•
Grand Rapids
1932
•
•
•
•
•
30
40
50
•
•
•
•
•
Duluth
1931
Grand Rapids
1931
•
•
•
•
•
•
•
•
•
•
Duluth
1932
•
•
•
•
•
•
•
•
University Farm
1931
•
•
•
•
•
•
•
•
•
•
•
•
•
•
•
•
•
•
•
•
•
•
•
•
•
•
•
•
Morris
1931
University Farm
1932
Trebi
Wisconsin No. 38
No. 457
Glabron
Peatland
Velvet
No. 475
Manchuria
No. 462
Svansota
•
•
•
Crookston
1931
•
•
60
•
•
•
Trebi
Wisconsin No. 38
No. 457
Glabron
Peatland
Velvet
No. 475
Manchuria
No. 462
Svansota
50
Waseca
1931
•
•
60
yield
Figure 10.7
110
CHAPTER 10. SCALES AND LABELS
10.7 par.strip.text=, strip=, key=
The size, font, and color of the text in the strip labels can by changed by
the argument par.strip.text=, a list whose components are the
parameters cex for size, font for the font, and col for the color. For
example, we can make huge strip labels by
par.strip.text = list(cex = 2)
The argument strip= allows very delicate control of what is put in the
strip labels. One usage that might be of interest in some cases is
strip = F
which removes the strip labels altogether.
The argument key, adds a key, or legend to a graph. See
?trellis.args and ?key for details.
Chapter 11
Devices
11.1
Three Kick Methods
You can send Trellis graphs to a printer directly or to a file for later
printing. But when you issue a command to do this, the sending does not
happen immediately. You need to give the system a kick. There are three
ways to kick: (1) send another graph; (2) turn off the device with the
command dev.off(); (3) end your S-PLUS session with q().
11.2
trellis.device()
The function trellis.device() specifies a device and enables Trellis
Graphics to tailor rendering details such as color, symbols, and line types
to the specified device. We saw in section 3.2 that it can be used to specify
screen devices. As we will see, it can be used to specify devices for
sending directly to a printer or for sending to a file for later printing.
CHAPTER 11. DEVICES
112
11.3
Sending to a Printer or a File
On UNIX, the command
trellis.device(postscript, onefile = FALSE)
sets up a PostScript device for direct sending to the printer. A graph goes
to the printer when you kick the system. Adding color = TRUE to the
argument list specifies color postscript.
On UNIX, the command
trellis.device(postscript,
onefile = FALSE,
print.it = FALSE,
file = "greatgraph.ps")
sets up a PostScript device for sending to the file greatgraph.ps. The file
writing is completed after you kick. Again, adding color = TRUE to the
argument list specifies color postscript. Note that if you issue two
commands to draw two separate graphs without changing the device in
any way, the first will overwrite the second.
On Windows, you can specify various types of printers. The command
trellis.device(win.printer, printer.type = "postscript")
specifies a PostScript printer for direct sending. A graph goes to the
printer when you kick the system. Adding color = TRUE to the
argument list specifies color postscript. For PCL printers (LaserJet
compatible), use
trellis.device(win.printer, printer.type = "pcl")
However, while you can get color printing on PCL printers by changing
arguments to Trellis functions, there is not yet an argument color to
customize PCL for color printing.
11.4. DEVICES FOR THIS MANUAL
113
On Windows, the command
trellis.device(win.printer,
printer.type = "postscript",
format = "printer",
file = "graph.ps")
writes PostScript to the file graph.ps, after the kick. Similarly,
trellis.device(win.printer,
printer.type = "pcl",
format="printer",
file = "graph.pcl")
does the same for PCL. Note that if you issue two commands to draw two
separate graphs without changing the device in any way, the first will
overwrite the second.
You can also create a Windows metafile that can be inserted into
documents:
trellis.device(win.printer,
format = "placeable metafile",
file = "graph.wmf")
On Windows, the use of the above commands only alert Trellis Graphics
what the device is so it can customize. You still use Windows to actually
select the device. Also, you can print hard copy by using the S-PLUS
File–Print menu, but this typically produces an undesirable graph because
Trellis Graphics cannot customize the rendering to your hard copy device.
11.4
Devices for this Manual
The graphs for this Manual were produced on UNIX. The device used for
the black and white graphs was
CHAPTER 11. DEVICES
114
trellis.device(postscript)
and the device used to produce the four color graphs at the beginning of
the Manual was
trellis.device(postscript, color = T)
11.5
Multiple Devices: dev.list(), dev.cur(), dev.set()
S-PLUS allows you to run multiple devices. A common usage is to have a
screen device and a hardcopy device, the first for experimenting and the
second for sending what you hope will be a finished product.
Suppose you are on UNIX. Then
trellis.device(motif)
trellis.device(postscript)
sets up a screen and a hardcopy device. Only one device is current, and
that one receives your graphics commands. For our example,
postscript is current since it was set up last. You can change the
current device:
> dev.set(which = 2)
motif
2
Now motif is current. You can show the current device:
> dev.cur()
motif
2
You can see the list of all active devices:
11.5. MULTIPLE DEVICES: DEV.LIST(), DEV.CUR(), DEV.SET()
> dev.list()
motif postscript
2
3
Finally, as we have seen, dev.off() turns off the current device and
shows the new current device:
> dev.off()
postscript
3
On Windows, you can use these functions, but you can also use the
Tools-Graphics Device menu to list, select, and close graphics devices,
including Trellis devices. (You cannot open a Trellis device from this
menu, but you can manipulate it once it is open.)
115
116
CHAPTER 11. DEVICES
Chapter 12
Panel Functions
The data region of a single-panel graph is the rectangular region where
the data are plotted. The data region of a multipanel graph is the
collection of rectangular regions, one per panel, where the data go.
A panel function has the sole responsibility for drawing in the data region
produced by a general display function. The panel function is passed in
through an argument of the general display function. The other
arguments of the general display function manage the superstructure of
the graph—scales, labels, boxes around the data region, and keys. The
panel function manages the symbols, lines and so forth that encode the
data in the data region.
Every general display function has a default panel function. In all
examples given so far in this Manual, the default panel function has been
doing the drawing.
118
CHAPTER 12. PANEL FUNCTIONS
12.1 How to Change the Rendering in the Data Region
You can change what is drawn in the data region by one of two
mechanisms. First, a default panel function has arguments. You can
change the rendering by using these arguments; in fact, you can give
them to the general display function, which will pass them along to the
panel function. Second, you can write your own panel function.
12.2 Passing Arguments to a Default Panel Function
The name of the default panel function for a general display function is
“panel.” followed by the name of the general function. For example the
default panel function for xyplot() is panel.xyplot(). You can use
S-PLUS online help to see the arguments of a default panel function. For
example, ?panel.xyplot tells you about the panel function for xyplot.
You can give an argument to a panel function by giving it to the general
display function; the general display function passes it on to the panel
function. Figure 12.1 uses an argument pch of panel.xyplot to specify
a “+” as the plotting symbol:
xyplot(NOx ˜ E, data = gas,
aspect = 1/2,
pch = "+")
12.2. PASSING ARGUMENTS TO A DEFAULT PANEL FUNCTION
+
5
+
+
+
+
119
+
++
+
+
NOx
4
+
+
+
+
3
+
+
++
2
+
+
1
+
+
0.7
0.8
0.9
1.0
1.1
1.2
E
Figure 12.1
120
CHAPTER 12. PANEL FUNCTIONS
12.3 Writing A Panel Function: panel=
If you write your own panel function, you pass it on to the general
display function using the argument panel=. For example, if you have
your own panel function mypanel(), you specify
panel = mypanel
A panel function is always a function of at least two arguments; the first
two are named x and y. Suppose, for the gas data, that you want to use
xyplot() to graph NOx against E and use a “+” as the plotting symbol
for all observations except that for which NOx is a maximum, in which
case you want to use “M”. You cannot use the arguments of the panel
function xyplot() to do this so you must write your own.
First, let us write the panel function:
panel.special <- function(x,y){
biggest <- y == max(y)
points(x[!biggest], y[!biggest], pch = "+")
points(x[biggest], y[biggest], pch = "M")
}
The function points() is a core graphics function. It graphs individual
points on a graph. Its first argument x contains the coordinates of the
points along the horizontal scale, and its second argument y contains the
coordinates of the points along the vertical scale. The third argument pch
gives the symbol used to display the points.
Figure 12.2 shows the result of giving panel.special() to xyplot().
xyplot(NOx ˜ E, data = gas,
aspect = 1/2,
panel = panel.special)
12.3. WRITING A PANEL FUNCTION: PANEL=
+
5
+
++
+
+
4
NOx
+
+ M
+
121
+
+
+
+
3
+
+
++
2
+
+
+
1
+
0.7
0.8
0.9
1.0
1.1
1.2
E
Figure 12.2
122
CHAPTER 12. PANEL FUNCTIONS
The panel function for figure 12.2 also could have been defined as part of
the xyplot() command:
xyplot(NOx ˜ E, data = gas,
aspect = 1/2,
panel = function(x,y){
biggest <- y == max(y)
points(x[!biggest], y[!biggest], pch = "+")
points(x[biggest], y[biggest], pch = "M")
}
)
12.4 A Panel Function for a Multipanel Display
In most cases, a panel function that is used for a single panel display can
be used for a multipanel display as well. In figure 12.3 the panel function
panel.special(), just used in figure 12.2, is used to show the
maximum value of NOx on each panel of a multipanel display of the
ethanol data:
xyplot(NOx ˜ E | C, data = ethanol,
aspect = 1/2,
panel = panel.special)
12.4. A PANEL FUNCTION FOR A MULTIPANEL DISPLAY
123
C
4
M+
++
+
3
+
+
+
2
+
+
1
+ +++
+
+
C
+
M
+
4
+
++
+
+
++
1
+
C
4
+
M+
3
NOx
2
++
++
+
+
+
+
+
2
+
+
1
3
+
++
+
+
+
++
C
4
+
+M
+
+
3
+
+
2
++
+
+
+
++
++ +
1
C
4
M
++
+
3
+
++
+
+
+
++
2
1
+
0.6
++
+
+
+ +
+
0.8
1.0
1.2
E
Figure 12.3
124
CHAPTER 12. PANEL FUNCTIONS
12.5 Special Panel Functions
Even if you write your own panel function you might want to use the
default panel function as part of it. This is often true when you want to
augment a standard Trellis panel. Also, Trellis Graphics provides some
special purpose panel functions. One of them is panel.loess(). It
adds smooth curves to scatterplots.
Figure 12.4 adds smooth curves to a multipanel display of the ethanol
data:
GIVEN.E <- equal.count(ethanol$E, number = 9,
overlap = 1/4)
xyplot(NOx ˜ C | GIVEN.E,
data = ethanol,
aspect = 2.5,
panel = function(x,y){
panel.xyplot(x,y)
panel.loess(x,y,span=1)}
)
The default panel function panel.xyplot() draws the points of the
scatterplot on each panel. The special panel function panel.loess()
computes and draws the smooth curves; the argument span, the
smoothing parameter, has been specified.
12.5. SPECIAL PANEL FUNCTIONS
8
GIVEN.E
10
12
14
16
125
18
8
GIVEN.E
GIVEN.E
10
12
14
16
18
GIVEN.E
4
3
2
NOx
1
GIVEN.E
GIVEN.E
GIVEN.E
GIVEN.E
GIVEN.E
4
3
2
1
8
10
12
14
16
18
8
10
12
14
16
18
8
10
12
14
16
18
C
Figure 12.4
126
CHAPTER 12. PANEL FUNCTIONS
12.6 subscripts=
For a multipanel display, another component of the packet sent to each
panel is the subscripts that subset each formula variable to provide the
variable values to the packet. Knowing these subscripts is helpful for
getting the values of other variables that might be needed for rendering
on the panel. In such a case the panel function takes a new argument
subscripts that contains the subscripts. In figure 12.5 the observation
numbers have been added to the graph of NOx against E given C:
xyplot(NOx ˜ E | C, data = ethanol,
groups = row.names(ethanol),
aspect = 1/2,
panel = function(x,y,subscripts,groups)
text(x,y,groups[subscripts],cex=.75)
)
See ?trellis.args for more information about subscripts.
12.6. SUBSCRIPTS=
127
C
4
54
81
64
66
41
3
53
2
43
88
42
14
1
25 44
8265
24
87
C
19
55
4
27
74
3
34
75 18
52
56
73
32
2
35
13
3176
72
1
33
26
86
C
4
111
67
68
4
NOx
3
9
2
2
17
16
3
12
1
85
510
C
4
20
4830
37
6
3
71
46
2
21
36
47
69
8
79
70 7
8445
1
C
4
62
58
77
50
3
63
22
29
51
59
80
28
49
38
61
57
15
2
1
40
39
23
60 78
83
0.6
0.8
1.0
1.2
E
Figure 12.5
128
CHAPTER 12. PANEL FUNCTIONS
12.7 The Common Core S-PLUS Graphics Features
The common core graphics functions used in writing panel functions are
points()
lines()
text()
segments()
polygon()
You can use the S-PLUS online help to see what they do. The common
core parameters used in writing panel functions are
col
lty
pch
lwd
cex
Use ?par for their definitions.
12.8 Settings: show.settings(), trellis.par.get(),
trellis.par.set()
It is sometimes useful in writing a panel function to make use of the device settings that govern
the rendering. There are three functions that work with the settings. show.settings() shows
graphically the values of the settings. trellis.par.get() lets you get the settings for use in
panel functions. trellis.par.set() lets you change the settings. See the online help for
details.