1
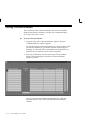
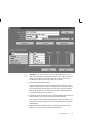
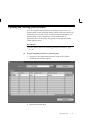
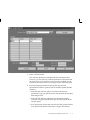
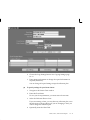
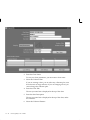
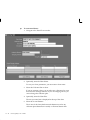
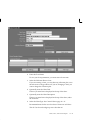
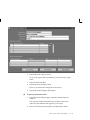
represents time or groups of quality results collected consecutively
over time. For example, you can view results by:
Occurrence: individual quality results or readings presented
consecutively over time, from the oldest occurrence to the most
recent occurrence
Collection number: a group of individual quality results or readings,
grouped into a collection and identified by a collection number
Entry date: individual quality results or readings, grouped by the
date in which they were entered
6.
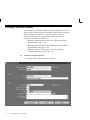
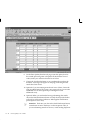
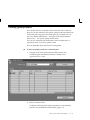
Select the Y–axis Element.
The Y–axis of the chart (the vertical dimension) represents the
primary collection element that you want to analyze. Usually, this
axis of the chart represents a variable collection element; for
example, temperature or voltage.
7.
Select the Y–axis Function if you want to group the collection
element values. See: Functional Grouping and Processing: page
12 – 9.
If the X–axis represents a grouping (for example, Collection
Number or Entry Date), you must select a grouping function for
the Y–axis. For example, if the X–axis is Entry Date, you can select
a function like Average to display average values for the collection
element for each day. If you choose Occurrence for the X–axis, you
cannot select a grouping function. See: Functional Grouping and
Processing: page 12 – 9.
8.
Optionally, enter the chart Description.
The text you enter here is displayed at the top of the chart, under
the chart title.
"
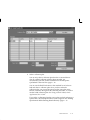
To find and select quality results:
H
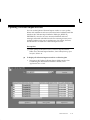
Navigate to the Show Results Where region of the Control Chart
window. See: Finding Quality Results: page C – 2.
If you do not select which quality results to chart, all results
associated with the collection plan are used.
"
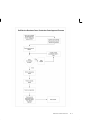
To view charts:
H
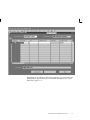
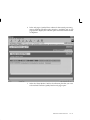
If you are using the Oracle Quality statistics engine, choose the
View Chart button. If you are using the Statit statistics engine,
choose the Statit button. See: QA:Statistics Engine: page 2 – 12.
Charts, Views, and Custom Reports
12 – 23