1
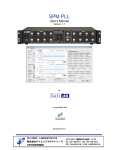
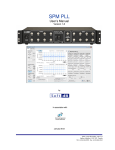
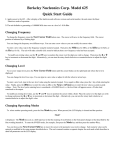
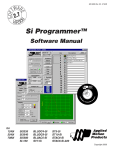
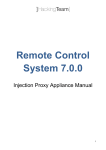
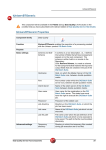
Tenor System
8-Channel Data Logger
User Manual, version 2.0e
August 2009
Contents
1.0
INTRODUCTION ..................................................................................................3
2.0
SOFTWARE AND USB DRIVER INSTALLATION ..............................................4
3.0
HARDWARE DESCRIPTION...............................................................................6
3.1 TECHNICAL DETAILS .....................................................................................................7
3.2 LED INFORMATION .......................................................................................................8
4.0
USING THE ACQUISITION SOFTWARE ............................................................9
4.1 LAUNCHING THE TENOR SOFTWARE ..............................................................................9
4.2 SET-UP INTERFACE.....................................................................................................10
4.2.1 General Set-up ..................................................................................................10
4.2.2 Input Set-up ......................................................................................................11
4.2.3 Output Set-up ....................................................................................................14
4.2.4 Input and Output Paths.....................................................................................14
4.3 WAVE FILES GENERATOR ...........................................................................................16
4.4 LAUNCHING THE ACQUISITION AND MONITORING ..........................................................19
4.4.1 Dynamic and Saturation Indicators...................................................................20
4.4.2 Global Indicators................................................................................................22
4.4.3 Time/Spectrum Indicators..................................................................................23
4.4.4 Export Graphs ...................................................................................................25
5.0
POST-PROCESSING.........................................................................................26
5.1 PLAY WAVE FUNCTION ...............................................................................................29
5.2 ANALYSIS FUNCTIONS TAB .........................................................................................30
5.2.1 Global Historic ...................................................................................................30
5.2.2 Average FFT......................................................................................................32
5.2.3 Statistics ............................................................................................................34
5.2.4 Waterfall graph ..................................................................................................35
5.2.5 FRF (Hx)............................................................................................................38
5.2.6 ISO2631 ............................................................................................................41
5.2.7 Change Inputs Set-up........................................................................................43
5.3 FILTER AND INTEGRATION TAB ....................................................................................44
5.3.1 Filter...................................................................................................................45
5.3.2 Integral x(t) ........................................................................................................47
5.4 SIGNAL EXTRACTION TAB ...........................................................................................49
5.5 EXPORT/SAVE TAB .....................................................................................................51
APPENDIX A:
TENOR DRIVER AND SOFTWARE INSTALLATION PROCEDURE ..53
APPENDIX B:
TENOR INPUT/OUTPUT SPECIFICATIONS........................................57
Tenor Data Logger
Soft dB inc.
1.0 Introduction
The Tenor Data Logger from Soft dB is an 8-channel acquisition system that can collect
data from different sensors (ICP and pre-amplified sensors). This instrument is based on
an external acquisition USB unit and a PC application, and is suitable for acoustic and
vibratory measurements.
The Tenor instrument has been designed to be a high-quality acquisition system at a
reasonable price. This has been achieved through a careful selection of electronic
components and by the design of an efficient communication architecture. Combined with
an easy-to-use PC interface, the Tenor is a great alternative to expensive vibro-acoustic
acquisition systems by other major manufacturers.
Here are the main features of the Tenor system:
8 analog inputs and 4 analog outputs
Sampling rate of 48.8 kHz per channel
3 input types: Direct DC, Direct AC and ICP
Realtime acquisition/data-logging for up to 8 inputs/4 outputs using the standard
wave file format
Realtime monitoring of input and output signals during acquisition (time signal,
global levels historic and average Sxx)
Complete post-processing module for signal analysis and playback functions
This user manual explains in-detail the use of the Tenor Data Logger software.
Note: Be sure to install the USB driver before launching the Tenor software. See section
2.0 for more details.
User Manual
p. 3
Tenor Data Logger
Soft dB inc.
2.0 Software and USB driver installation
!
Do not connect the Tenor unit to your PC before installing the
software and the Tenor USB driver (Windows does not
automatically recognize the Tenor unit, and the wrong drivers
could be installed).
Follow each step below precisely to ensure proper installation of
the software and drivers on your PC.
See Appendix A for more details.
STEP 1: Installation of the Tenor Software
1)
Launch the installation CD provided
“Tenor24Bit_DataLoggerVer2_0.exe",
with
the
unit
and
click
on
You can also download the latest release of the Tenor software from the Soft dB
website at:
http://www.softdb.com/SignalRangerMk2/Tenor24Bit_DataLoggerVer2_0.exe
2)
The following window appears:
Figure 1: Self-Extractor message, which appears during the installation process
Click “Setup” and follow the installation procedure. By default, the Tenor software is
installed in the C:\Program Files\Tenor_24Bit directory. Do not start the Tenor
software after finishing this step. The USB driver has to be installed beforehand (Step
3).
User Manual
p. 4
Tenor Data Logger
Soft dB inc.
STEP 2: Power the Tenor unit
Connect the power supply to the Tenor unit using the “12Vdc/2.0A” connector at the
rear of the unit. The Board Status LED on the rear of the Tenor unit should turn yellow.
STEP 3: Connection of the Tenor unit to the PC
Connect the Tenor unit to a computer using a USB cable.
Windows will then ask for the Signal Ranger Mk2 Drivers. The Signal Ranger Mk2 is
the DSP (Digital Signal Processor) board on which the Tenor system is based.
The Signal Ranger Mk2 drivers are located in the C:\Program Files\Tenor_24Bit\
USBDriver directory.
Follow the steps in Windows to select the appropriate directory and continue the
installation.
At this point, the Board Status LED on the rear of the Tenor should turn green and the
software can be launched (see section 4.0).
User Manual
p. 5
Tenor Data Logger
Soft dB inc.
3.0 Hardware Description
The hardware unit of the Tenor acquisition system is based on a USB DSP/FPGA
acquisition board. It also includes an ICP conditioning board. The metal box that contains
the USB acquisition board is equipped with 12 BNC connectors for 8 inputs and 4 outputs.
The internal switches on the conditioning board allow selecting the Direct DC, Direct AC or
ICP input paths. Each input and output has a LED to indicate saturation or a low-level
problem.
Figure 2: Tenor Hardware Unit (front)
User Manual
p. 6
Tenor Data Logger
Soft dB inc.
Figure 3: Tenor Hardware Unit (rear)
3.1 Technical details
Here are the hardware technical details:
•
External board with a USB link for realtime acquisition
•
8 analog inputs and 4 analog outputs
•
Sampling rate of 48.8 kHz per channel
•
SNR: 105 dB (input) and 105 dB (output)
•
3 input types: Direct DC, Direct AC and ICP
•
Input dynamic range +-4.5 V
•
Output dynamic range (+-2V)
•
Anti-aliasing filter on outputs and inputs
Note: See Appendix B for more input/output specifications.
User Manual
p. 7
Tenor Data Logger
Soft dB inc.
3.2 LED information
The LED colour and description are presented in the following table:
Description of colour meaning
LED
Black
Red
Yellow
Green
Input
Not used
Saturated
Low Level
Used
Output
Not used
---
---
Used
Measuring/Overload
Acquisition OFF
Input(s) saturated
---
Acquisition ON
System Status
Board OFF
---
Software OFF
Software ON
Board Status (rear)
Board OFF
Board Error
Board ON
PC connected
Additional note for the Status Board LED:
• A Green LED means that the computer is connected to the Tenor unit and that the
drivers are operational.
• A Yellow LED means that either the computer is not connected to the Tenor unit,
or that the USB drivers are not operational. See Appendix A for more information.
• A Red LED means that the Tenor unit has detected an error. Try switching the
power supply off and on. If the Status Board LED remains red, contact Soft dB.
User Manual
p. 8
Tenor Data Logger
Soft dB inc.
4.0 Using the acquisition software
The next paragraphs present the set-up and acquisition portions of the software. The
instrument set-up functions and the acquisition interface will be presented in detail. Postprocessing functions are not covered in this section (this information is covered in section
5.0).
4.1 Launching the Tenor software
Connect the power supply to the Tenor unit using the “12Vdc/2.0A” connector at the rear
of the unit. Connect the Tenor unit to a computer using a USB cable. The Board Status
LED on the rear of the Tenor unit should turn green.
Select and launch the Tenor_24Bit software via the Windows menu, or at the default
directory C:\Program Files\Tenor_24Bit.
User Manual
p. 9
Tenor Data Logger
Soft dB inc.
4.2 Set-up interface
The Figure 4 shows the main interface just after launching the Tenor software.
Figure 4: Tenor Software (Set-up Tab)
The main interface has three tabs: 1) the set-up tab, 2) the acquisition tab and 3) the postprocessing tab. The set-up tab allows specifying the configuration of the instrument. Four
groups of parameters are presented in this tab (see next sections for details).
4.2.1 General Set-up
Figure 5: General Set-up section
User Manual
p. 10
Tenor Data Logger
Soft dB inc.
The general set-up group of parameters presents the application set-up.
4.2.2 Input Set-up
The input set-up is done through the following section of the set-up tab:
Figure 6: Input Set-up section
Set-up Parameters
Each input can be activated or deactivated using the green dots on the left. When
activated, the set-up controls of a specific input become available. The following table
explains the set-up parameters:
Parameter
Range (V)
Input Select
Description
This is the input range. This set-up is not adjustable.
There are three input types:
Direct DC: This input type can measure the DC signal (no high pass filter).
Direct AC: This input type uses a high pass filter at 0.5 Hz and is suitable for AC signal
measurements.
ICP: This input type includes an integrated circuit preamplifier (ICP) with a high pass
filter at 0.5 Hz. A compatible ICP microphone or accelerometer can be connected
directly to the BNC connector.
Input Description
This parameter is a simple text control that allows the user to specify a description of the
input. This information has no impact on the behaviour of the acquisition system.
Unit Name
This text control can be used to specify the name of the unit. The unit name is used by
the acquisition system to label of the global level, time and spectrum graphs. For
instance, if a Pa unit is specified by the user for input #1, the Y label of the Spectrum will
be: dB(Parms^2).
Unit dBref
The dB reference value is used by the interface for dB computation. For acoustic
measurement with a microphone the standard dB reference value is 2E 5
User Manual
p. 11
Tenor Data Logger
Soft dB inc.
measurement with a microphone, the standard dB reference value is 2E-5.
Sensitivity
This is the sensitivity of the input measured in mV/Unit. The sensitivity is used by the
interface to present a calibrated signal in the acquisition tab and post-processing
module. The sensitivity can be manually entered if the value is known, or automatically
determined through the use of the calibration function via the Cali(x) button (see next
paragraph for more information on this function).
Calibration Function
This function is used to determine the input sensitivity. The calibration task is supported by
a dedicated interface. Note that a microphone or accelerometer calibrator is required. The
interface of the calibration function is presented in Figure 7.
Figure 7: Calibration interface
Before starting the calibration measurement, the following calibrator parameters must be
set up:
Calibration level: The calibrator level can be defined in dB rms2 or as a linear rms value.
Use the menu on the right to specify if the calibrator level is in dB or a linear value.
User Manual
p. 12
Tenor Data Logger
Soft dB inc.
Frequency (Hz): This is the calibrator emission frequency (typically 1000 Hz in the case of
a microphone).
dBref: This is the reference value used for the dB computation (typically 2E-5 for a
microphone).
When the calibrator set-up has been done, the average time parameter must be set. A
short average of 5 seconds is usually appropriate.
Then, the averaging process can be launched with the button Start Cali.
At the end of the average, the interface computes the required sensitivity to set the
calibrator level to the specified frequency.
Click the Ok button to accept the new sensitivity value and return to the main interface.
Import/Save sensor bank
The Import and Save sensor bank functions are very useful for simplifying the input set-up.
The save function allows saving the complete configuration of a specific input (Range(V),
Input Selection, Input Description, Unit Name, dBref and Sensitivity). The Import function
allows recalling the input configuration saved in a .sen file.
Before starting to use the Tenor system, we suggest taking some time to generate a .sen
file for all your sensors.
Note also that the entire set-up of the Tenor instrument can be saved in a .cfg file and
recalled from one measurement session to another. This configuration file created with the
Save .cfg button also includes the complete set-up of all inputs.
User Manual
p. 13
Tenor Data Logger
Soft dB inc.
4.2.3 Output Set-up
To activate the output on the Tenor system, the user must select the output(s) with the
green dot and specify the path of a wave file that contains the signal to generate. Read
sections 4.2.4 and 4.3 for more information on the selection and generation of an output
wave file. Output selection is done through the green dots of the following section of the
set-up tab.
Figure 8: Output set-up section
The Current Output File Info indicator displays the parameters of the currently-selected
output wave file. Be sure that the number of channels of the selected wave file matches
the number of selected outputs before launching the acquisition. The sampling frequency
specified in the wave file is not the sampling frequency used during acquisition : whatever
the wave sample rate, a sample rate of 48.8 kHz will be used. To avoid frequency shift
during generation with the Tenor, make sure the wave file has been created using a
sampling frequency of 48.8 kHz.
4.2.4 Input and Output Paths
The Tenor system uses the wave file format for recording and the signal generation. Both
the input and output file paths can be defined with the Output File Path and Input File Path
browsers (use the folder icon to access the browser).
If the acquisition is started with the Start/Stop (with input log) button, the interface creates
a wave file to save the input signals in 32-bit format. If an output wave file is specified, the
interface sends the signals in the wave file to the selected outputs (even in no log
acquisition mode). The output signals are always generated at the Tenor sample rate. Be
sure to use a wave file with the same sampling frequency to avoid frequency shift during
generation with the Tenor.
The Tenor system includes a wave file generation module that can be used to create a
multi-channel wave file for the outputs (see section 4.3 for more details). Once the output
file path is defined, the Current Output File Info indicator displays the parameters of the
current output wave file (number of channels, sample rate and the time length).
User Manual
p. 14
Tenor Data Logger
Soft dB inc.
The interface uses the extended wave format that supports multi channels and continuous
sampling frequency adjustment. Windows with DirectX 8.0 module supports this format.
Figure 9: Input and Output Paths section
Note: If the Auto-Increment option is used, the Tenor software automatically adds a
number to the input wave file name at each new measurement. This way, the name must
be defined only for the first measurement. All others measurements will be logged in a
wave file with a three-digit extension number. For instance, if the name specified is
test.wav and if the Auto-Increment option is set to on:
First measurement file name: test.wav
Second measurement file name: test_001.wav
Third measurement file name: test_002.wav
…
User Manual
p. 15
Tenor Data Logger
Soft dB inc.
4.3 Wave Files Generator
The Tenor system includes a dedicated module for creating a multi-channel output wave
file. The next figure presents this module.
Figure 10: Wave Files Generator interface
The sample rate is the current sample rate of the instrument: it is not adjustable here. Here
is the description of the controls:
This is the duration in seconds, of the wave file to be generated.
This is the global delay defined as the number of samples. The wave file will include this
number of zero on each activated channels before the beginning of the output signal. A
set-up of 27 samples is recommended. This way, the global group delay between the
outputs and inputs is exactly compensated.
User Manual
p. 16
Tenor Data Logger
Soft dB inc.
This is the output file path. At the start-up of the generator interface, the path is set to the
current output file path of the main interface. The user can change the file name with the
folder icon.
Each output channel can be activated with the green dot. Then, the output signal
parameters are accessible for this selected channel. The following table presents the
available signal types and their set-up parameters:
Signal type
Amplitude (volts)
Frequency (Hz)
Duty cycle (%)
Standard
deviation
Sine Wave
Maximum 2V
Sine frequency
---
---
Triangle Wave
Maximum 2V
Triangular pattern
frequency
Square Wave
Maximum 2V
Square pattern
frequency
The percentage of
time a square wave
remains high versus
low over one
period.
Saw tooth Wave
Maximum 2V
Saw tooth pattern
frequency
---
---
Uniform white Noise
Maximum 2V
---
---
---
Gaussian White
Noise
Maximum 1V*
---
---
Standard deviation
of the distribution
Periodic Random
Noise
Maximum
0.0104167V**
---
---
---
User Manual
p. 17
Tenor Data Logger
Repetitive Impulse
pattern
Soft dB inc.
Maximum 2V
Frequency of the
repetition
---
---
* For Gaussian White Noise, the maximum output voltage is limited to 1V instead of 2V.
The distribution of this type of noise can exceed the nominal requested amplitude. A
maximum of 1V for the nominal amplitude allows avoiding the saturation for an output with
a dynamic range of 2V.
** This value is for a block length of 4096 (or 2048 FFT number of lines). This is the
maximum amplitude at each frequency. With this maximum amplitude for each frequency
of the noise, the signal will cover the entire output dynamic of 2V.
This control allows specifying the block length during the wave file generation. This control
is especially important for the pseudo-random noise. Effectively, to take advantage of the
pseudo-random noise, the acquisition block length must fit the generator block length.
When all output signal parameters are set and the output file path is specified, the user
can click on the Generate .wav button to create the wave file.
These buttons allow saving and recalling the complete set-up of the wave generator. Also,
when the Generate .wav button is used, the wave generator interface creates a .wgs file
that contains the generator set-up in the same folder as the wave file to be created. This
can be useful for determining the contents of a wave file generated by this module.
Note: The post-processing module can be used to apply some treatment on the output
wave file. For instance, a high pass filter can be applied to a white noise to remove the low
frequencies. To do that, simply open the wave file with the post-processing module (see
section 5.0 for more details).
User Manual
p. 18
Tenor Data Logger
Soft dB inc.
4.4 Launching the acquisition and monitoring
When the set-up is done, the user can click on the acquisition tab and launch the
acquisition. During acquisition, the interface presents the following information:
1) Input dynamic range and the global level of all selected inputs.
2) Input saturation and percentage of saturation of all selected inputs.
3) Up to four graphs of either the time signal, the instant power spectrum, the average
power spectrum or the global levels historic. The user can select the input/output
channel for each graph.
4) The acquisition buffer state. It allows verifying the real time acquisition/data
logging. Most of the time the real time acquisition/data logging is achieved, but
some events like a background software request, an Internet access or a standby
operation can limit the real time. The acquisition buffer is there to avoid the lost of
data during those special events (the length of the buffer is 84k samples by
channel). When the buffer is full, the real time acquisition is not achieved anymore.
In this case, the acquisition buffer state turns red. Note: some computers are not
enough powerful to allow the real time acquisition on all channels. In this case, we
suggest disabling the display (control Graph Update? At OFF) during the
acquisition to regain the real time acquisition.
During acquisition, the set-up portion of the instrument is no-longer available and the
interface switches to the acquisition tab. The user must stop the acquisition to change the
instrument set-up. The acquisition can launched in two modes:
1) No Log mode: In this mode, no wave file is created by the interface during the
acquisition. However, output logging is activated if an output wave file has been specified.
This mode is useful for testing the input dynamic and for using the Tenor as a simple
generator.
2) Log mode: In this mode, the instrument generates a wave log file. Also, output logging
is activated if an output wave file has been specified.
User Manual
p. 19
Tenor Data Logger
Soft dB inc.
The next figure presents the acquisition tab of the main interface:
Figure 11: Acquisition tab of the main interface
The following sections explain in detail the indicators and functions of the acquisition tab.
4.4.1 Dynamic and Saturation Indicators
The dynamic and saturation indicators of the acquisition tab along with the LED indicators
of the Tenor unit are very useful to detect the dynamic range problems. These indicators
are located in the bottom of the acquisition tab (be sure to select the Dynamic Range Tab
and not the Global Levels Tab).
User Manual
p. 20
Tenor Data Logger
Soft dB inc.
Figure 12: Dynamic range and saturation indicators
Each dynamic range indicator has two bars. The yellow bar is the maximum peak value
measured since the beginning of the acquisition. This yellow bar turns red if saturation
occurs. The blue bar is the current peak value of the current acquisition block. The peak
values are presented in dBFS. This is the dB computed with the full-scale peak value as a
reference:
Where I24peak is the peak value of the current acquisition block in the range of a signed
decimal 24-bit number (-223 and +223). The dB calculation is done with the full-scale peak
value reference: 223.
When the input type selection is Direct AC or ICP, the interface removes the DC
component of the input signal before the dBFS computation. In this way, the dynamic
indicator presents the range occupied by the AC part of the signal. For the Direct DC input
selection, the DC is included in the dBFS computation.
In some rare circumstances when the DC signal is relatively high for the Direct AC or ICP
input selections, saturation can occur before the DC subtraction. In these circumstances,
no AC saturations are detected but a saturation problem is present. To avoid this
saturation detection problem, the interface tests the saturation before removing the DC
component. If saturation is detected at this stage, the number of the corresponding input
on the top of the dBFS indicator turns red.
In addition to the dBFS indicators, the interface computes the percentage of saturation that
occurs on all activated inputs. This information is useful in determining the degree of the
saturation problem. A low saturation percentage for a specific channel can be acceptable;
some functions of the post-processing interface can be used to avoid the saturations in the
analysis.
The following button allows resetting the dBFS and percentage indicators:
User Manual
p. 21
Tenor Data Logger
Soft dB inc.
The LEDs on the Tenor box are also useful for analyzing the saturation and low signal
level problems. The following table explains the meaning of the colour for input and output
LEDs:
LED colour description
Black
Red
Yellow
Green
Inputs
Not used
Saturated
Low Level
Used
Outputs
Not used
---
---
Used
4.4.2 Global Indicators
The global level and the dynamic range indicators share the same tab at the bottom of the
acquisition interface.
Figure 13: Global Level indicators
The global level indicators present the calibrated global level of all activated inputs. The
scale of the indicator is automatically set by the interface following the minimum and
maximum global levels. The user can select a dB, dBA or linear display with the control at
the upper left of each global level indicator.
The input number turns red when saturation occurs on a specific input. The user can use
the Reset Sat. Indicators button to reset the saturation state (see section 4.4.1 for more
detail).
User Manual
p. 22
Tenor Data Logger
Soft dB inc.
4.4.3 Time/Spectrum Indicators
During acquisition, four curves are available to display the time signal, the global level
historic or the spectrum of a selected input/output. These four curves are presented in two
separate graphs. The top graph presents the A and B curves while the bottom graph
presents the C and D curves.
Figure 14: Graph for A and B curves
For both AB and CD graphs, the user can select the input/output and the type of curve.
Some other functions allow controlling the display and averaging process of AB and CD
graphs. The following table describes these functions:
Fonction
Description
This button allows making an auto scale of the Y-axis for the A/B
curves. The auto scale is done once and the Y scale remains
fixed after that. As described later in this section, there are some
advanced functions that allow better control of X and Y scale.
This control allows selection of a linear, a dB or a dBA display for
both Y-axes on the A/B graph.
These controls allow selecting the input/output for the A and B
curves.
The type of display for the A and B curves are: 1) Time signal 2)
Global Level Historic 3) Instantaneous Spectrum 4) Spectrum
(Fast Exponential Average) 5) Spectrum (Slow Exponential
Average) and 6) Average Spectrum. The slow exponential
average uses a time constant of one second while the fast
exponential average uses a time constant of 1/8 of a second.
Note: The Global Level Historic graph is limited to 6500 data to
minimize the PC memory usage. It means about 9 minutes of
historic at 48.8 kHz.
This control allows resetting the global level historic or the
spectrum average of A/B curves.
User Manual
p. 23
Tenor Data Logger
Soft dB inc.
This control allows selecting a linear or log scale for the X axis.
This control state is not used when the time or historic graphs are
selected.
Advanced display functions
Some advanced functions can be used for both AB and CD graphs to manage the X and Y
scale settings. For instance, an autoscale mode can be set for both Y axes by rightclicking on the Y scale as shown in the next figure:
Figure 15: Set the AutoScale mode for Y-axis
The autoscale for the X-axis can be activated by right-clicking on the X scale:
Figure 16: Set the AutoScale mode for X-axis
When AutoScale mode is not set, the user can change the minimum and maximum of all
graph scales by editing these values directly on the scales as shown on the next figure:
Figure 17: Edit Y minimum value on the Y scale
User Manual
p. 24
Tenor Data Logger
Soft dB inc.
4.4.4 Export Graphs
When the acquisition has been completed, the Export Graph function can be used to save
the data of all four curves of the AB and CD graphs.
The data is stored in a text format file as described in the following table:
Graph AB
Input/output A(name)
Input/output B(name)
X unit name (AB)
Y unit name (A)
Y unit name (B)
Xab(1)
Ya(1)
Yb(1)
Xab(2)
Ya(2)
Yb(2)
…
…
…
Xab(n)
Ya(n)
Yb(n)
Graph CD
Input/output C(name)
Input/output D(name)
X unit name (CD)
Y unit name (C)
Y unit name (D)
Xcd(1)
Yc(1)
Yd(1)
Xcd(2)
Yc(2)
Yd(2)
…
…
…
Xcd(n)
Yc(n)
Yd(n)
A tab character separates the columns and the text file can be opened directly in a
standard spreadsheet program like Microsoft Excel.
User Manual
p. 25
Tenor Data Logger
Soft dB inc.
5.0 Post-Processing
The post-processing tab includes a complete software tool allowing the analysis of a multichannel wave file. The post-processing can be used even if the external Tenor unit is not
present. The post-processing interface accepts wave files recorded with the Tenor
software and standard wave files. Tenor-recorded wave files always have an associated
configuration file that contains the complete configuration of the instrument. This
configuration file is automatically saved in the same folder as the wave file at the beginning
of the recording. This configuration file allows recovering a calibrated time signal. So, any
wave files not recorded with the Tenor system will not be calibrated (the Change Input Setup function can be used to calibrate the signal, see section 5.2.7 for more details).
The post-processing module is accessible in the Post-processing tab:
Figure 18: Main Post-Processing Interface
Note: when the Post-processing tab is selected, the interface automatically asks for a .wav
file.
User Manual
p. 26
Tenor Data Logger
Soft dB inc.
Peak and time signal graphs
The approach used by the post-processing module allows the analysis of a large wave file
(the wave standard allows a maximum size of 2GB for a wave file: about 3.0 hours at 48.8
kHz). The use of a streaming approach solves the memory limitation problem met when a
large wave file is used. This means that the whole signal contained in the wave file is
never completely loaded in the PC’s memory. The post-processing always reads the signal
block-by-block. With this streaming technique, the memory requirement problem is solved
but the user loses the overview of the entire signal contained in the wave file. To resolve
this problem, the post-processing interface presents the peak values of the entire wave
file. The peak value curve always contains 8192 points. This means that the entire signal
is divided in 8192 blocks and the peak values of each block are used to form the peak
value curve. This way, the user has an overview of the signal, and low and high portions of
the signal are easily detected.
For a more detailed view of some portions of the signal, the post-processing presents a
time signal curve with a maximum length of 60 seconds (defined by the Length of Signal(s)
control). The starting point of this time signal is specified with the green cursor of the peak
value curve.
The peak graph also has a blue and red cursor. The red cursor indicates the saturation
limit and the blue cursor is used for playback (see section 5.1) and extraction fonctions
(see section 5.4).
Both graphs can be saved in a text file format using the following button:
Signal statistic data
The main interface also presents the standard statistics of the entire signal (or framework):
Channel selection control
Channel selection is done via the Ch# Selection control:
User Manual
p. 27
Tenor Data Logger
Soft dB inc.
Cursor legend activation
The next figure shows how to activate the cursor legend. The cursor legend is activated by
right-clicking the graph. The cursor legend will be presented at the upper right corner of
the graph. Note that all post-processing module graphs have a cursor legend that can be
activated this way.
Figure 19: Activate the cursor legend with a right click
The cursor legend presents the cursor’s X position and Y value. The user can move the
cursor to obtain a precise Y value reading at any X position. The next figure shows the
time graph with the cursor legend activated.
Figure 20: Time graph with the cursor legend activated
Functions Tab
The Tab at the bottom of the main post-processing interface contains the analysis
functions. A playback function is also available via the Play Wave button at the top right
corner of the peak curve. The next sections contain detailed descriptions of the playback
function and all other analysis functions.
User Manual
p. 28
Tenor Data Logger
Soft dB inc.
5.1 Play Wave Function
This function can be used to playback any portion of the selected channel. The blue cursor
of the peak curve is used to specify the playback starting point. Playback is started with
the Play Wave control:
During playback, the user can adjust the volume or pause playback by using the buttons in
the following dialog box:
Figure 21: Main Post-Processing Interface
A forward button can be used during the playback and the speed of the forward can be
adjusted with the sliding control.
User Manual
p. 29
Tenor Data Logger
Soft dB inc.
5.2 Analysis Functions Tab
The post-processing module includes six analysis functions, that are applied on the entire
selected framework (see section 5.4 for more information about the framework selection).
These functions are grouped under the Analysis Tab at the bottom of the main postprocessing interface.
The next sections describe these functions in detail.
5.2.1 Global Historic
This function allows building the global level historic with an adjustable time resolution for
the selected channel. The global level calculation is done with power spectra using blocks
with a number of samples adjusted to match the requested time step. The power spectrum
approach is used to facilitate the A weighting and integration options. The interface of the
Global Historic function is presented in the next figure.
User Manual
p. 30
Tenor Data Logger
Soft dB inc.
Figure 22: Global level historic module interface
At any time, the computation parameters can be changed and the recompute button can
be used to update the results.
The Do Graph Autoscale button allows adjusting the Y and X scales for the new data of
the global historic graph.
The next table explains the computation parameters:
Computation parameter
Description
The time step of the global level historic can be
adjusted between 50ms and 60000ms.
The dB/Lin. parameter allows choosing the amplitude
scale format. The choices are dB, dB(A), Lin. rms, Lin.
2
peak or Lin. rms .
The Integration parameter allows application of simple
or double integration in the frequency domain for an
acceleration measurement. For the simple integration
option, the power spectrum is divided by jω. For the
double integration option, the spectrum is divided by –
ω2 .
This is the time window used for the power spectrum
computation.
User Manual
p. 31
Tenor Data Logger
Soft dB inc.
This parameter allows adjusting the overlap between
the time blocks used for the global levels historic
calculation. This parameter can be adjusted from 0%
to 90%. This parameter is used to increase the
number of blocks and the time resolution of the
historic graph. We suggest to keep this parameter to
0% if standard acoustic signals are used. A larger
overlap can be used to avoid aliasing problem when
the signal is impulsive.
The Export .txt function allows exporting the global historic data in text format.
5.2.2 Average FFT
This function computes the average power spectrum for the entire framework of the
selected channel. First, the time signal of the entire framework is divided into blocks of an
adjustable number of samples. The power spectrum is computed for each block and a
linear average is obtained. Also, the Average FFT module allows the overlap of the blocks
used for the average. For instance, the use of an overlap of 66% and the Hanning time
window is a classic set-up that compensates for data lost in the time window.
The interface of the Average FFT function is presented on the next figure.
Figure 23: Average FFT interface
User Manual
p. 32
Tenor Data Logger
Soft dB inc.
At any time, the computation parameters can be changed and the recompute button can
be used to update the results.
The Do Graph Autoscale button allows adjusting the Y and X scales for the new data of
the average power spectrum graph.
The next table explains the computation parameters:
Computation parameter
Description
This is the number of lines of the average power
spectrum. The selections are: 1024, 2048, 4096 or
8192 lines. The FFT calculation is done with a block
size of 2*Nbr Lines.
This is the time window used for the power spectrum
computation.
This parameter allows adjusting the overlap between
the time blocks used for the average power spectrum
calculation. This parameter can be adjusted from 0%
to 90%. This parameter is used to increase the
number of blocks for the average and to compensate
for the loss of data in the time window. The classic
set-up is an overlap of 66% and the Hanning window.
This is the type spectrum. Narrow Band, octave, 1/3octave and 1/12-octave set-ups are possible. The
octave, 1/3 octave and 1/12-octave types are
computed with a frequency bank of filters applied on
the narrow band spectrum. To avoid low frequency
imprecision, we suggest using the maximum number
of lines (8192) set-up when an octave type is selected.
The dB/Lin. parameter allows choosing the amplitude
scale format. The choices are dB, dB(A), lin. rms, lin.
peak, lin. rms2, ISO2631-XY (dB), ISO2631-Z (dB),
ISO2631-XY (lin. rms et lin. peak) and ISO2631-Z (lin.
rms et lin. peak). The ISO2631 selections allow
applying standard frequency weighting to the average
power spectrum.
The Integration parameter allows applying a simple or
double integration in the frequency domain for an
acceleration measurement. For the simple integration
option, the power spectrum is divided by jω. For the
double integration option, the spectrum is divided by –
ω2 .
User Manual
p. 33
Tenor Data Logger
Soft dB inc.
The function Export .txt allows exporting the average power spectrum in text format.
5.2.3 Statistics
This module allows computing the standard Lx% statistics on the global level historic for
the entire framework of the selected channel. The Statistic function starts by computing the
global levels of the framework with an adjustable time resolution. The global level
calculation is done with power spectra using blocks with a number of samples adjusted to
match the requested time step. A Hanning time window is used for the FFT computation.
The power spectrum approach is used to facilitated the A-weighting and integration
options. When the global level historic is computed, the Statistics module computes the
statistics of the global levels and presents a graph of the sorted global levels.
The interface of the Statistics function is presented in the next figure.
Figure 24: Statistics interface
User Manual
p. 34
Tenor Data Logger
Soft dB inc.
At any time, the computation parameters can be changed and the recompute button can
be used to update the results.
The next table explains the computation parameters:
Computation parameter
Description
The statistics are computed for all global levels of
historic. The time step of the global level historic can
be adjusted between 50ms and 1000ms.
The dB/Lin. parameter allows choosing the amplitude
scale format. The choices are dB, dB(A), lin. rms, lin.
2
peak or lin. rms .
The Integration parameter allows applying simple or
double integration in the frequency domain for an
acceleration measurement. For the simple integration
option, the power spectrum is divided by jω. For the
double integration option, the spectrum is divided by –
2
ω.
The Export statistic function allows exporting the statistics in text format.
5.2.4 Waterfall graph
The Waterfall graph module presents the power spectra for the entire time-length of the
framework. The Waterfall graph module computes the power spectra with an adjustable
frequency resolution. Each power spectrum is presented in a three dimensional graph
along a time axis. As well as the numerical amplitude scale, a colour scale is employed to
help in visualizing the high and low levels of the power spectrum amplitudes. The three
dimensional graph can be rotated, zoomed and moved. The next figure presents the
waterfall interface.
User Manual
p. 35
Tenor Data Logger
Soft dB inc.
Figure 25: Waterfall interface
At any time, the computation parameters can be changed and the recompute button can
be used to update the results.
The next table explains the computation parameters:
Computation parameter
Description
This is the number of lines of the average power
spectra. Possible selections are 1024, 2048, 4096 or
8192 lines. The FFT calculation is done with a block
size of 2*Nbr Lines. For a waterfall graph, a large
number of lines mean a poor time resolution.
Conversely, greater time resolution results in lower
frequency resolution. Note that the overlap parameter
can be used to limit this problematic.
This is the time window used for the power spectrum
computation.
This parameter allows adjusting the overlap between
the time blocks used for the power spectrum
calculation. This parameter can be adjusted from 0%
to 90%. This parameter can be used to increase the
time resolution of the waterfall graph.
The dB/Lin. parameter allows choosing the amplitude
scale format. The choices are dB, dB(A), lin. rms, lin.
peak or lin. rms2.
User Manual
p. 36
Tenor Data Logger
Soft dB inc.
The Integration parameter allows applying a simple or
double integration in the frequency domain for an
acceleration measurement. For the simple integration
option, the power spectra are divided by jω. For the
double integration option, the spectra are divided by –
2
ω.
At the time of the computation and if the framework has a considerable amount of data,
the interface asks the user for using a spectrum averaging:
Figure 26: Dialog box for spectrum averaging
If the user clicks Yes, the software will perform a spectrum averaging to reduce the
amount of data. In this case, the time resolution of the waterfall graph will be reduced.
However, the user can adjust the averaging rate with the button Number of spectra. Then,
the number of spectra and the averaging rate can be adjusted with the following sliding
control:
Figure 27: Dialog box for adjusting the number of spectra
The Adjust scales button allows setting the frequency and amplitude scales of the waterfall
graph. Unlike on the other two-dimensional Tenor software graphs, minimum and
maximum scale values cannot be changed directly on the waterfall graph. The minimum
and maximum values for each scale can be changed using the following dialog box:
User Manual
p. 37
Tenor Data Logger
Soft dB inc.
Figure 28: Dialog box for waterfall graph scale adjustment
The frequency and amplitude scales can be adjusted through the dialog box shown in
Figure 28. The frequency scale can also be put in logarithmic mapping mode. Note that no
options are available for the time scale. The waterfall graph is always generated for the
entire framework. The starting point and the length of the framework can be adjusted in the
main interface (see section 5.4).
The Export .txt function allows exporting the waterfall data in a text format.
5.2.5 FRF (Hx)
The FRF (Hx) module allows computing the average frequency response between
channels. The following figure presents the FRF module interface:
User Manual
p. 38
Tenor Data Logger
Soft dB inc.
Figure 29: Interface of the FRF module
At any time, the computation parameters can be changed and the recompute button can
be used to update the results.
The FRF interface has two graphs: 1) The FRF graph to present the amplitude (or the
phase) versus the frequency, and 2) the coherence graph. Three types of FRF can be
computed:
H1 using this equation:
H1=y/x=Sxy/Sxx
H2 using this equation:
H2=y/x=Syy/Sxy
H3 using this equation:
H3=y/x=(H1+H2)/2
Where x is the reference channel and y the second channel. In theory, all Hx must give the
same result. However, when the FRF contains resonance and/or anti-resonance, the result
can vary from one equation to another. In effect, noise on the X or Y channel on the antiresonance or resonance can distort the results. The H1 equation is better when the noise
is on the Y channel while the H2 equation gives better results when the noise is on the X
channel.
User Manual
p. 39
Tenor Data Logger
Soft dB inc.
The coherence graph allows determining if the signal measured on both channels is
linked. The equation used for the coherence is:
Coherence=H1/H2=Sxy2/(Sxx*Syy)
Tthe Do Graph Autoscale button allows adjusting the Y and X scales of both the FRF and
coherence graphs.
The next table explains the computation parameters:
Computation parameter
Description
This is the number of lines of the average FRF.
Possible selection are 1024, 2048, 4096 or 8192 lines.
The FRF calculation is done with a block size of 2*Nbr
Lines.
This is the time window used for the Sxx, Syy and Sxy
computation.
This parameter allows adjusting the overlap between
the time blocks used for the FRF calculation. This
parameter can be adjusted from 0% to 90%. This
parameter is used to increase the number of block
used for the average calculation and to compensate
for the loss of data that causes the time window. The
classic set-up is an overlap of 66% and the Hanning
window.
The dB/Lin. parameter allows choosing the amplitude
scale format. The choices are dB or Lin.
This parameter allows selecting the Hx (H1, H2 or
H3). Refer to the beginning of this section for
computation technique detail. H1 must be used if
noise is on the second channel while H2 must be used
if noise is on the reference channel. H3 is an average
of both H1 and H2 and can be used if the noise is on
both channels.
These controls allow selecting the reference channel
(x) and the second channel (y).
User Manual
p. 40
Tenor Data Logger
Soft dB inc.
or
These controls allow the integration of the inputs in
the FRF calculation process.
This control can be used to select the format of the Y-axis for the FRF graph. The
amplitude, phase (deg./rad), Im and Re formats can be used.
The function Export .txt allows exporting the FRF (the Phase (Deg./Rad), Amplitude, Im
and Re) and the coherence data in a text format.
5.2.6 ISO2631
This function applies a filter and computes the statistics on three selectable channels
following the ISO2631 standard. The next figure presents the interface of the ISO2631
module:
Figure 30: Interface of the ISO2631 function
User Manual
p. 41
Tenor Data Logger
Soft dB inc.
The ISO2631 standard has one filter for the XY-axes and another filter for the Z-axis. The
following curves present the frequency response of these filters.
Figure 31: Frequency responses of ISO2631 filters
At start-up, the Compute ISO2631 button is yellow. This means that the ISO2631 filters
have not been applied and the statistics are not up-to-date. After computation, button
Compute ISO2631 the turns grey to indicate that the filtering operation has been done and
the statistics are up-to-date. Use the X,Y and Z tab to see the statistics for all axes.
The Export .txt function allows exporting the X,Y and Z statistics in text format.
User Manual
p. 42
Tenor Data Logger
Soft dB inc.
5.2.7 Change Inputs Set-up
This function allows changing the input sensitivity, the input description, the unit name and
the dB reference set-up. This function has been added to allow the calibration of an
existing wave file, which is not recorded with the Tenor system. When opening an external
wave file, the Tenor system generates a standard associated configuration file with an
input sensitivity of 1. Then, the function Change Inputs Set-up can be used to change the
default sensitivity to obtain a calibrated signal. We suggest to estimate the sensibility
correction with a spectrum analysis through the function Average FFT. The dialog box to
change the inputs set-up is shown on the next figure:
Figure 32: Dialog box of the Change Inputs Set-up function
The input sensitivities can be changed with the Sensitivity control or using the ±dB control
if the dB correction value is known in dB.
Note: the Start Time control allows changing the starting time of the wave file. This
modification can be useful if absolute time scale for the global historic graph is desired.
User Manual
p. 43
Tenor Data Logger
Soft dB inc.
5.3 Filter and Integration Tab
The Filtering and Integration tab at the bottom of the main post-processing interface
includes two filter functions that can be applied across the entire selected framework (refer
to section 5.4 for more information about the framework selection).
The Filter function is a generic filtering module while the Integral x(t) function allows
making simple or double-time integration on an acceleration signal. Both functions filter the
signal since the Integral x(t) makes the time integration with a filter.
A streaming technique is used to apply a filter on the entire framework. Both filtering
functions use the current wave file as a source for the filter and save the filtered signal in a
new wave file. The filtering operation starts at the beginning of the framework and is done
on the entire framework. If the current framework does not cover the entire signal of the
original wave file, the filtering operation will generate a smaller filtered wave file that
contains only the filtered signal of the selected framework. In this case and after a filtering
operation, the starting point of the framework is automatically reset to zero and the entire
filtered signal is presented on the peak value curve. Note that the original wave file is
always conserved on the PC’s hard disk.
Note: After the filtering operation, the beginning of the signal can be distorted because of
the impulse response of the filter applied. We suggest removing the beginning of the time
signal by using the time extraction function (see section 5.4 for details).
The next two sections describe the filtering functions in detail.
User Manual
p. 44
Tenor Data Logger
Soft dB inc.
5.3.1 Filter
The Filter function is very useful for removing some frequency components on a group of
selected channels. Some typical tasks that can be done with this function are a DC filter, a
notch filter to remove the 60 Hz and its harmonics and a low-pass filter to remove highfrequency noise for clearer playback. This function has a filter design interface, which is
presented in the next figure.
Figure 33: Filter function interface
The frequency response graph represents the filter response for the current filter
parameters. You don’t have to use any button to update the frequency response graph;
the graph is automatically updated when the filter parameters change. The filter
parameters are described in the following table:
Parameter
Description
There are five available filter types: 1) ButterWorth
2) Chebyshev 3) Inverse Chebyshev 4) Elliptic and
5) Bessel.
The filter function control allows selecting a Lowpass,
Highpass, Bandpass or Bandstop filter. When a
Lowpass or Highpass filter is selected, only the Fc low
parameter is available. The Fc high parameter is
available for the Bandpass and Bandstop selections
only.
User Manual
p. 45
Tenor Data Logger
Soft dB inc.
This parameter allows specifying the cut-off frequency
of Lowpass and HighPass filters and the low cut-off
frequency of Bandpass and Bandstop filters.
This parameter allows specifying the high cut-off
frequency of the Bandpass and Bandstop filters. This
parameter is not used for the Lowpass and Highpass
selections.
This is the filter order. This parameter is available for
all filter type selections.
This parameter is used only for the Elliptic and
Chebyshev filter types. This parameter is the tolerable
passband ripple of the filter. It must be greater than
zero and expressed in decibels.
This parameter is used only for the Elliptic and Inverse
Chebyshev filter types. This parameter is the desired
attenuation in the stop band of the filter. It must be
greater than zero and you must express it in decibels.
All filter parameters can be saved and recalled using these buttons. Note that the filter
interface automatically creates a .flt file when the filter operation is launched with the Apply
Filter and Quit button. This automatically saved .flt file will have the name of the filtered
wave file and it will be in the same folder. This feature is very useful for following the
filtering historic of a wave file.
This control allows selecting the group of channels to which the filter will be applied. Note
that the non-filtered channels will be included in the wave file created by the filter function.
This button launches the filtering operating. The original wave file will be used as a source
for the filter and the filtered signal will be saved in a new wave file. Also, a .flt file
containing the filter parameters is automatically created in the same folder that the filtered
wave.
User Manual
p. 46
Tenor Data Logger
Soft dB inc.
5.3.2 Integral x(t)
This function performs a time integration on the signal of a group of selected channels.
Some modules in the analysis functions tab allow integration in the frequency domain. This
function is useful for analyzing the signal coming from an accelerometer, especially if the
speed and position must be analyzed in the time domain. There are many available
techniques for performing time integration. We select the filtering approach, which has the
advantage of being numerically stable. So, a simple first order or second order low-pass
filter is used to perform a simple or double integration. The user must specify a cut-off
frequency for the filter. We suggest using an Fcut(Hz) parameter that fits with the sensor
used. A typical accelerometer sensor has a flat frequency response that starts at around
20 Hz. The interface of the Integral x(t) function is shown in the next figure:
Figure 34: Time integration function interface
The parameters are described in the following table:
Parameter
Description
A simple or double operation can be done. A first
(simple integration) or second order (double
integration) filter is used following this parameter.
This is the cut-off frequency for the filter used in the
integration process. We suggest using an Fcut(Hz)
parameter that fits with the sensor used. A typical
accelerometer sensor has a flat frequency response
that starts at around 20 Hz.
User Manual
p. 47
Tenor Data Logger
Soft dB inc.
This control allows selecting the group of channels for which the integration will be done.
This button launches the integration operation.
User Manual
p. 48
Tenor Data Logger
Soft dB inc.
5.4 Signal Extraction Tab
The signal extraction tab includes a function for extracting a portion of the signal. This
feature is very useful for analyzing a portion of the wave file and for removing the
beginning of a wave file after a filtering operation. Also, a saturated portion of the signal
can be excluded for better analysis.
The extraction can be cancelled at any time, and the entire framework of the original wave
file will be recovered. The extraction technique is based on the use of file pointers. This
means that the start and end-points of the selected framework are sample numbers in the
wave file. This way, the original wave file is never changed and an Undo operation is
always available.
When an extraction has been done using the Extract between cursors function, all
functions and modules of the post-processing interface will work with the new start and
end-points of the framework. The save .wav function will also take into account the starting
point and the ending points. After saving for instance, the new wave file will contain only
the selected portion of the signal of the original wave file.
Here is the detail of the extraction functions:
Function
Description
This function changes the start and end-points of the
framework following the blue and green cursor
positions on the peak value. The start and end points
are changed for all channels. Use the Undo Extraction
function to cancel the extraction.
This function cancels the extraction(s) and resets the
start point to zero and the end point to the end of the
wave file. For multiple extractions, the undo operation
always retrieves the entire wave file signal and not the
preceding selection.
User Manual
p. 49
Tenor Data Logger
Soft dB inc.
Extraction example
The objective of this example is to keep the signal between time 00:03:50 and 00:06:00.
First, the blue and green cursors are moved to the desired start and end-points:
Figure 35: Extraction example (first step: cursor positioning)
Then, the Extract between cursors button is used to launch the extraction. After extraction,
the peak value graph looks like this:
Figure 36: Extraction example (Peak value graph after the extraction)
User Manual
p. 50
Tenor Data Logger
Soft dB inc.
5.5 Export/Save Tab
The Export/Save tab includes five functions to export the time signal data to a text file, a
wave file or a SDF file (Standard Data File from HP).
Here is a description of the Export/Save tab functions:
Function
Description
This function exports the selected channel to a text
file. The exported signal is calibrated and the format of
the text file can be adjusted through a dedicated
dialog box*. This function saves only the selected
framework.
This function exports all channels in a text file. The
exported signals are calibrated and the format of the
text file can be adjusted through a dedicated dialog
box*. This function saves only the selected framework.
This function allows saving the selected channel in a
wave file. This function also saves the associated
configuration file for further analysis with the postprocessing interface.
This function allows saving all channel signals of the
selected framework in a wave file. This function also
saves the associated configuration file for further
analysis with the post-processing interface.
This function allows saving all channel signals of the
current selected .wav file in a SDF format. The SDF
format is a standard for the major spectrum analyzer
manufacturers.
*When a text format is chose for the export, the following dialog box is used to specify the
format of the data in the file:
User Manual
p. 51
Tenor Data Logger
Soft dB inc.
Figure 37: Text format dialog box
The data can be saved in line or column and the delimiter can be 1) a standard tab 2) a
semi-colon (;) or 3) a custom delimiter. If the custom delimiter option is selected, the user
has to specify the custom delimiter character.
User Manual
p. 52
Tenor Data Logger
Soft dB inc.
Appendix A: Tenor Driver and Software Installation Procedure
!
The Tenor unit is not automatically recognized by
Windows.
Follow each step below precisely to ensure proper
installation of the system.
1) Execute the Tenor24Bit_DataLoggerVer2_0.exe file (see installation disk provided with
the Tenor).
2) Follow the installation procedure. By default, the Tenor software is installed in the
C:\Program Files\Tenor_24Bit directory. Do not launch the software at this point; the
USB driver has to be installed beforehand.
3) Apply power to the Tenor unit (input 12VDC in the rear of the unit). Use the power pack
provided by Soft dB. The Status Board LED of the Tenor unit should turn yellow.
4) Connect the USB cable to the un25it (USB input on the rear of the Tenor unit).
5) Connect the other end of the USB cable to the USB port of your PC.
Windows indicates that a new peripheral has been detected. Follow the procedure
below:
Check No, not this time and then click on Next
User Manual
p. 53
Tenor Data Logger
Soft dB inc.
Check Install from a list or specific location (Advanced) and then click on Next
Use the Browse button to specify the location of the USB driver for the Tenor unit.
Select the C:\Program Files\Tenor_24Bit\USBDriver folder (or the one where you installed
the software in step 2) and then click Next. The driver is installed and the Tenor unit is
ready to be used. Click on Finish. To test whether the Tenor Unit is properly installed, go
to My Computer/Properties.
User Manual
p. 54
Tenor Data Logger
Soft dB inc.
Right click on My Computer and select Properties
Click on Device Manager in the Hardware tab
User Manual
p. 55
Tenor Data Logger
Soft dB inc.
Expand the USB tree and check for the following entry: Signal_Ranger_mk2
User Manual
p. 56
Tenor Data Logger
Soft dB inc.
Appendix B: Tenor input/output specifications
Specification
Commentary
Direct AC, Direct DC and
ICP inputs SNR
105.0 dB
This is the signal–to-noise ratio for the analog input. This
result is for an output dynamic of +-4.5V.
Output SNR
105.0 dB
This is the signal–to-noise ratio for the analog output.
This result is for an output dynamic of +-2V.
Input impedance
1 kOhms
For the direct DC.
18 kOhms
For both ICP direct AC inputs.
Output impedance
0.3 Ohms
Maximum 38 mA.
Input gain accuracy
0.05dB
This is the precision of the input gain. This result is for a
calibrated Tenor. The worse case is close to 0.05 dB.
Input offset accuracy
0.01%
This is the precision of the offset. Once calibrated, the
input offset should be close to zero with a precision of
0.01%. This result is for a calibrated Tenor.
Input distortion
-92.3dB@2Vpp
This is the maximum amplitude of the harmonics when a
1000 Hz sine wave is present on an analog input.
(Direct DC)
Input impedance
(Direct AC and ICP)
-86 dB @4Vpp
-81.4@6Vpp
-77 @8Vpp
-76.3@ 9Vpp
Output distortion
-94.0 dB
This is the maximum amplitude of the harmonics when a
full scale 1000 Hz sine wave is generated by the analog
output.
Input crosstalk
-110.0 dB
For this test, a full-scale sine wave (1000 Hz) is applied
on a specific input and the sine amplitude is measured on
all others inputs.
Output crosstalk
In noise
On all output channels, the bandwidth noise is greater
than the cross talk.
User Manual
p. 57
Tenor Data Logger
Soft dB inc.
Input Frequency Response
The next figures present the frequency response for all input types.
User Manual
p. 58
Tenor Data Logger
Soft dB inc.
Output Frequency Response
User Manual
p. 59