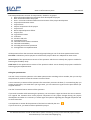
1
SLAP 2.0 Information System
User manual
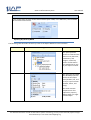
Exercise 6: Enrich Your Report Using Charts
In this exercise, you will:
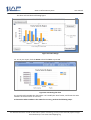
• Add a basic Chart to the Report you previously created.
We will manually build a simple chart rather than use the wizard to get a feel of modifying the
report items. SQL Server Reporting Services 2008 introduced new Data Visualization
functionality in the form of a richer chart report item, and an all-new gauge report item.
Note
The Data Region report items such as Chart, Gauge, and Tablix are only allowed in the Report
Body section, and not in the Header and Footer sections.
This exercise assumes that you have completed Exercise 4.
Adding a Basic Chart to Previously Created Report
To add a Basic Chart to a previously created Report, follow these steps:
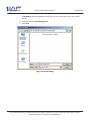
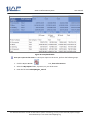
1. Open the previously created report, SalesbyRegion4_ex.rdl.
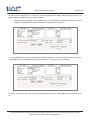
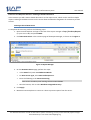
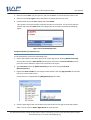
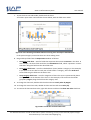
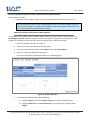
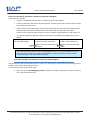
2. To add a chart report item to the design surface below your existing Tablix, do the following:
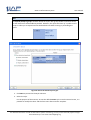
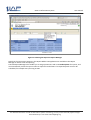
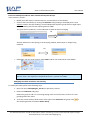
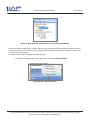
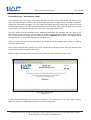
a. Create some space at the bottom of your report by dragging the report body sizing
handle down in the vertical ruler. This will create a blank space below your Tablix, and
will be used to accommodate the chart.
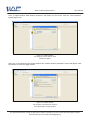
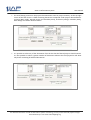
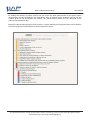
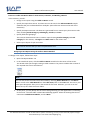
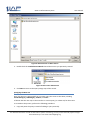
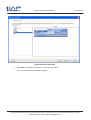
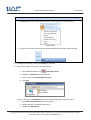
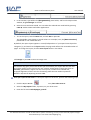
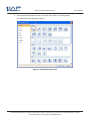
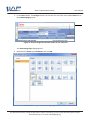
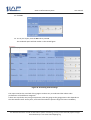
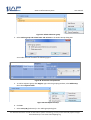
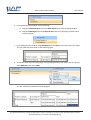
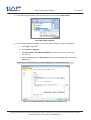
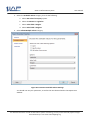
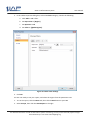
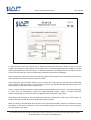
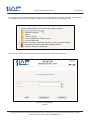
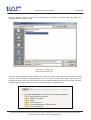
3. In the ribbon, click the Insert tab, then select Insert chart under Chart. The mouse cursor is
now in Insert mode.
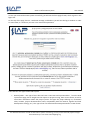
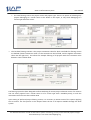
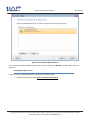
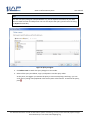
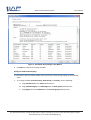
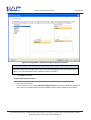
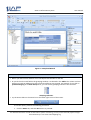
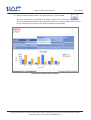
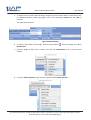
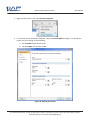
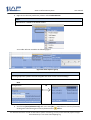
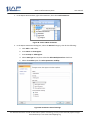
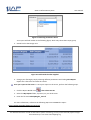
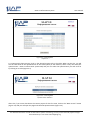
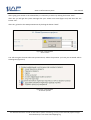
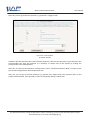
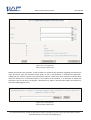
4. Place the pointer to upper-left corner of the new chart, or drag to place and size the new chart.
For detailed information on SLAP 2.0 Information system functioning, you may contact the SLAP project manager
Darko Stalevski by e-mail: [email protected]