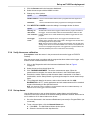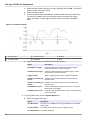
1
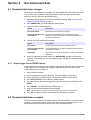
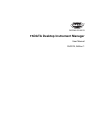
DOC346.53.80513
FSDATA Desktop Instrument Manager
User Manual
05/2015, Edition 1
Table of Contents
Section 1 Product overview .............................................................................................................. 3
1.1 PC requirements ......................................................................................................................... 3
1.2 Install FSDATA Desktop on a computer...................................................................................... 3
Section 2 User interface and navigation ........................................................................................5
2.1 Open FSDATA Desktop............................................................................................................... 5
2.2 Main menu................................................................................................................................... 5
2.3 Change the user preferences....................................................................................................... 6
Section 3 Set up an FL900 for deployment ................................................................................... 7
3.1 Attach the logger to the computer................................................................................................ 7
3.2 Connect the logger to FSDATA Desktop..................................................................................... 7
3.3 Make a basic logger program....................................................................................................... 8
3.3.1 Configure the logger for remote communication............................................................... 10
3.3.1.1 Modbus communication........................................................................................... 11
3.3.2 Set up the sensors—Setup Wizard................................................................................... 11
3.3.3 Set up the sensors manually............................................................................................. 12
3.3.3.1 Flo-Tote setup—manual........................................................................................... 12
3.3.3.2 Flo-Dar setup—manual............................................................................................ 14
3.3.3.3 US9000 adjust—manual.......................................................................................... 15
3.3.3.4 AV9000 setup—manual........................................................................................... 17
3.3.3.5 IM9001 module setup............................................................................................... 18
3.3.4 Verify the sensor calibration.............................................................................................. 19
3.3.5 Set up alarms.................................................................................................................... 19
3.3.6 Set up flow pacing for samplers........................................................................................ 21
3.3.7 Set up a program offline.................................................................................................... 21
Section 4 Get instrument data ....................................................................................................... 23
4.1 Download data from a logger..................................................................................................... 23
4.1.1 Export logger files to FSDATA server............................................................................... 23
4.2 Download data from a sampler.................................................................................................. 23
4.3 Import sampler data from a USB drive....................................................................................... 25
Section 5 View data .......................................................................................................................... 27
5.1 View instrument data.................................................................................................................. 27
5.2 View instrument logs.................................................................................................................. 28
5.3 Make a report............................................................................................................................. 29
Section 6 Utilities .............................................................................................................................. 31
6.1
6.2
6.3
6.4
Update FSDATA Desktop.......................................................................................................... 31
Update the instrument firmware................................................................................................. 31
Restore the default settings....................................................................................................... 31
Erase instrument data................................................................................................................ 31
1
Table of Contents
2
Section 1
Product overview
FSDATA Desktop is a software application used to prepare FL900 Flow Loggers for field
deployment. After deployment, use the application to download data from FL900 Flow
Loggers and from AS950 sampler controllers.
Use FSDATA Desktop to:
•
•
•
•
•
•
•
•
Configure FL900 Series Flow Loggers for deployment in the field
Download data after deployment
Use saved settings to set up additional instruments
Make and print reports
Export data to the FSDATA internet application
View diagnostic information for attached sensors
Import data from AS950 sampler controllers
Update the instrument firmware
Instructional videos are available on www.hachflow.com.
1.1 PC requirements
The computer must have the following minimum requirements:
•
•
•
•
Windows Vista operating system (not Windows Phone/RT)
Microsoft .NET 4.0 Framework
25 MB hard disk space
1024 x 768 screen resolution
1.2 Install FSDATA Desktop on a computer
Before the FL900 Logger is connected to a computer, make sure that FSDATA Desktop
is installed on the computer. FSDATA Desktop is available at www.hachflow.com.
3
Product overview
4
Section 2
User interface and navigation
2.1 Open FSDATA Desktop
1. Click the FSDATA icon to open FSDATA Desktop Instrument Manager. When
opened for the first time, the Settings>Language/Units screen is shown.
2. Select the user preferences for language and units.
3. Click Startup Options and select the display preferences.
4. Click SAVE. The main screen opens.
Note: To change user preferences at a later time, go to Settings from the main menu. Refer to
Change the user preferences on page 6.
2.2 Main menu
Click the pull-down arrow adjacent to FSDATA Desktop to see the main menu (Figure 1).
The Instrument and Instrument Tools menus are only available when an instrument is
connected to FSDATA Desktop. The Program Editor, Import/Export and Software Update
menus are only available when an instrument is not connected to FSDATA Desktop.
Figure 1 Main menu
1 Instrument—Set up and program a connected logger.
6 Instrument Tools—Clear data, restore default settings or
update firmware.
2 Data—View downloaded data.
7 Import—Import AS950 sampler data files from a USB
flash drive.
3 Reports—Make and print reports.
8 Export—Export a data file from a logger to the FSDATA
server.
4 Log Viewer—View event logs, alarm logs and sensor
diagnostics.
9 Software Updates—Find and install newer versions of
FSDATA Desktop.
5 Program Editor—Set up or edit a program for an offline
logger and view program settings from downloaded data
files.
10 Settings—Change the user preferences.
5
User interface and navigation
2.3 Change the user preferences
Use the Settings screen to change the language, units and screen that shows when
FSDATA Desktop opens.
1. Go to Settings from the main menu. The Settings window opens and the
Language/Units screen is shown.
2. Select from the available options in the Language section:
Option
Description
Language
Changes the displayed language (default: English)
Decimal
Selects "." or "," for numbers with a decimal (default: ".")
Time
12 or 24 hour, MM/DD/YY, YY/MM/DD or DD/MM/YY
3. Select from the available options in the Preferred Units section:
Option
Description
Length
Inches, feet, millimeters, centimeters or meters
Rain
Inches, millimeters or centimeters
Velocity
Feet/second or meters/second
Flow
Acre feet, cubic feet, cubic meters, million gallons, gallons or liters per second,
minute, hour or day
Volume
Acre feet, cubic feet, cubic meters, gallons or liters
Temperature Celsius (°C) or Fahrenheit (°F)
The preferred units are shown in data files, reports and logger programs. The
preferred units are also shown in sensor diagnostics and after the factory default
settings are restored to an instrument.
4. Select from the available options in the Default Log Channel Unit Options section:
Option
Description
Site program setting
units
Uses the units that are set in the instrument when downloaded
data files are opened.
Preferred units
Uses the preferred units when downloaded data files are opened.
5. Click Startup Options in the left task pane. Select from the available options:
Option
Description
Display open menu
Shows the main menu when FSDATA Desktop opens.
Automatically go to section Shows a specific screen when FSDATA Desktop opens:
Instrument, Data, Reports, Log Viewer or Program Editor.
Display tooltip messages
Shows detailed information when the cursor is held over a
button.
6. Click SAVE to save the user preferences.
The updated preferences are shown after FSDATA Desktop is closed and opened
again.
6
Section 3
Set up an FL900 for deployment
Use FSDATA Desktop to specify the settings that are used when the FL900 Flow Logger
is deployed in the field.
3.1 Attach the logger to the computer
Pre-requisites: Make sure that FSDATA Desktop is installed on the computer.
Connect only one logger to the computer.
1. Attach the logger to the computer (Figure 2).
2. When a USB cable is attached for the first time, the Found New Hardware wizard
opens. Run the new hardware wizard to install the USB driver for the logger. When
finished, the message “Your new hardware is installed and ready to use” is shown. In
the event the wizard does not run or the install fails, contact technical support to
assist with trouble shooting your specific operating system.
Figure 2 Attach the logger to a computer
3.2 Connect the logger to FSDATA Desktop
Connect the logger to FSDATA Desktop before deployment to set up the logger for data
collection. Connect the logger to FSDATA Desktop after deployment to download data.
Connection status:
•
•
Connected—An instrument is attached to the PC and connected to FSDATA
Desktop. The attached sensors are shown in Instrument menu. The user can
download and view data from the logger and write a program to the logger. The
Program Editor, Import/Export and Software Updates menus are not available.
Not connected—An instrument is not connected to FSDATA Desktop. The Instrument
and Instrument Tools menus are not available.
1. Attach the logger to the PC. Refer to Attach the logger to the computer on page 7.
2. Click CONNECT (Figure 3). The Connect to Instrument window opens.
3. Click FL900.
7
Set up an FL900 for deployment
4. Select the port on the computer where the logger is attached (serial or USB), then
click CONNECT. The connection status changes to Connected.
Note: If the sensor mismatch message is shown, select "Use existing program" if the sensors
will be attached to the logger again during installation. If not, select "Create new program
based on detected sensors."
Figure 3 Connect to FSDATA Desktop
1 Instrument connection status (connected or not
connected)
2 Connect/Disconnect button
3.3 Make a basic logger program
A basic program must be written to the logger to specify the channels to be logged. The
logger program starts when the program is written to the logger.
1. Open a communication session with the logger:
a.
b.
c.
d.
Open FSDATA Desktop.
Click CONNECT. The Connect to Instrument window opens.
Click FL900.
Select the port on the computer where the logger is attached (serial or USB),
then click CONNECT.
Note: If the sensor mismatch message is shown, select "Use existing program" if the
sensors will be attached to the logger again during installation. If not, select "Create new
program based on detected sensors."
e. Make sure that the connection status shows "connected".
2. Go to the Instrument menu. The FL900 Programming screen opens to the General
Settings tab (Figure 4). The Port Assignments section shows the sensors that are
attached to the logger. The attached sensors are also shown in the FL900 Status
pane.
3. Enter the Site ID and Location.
Option
Description
Site ID
Enter a unique name for the site (required).
Location
Enter the physical location of the instrument (optional).
4. If there are sensors to include that are not currently attached, select the sensors in
the Port Assignments section. Make sure that the specified port is used when the
sensors are attached.
Note: Sensors do not have to be attached to the logger to write a program to the logger. The
sensors must be attached for calibration.
5. Select the channels to be logged in the Select channels to log section:
a. Expand the tree for the Logger channel group. The Power Supply channel is
always shown in this group. Logging the power supply will provide values for the
battery level. An alarm could be set at a specific level to alert the account
manager of a low level, thus prompting a field visit to change the batteries and
prevent lost data. If the logger contains a port for a rain gauge, the Rain channel
8
Set up an FL900 for deployment
is also shown. To include a Logger channel in the datalog, select the check box
next to the channel name.
b. Expand the tree for each Port[1](Sensor Name) channel group to view the
available channels for the sensor. If the check box next to Logger or Port[1] is
selected, all of the channels in the group are automatically selected.
c. To include a Sensor channel in the datalog, select the check box next to the
channel name. The log channel count increases each time a channel is selected.
Note: For loggers with multiple sensor ports, the port number is added to the channel
name. For example, Velocity 3 is the velocity channel name for sensor port 3.
6. To set the logging interval for a channel group:
a. Click on the channel group name, for example Port1 (Flo-Dar). The logging
intervals are shown.
b. Select the interval from the drop-down list. The primary logging interval is used
for normal operation. The secondary logging interval is used during alarm
conditions.
Note: The logging interval cannot be set for an individual sensor channel.
7. Click WRITE TO LOGGER to save the settings. A message window is shown:
Option
Description
Warning: all
data will be
lost. Continue?
All data that is stored in the logger is erased when a program is written to
the logger. To save the data, select No and download the data to a safe
location. Select Yes to erase all data and update the logger with the new
program.
Set Logger
Clock
Synchronize to Computer Clock—the logger uses the date and time
settings of the computer. Set Logger Clock—the logger uses the date and
time settings that are set by the user.
Note: If the unit has a modem, the logger automatically uses the date time
settings of the server for the selected time zone. There is no adjustment on
the server for daylight savings time. The logger time is synchronized to the
selected (standard) time zone on the server each evening.
9
Set up an FL900 for deployment
Figure 4 Instrument dashboard
1 Load the settings from the logger
6 Connected logger status pane
2 Specify the channels that will be logged
7 Send the settings to the logger
3 Setup tabs
8 Save the settings to a file
4 Connect/disconnect, download buttons and connection
status
9 Set the logger to the default settings
5 Diagnostics tab
10 Load the settings from a file (modem settings are not
loaded)
3.3.1 Configure the logger for remote communication
Pre-requisites: The logger must be attached to the computer. An account with a network
provider must be set up, and the server must be configured.
The settings for remote communication must be entered into FSDATA Desktop and then
written to the logger.
1. Start a communication session with the logger:
a.
b.
c.
d.
Open FSDATA Desktop.
Click CONNECT. The Connect to Instrument window opens.
Click the FL900 button.
Select the port on the computer where the logger is attached (serial or USB),
then click Connect.
Note: If the sensor mismatch message is shown, select "Use existing program" if the
sensors will be attached to the logger again during installation. If not, select "Create new
program based on detected sensors."
10
Set up an FL900 for deployment
e. Make sure that the connection status shows "connected".
2. Go to the Communications tab. Enter the information for the desired site. Select Time
Zone.
3. Complete the Remote Settings information:
Option
Description
CDMA
No additional configuration is necessary.
GPRS
Select the network provider and the modem frequency. (For US
locations, 850/1900 MHz. For outside the US, contact the provider for
the modem frequency.) Enter the user name and password, if
applicable.
Primary Call Interval The frequency that the logger calls the server.
Secondary call
interval
The frequency that the logger calls the server during an alarm
condition.
Server Verification
Code
The code that specifies which account on the FSDATA server the
logger belongs to. The server cannot store data without this code.
4. Click WRITE TO LOGGER to save the settings. A message window is shown:
3.3.1.1
Option
Description
Warning: all
data will be
lost. Continue?
All data that is stored in the logger is erased when a program is written to
the logger. To save the data, select No and download the data to a safe
location. Select Yes to erase all data and update the logger with the new
program.
Set Logger
Clock
Synchronize to Computer Clock—the logger uses the date and time
settings of the computer. Set Logger Clock—the logger uses the date and
time settings that are set by the user.
Note: If the unit has a modem, the logger automatically uses the date time
settings of the server for the selected time zone. There is no adjustment on
the server for daylight savings time. The logger time is synchronized to the
selected (standard) time zone on the server each evening.
Modbus communication
The Modbus protocol is a communication option for this instrument. The Modbus registers
change with the sensor settings. To find the Modbus registers, go to the Communications
tab in the Instrument dashboard or the Program editor. Click MODBUS MAP. The register
information opens in a PDF format.
3.3.2 Set up the sensors—Setup Wizard
Pre-requisite: Install the sensor in the process and connect the logger to FSDATA
Desktop.
Note: As an alternative, complete a zero level calibration before the AV9000 sensor is installed.
The Setup Wizard is the easiest method to configure and calibrate the sensor. The Setup
Wizard includes illustrated instructions for each input parameter and includes a site
velocity profile. To skip the site velocity profile, configure the sensor manually. The Setup
Wizard must be used for the US9000 sensors.
1.
2.
3.
4.
Click the Sensors tab in the Instrument dashboard.
Click Sensor Port[1] (sensor name).
Click SETUP WIZARD. The Setup Wizard window opens.
Select the options on each screen. When the Setup Results screen is shown, click
FINISH.
11
Set up an FL900 for deployment
5. Click WRITE TO LOGGER to save the settings. A message window is shown:
Option
Description
Warning: all
data will be
lost. Continue?
All data that is stored in the logger is erased when a program is written to
the logger. To save the data, select No and download the data to a safe
location. Select Yes to erase all data and update the logger with the new
program.
Set Logger
Clock
Synchronize to Computer Clock—the logger uses the date and time
settings of the computer. Set Logger Clock—the logger uses the date and
time settings that are set by the user.
Note: If the unit has a modem, the logger automatically uses the date time
settings of the server for the selected time zone. There is no adjustment on
the server for daylight savings time. The logger time is synchronized to the
selected (standard) time zone on the server each evening.
The sensor setup is complete. The status light on the logger will flash green if the
program matches the connected sensors.
3.3.3 Set up the sensors manually
The Setup Wizard is the easiest method to set up the sensor and must be used for
US9001 and US9003 sensors. Use the manual setup for flow channels that have a
complex shape or to adjust some of the calibration parameters. Refer to the illustrations
in the Setup Wizard to understand the settings in the manual setup.
Set the site-specific parameters such as pipe diameter and water level before deployment
for each sensor. Calibrate the sensor and use a test measurement to verify that the
sensor setup is correct. The sensors do not have to be attached to the logger to write a
program to the logger. The sensors must be attached for calibration.
3.3.3.1
Flo-Tote setup—manual
Pre-requisite: Install the sensor in the process and connect the logger to FSDATA
Desktop.
1. Click the Sensors tab in the Instrument dashboard.
2. Select the sensor port with the attached Flo-Tote sensor (Figure 5).
3. To change the units, click UNITS.
Note: The selected units in the Sensors tab override the selected units in the Settings menu.
4. Click the Basic Setup tab.
5. Complete the information in the Level Settings section.
a. Click CALCULATE for the Level Calibration field. The Calculate Level Calibration
window opens.
b. Click TAKE MEASUREMENT. The sensor measures the liquid level in the flow
channel. When the measurement is complete, the measured level is shown.
c. Measure the vertical distance from the bottom of the flow channel to the top of
the liquid.
d. Enter the measured value in the Actual Level field. Click OK. The software
calculates a calibration value to adjust the measured value to the actual value.
e. If the sensor is not installed at the bottom of the channel, measure the vertical
distance from the bottom of the flow channel to the installed sensor location.
Enter the value in the Sensor Offset field.
f. If there is sediment in the channel, measure the vertical distance from the bottom
of the flow channel to the top of the sediment. Enter the value in the Sediment
field.
6. Complete the information in the Velocity Settings section.
a. Click CALCULATE. The Site Coefficient window opens.
12
Set up an FL900 for deployment
b. Click TAKE MEASUREMENT. The sensor measures the velocity in the flow
channel. When the measurement is complete, the measured velocity is shown.
c. Measure the velocity in the flow channel with a portable instrument. A velocity
profile is recommended to determine the average velocity.
d. Enter the measured value in the Actual Velocity field. Click OK. The software
calculates a site coefficient value to adjust the measured velocity to the average
velocity.
7. Click the Flow Setup tab.
a. Select the shape of the flow channel.
b. Enter the dimensions of the flow channel.
c. If the flow channel has a complex shape, a table is shown. Enter the area at the
specified level intervals.
8. For complex site conditions, contact technical support to complete the information in
the Advanced Settings tab.
Note: It is not necessary to adjust the advanced or tech support settings for typical
applications. Make changes only with the guidance of technical support.
9. Click WRITE TO LOGGER to save the settings. A message window is shown:
Option
Description
Warning: all
data will be
lost. Continue?
All data that is stored in the logger is erased when a program is written to
the logger. To save the data, select No and download the data to a safe
location. Select Yes to erase all data and update the logger with the new
program.
Set Logger
Clock
Synchronize to Computer Clock—the logger uses the date and time
settings of the computer. Set Logger Clock—the logger uses the date and
time settings that are set by the user.
Note: If the unit has a modem, the logger automatically uses the date time
settings of the server for the selected time zone. There is no adjustment on
the server for daylight savings time. The logger time is synchronized to the
selected (standard) time zone on the server each evening.
Figure 5 Flo-Tote sensor setup
13
Set up an FL900 for deployment
3.3.3.2
Flo-Dar setup—manual
Pre-requisite: Install the sensor in the process and connect the logger to FSDATA
Desktop.
1. Click the Sensors tab in the Instrument dashboard.
2. Select the sensor port with the attached Flo-Dar sensor (Figure 6).
3. To change the units, click UNITS.
Note: The selected units in the Sensors tab override the selected units in the Settings menu.
4. Click the Basic Setup tab.
5. Complete the information in the Level Settings section.
a. Select the Transducer Type for the connected sensor—Standard: 0–1.5 m
(0–5 ft) or Extended range: 0–6.1 m (0–20 ft).
b. If the sensor height is known, enter the value in the sensor height field. The
sensor height is the distance from the bottom of the flow channel to the top of the
sensor frame.
c. If the sensor height is not known, click CALCULATE for the Sensor Height field.
The Calculate Sensor Height window opens.
d. Click TAKE MEASUREMENT. The sensor measures the distance to the liquid
surface (sensor distance).
e. Measure the vertical distance from the bottom of the flow channel to the top of
the liquid.
f. Enter the measured value in the Actual Level field. Click OK. The software
calculates the sensor height from the bottom of the channel to the sensor.
g. If there is sediment in the channel, measure the vertical distance from the bottom
of the flow channel to the top of the sediment. Enter the value in the Sediment
field.
h. If more adjustment is necessary for the level calibration, click CALCULATE for
the Level Calibration field. The Calculate Level Calibration window opens.
i. Measure the vertical distance from the bottom of the flow channel to the top of
the liquid.
j. Enter the measured value in the Actual Level field. Click OK. The software
calculates a calibration value to adjust the measured value to the actual value.
6. Complete the information in the Velocity Settings section.
a. Select the Velocity Method (Direct Mean for circular flow channels or Velocity
Multiplier for non-circular flow channels).
b. Click CALCULATE for the Site Multiplier field. The Calculate Site Multiplier
window opens.
c. Click TAKE MEASUREMENT. The sensor measures the velocity in the flow
channel. When the measurement is complete, the measured velocity is shown.
d. Measure the velocity in the flow channel with a portable instrument. A velocity
profile is recommended to determine the average velocity.
e. Enter the measured value in the Actual Velocity field. Click OK. The software
calculates a site multiplier value to adjust the measured surface velocity to the
average velocity.
f. If an SVS sensor is used, select the sensor port on the logger where the SVS is
attached.
g. If an SVS sensor is used and the Flo-Dar sensor is installed in the opposite
direction from the flow, select the Reversed SVS Sensor checkbox.
7. Click the Flow Setup tab.
a. Select the shape of the flow channel.
b. Enter the dimensions of the flow channel.
14
Set up an FL900 for deployment
c. If the flow channel has a complex shape, a table is shown. Enter the area at the
specified level intervals.
8. For complex site conditions, contact technical support to complete the information in
the Advanced Settings tab.
Note: It is not necessary to adjust the advanced or tech support settings for typical
applications. Make changes only with the guidance of technical support.
9. To start again from the default settings, click RESTORE SENSOR. The default
settings are shown.
10. Click WRITE TO LOGGER to save the settings. A message window is shown:
Option
Description
Warning: all
data will be
lost. Continue?
All data that is stored in the logger is erased when a program is written to
the logger. To save the data, select No and download the data to a safe
location. Select Yes to erase all data and update the logger with the new
program.
Set Logger
Clock
Synchronize to Computer Clock—the logger uses the date and time
settings of the computer. Set Logger Clock—the logger uses the date and
time settings that are set by the user.
Note: If the unit has a modem, the logger automatically uses the date time
settings of the server for the selected time zone. There is no adjustment on
the server for daylight savings time. The logger time is synchronized to the
selected (standard) time zone on the server each evening.
Figure 6 Flo-Dar sensor setup
3.3.3.3
US9000 adjust—manual
Make sure to use the Setup Wizard to set up US9000 sensors. If necessary, adjust the
level offset and sediment values after the initial setup.
1. Click the Sensors tab in the Instrument dashboard.
2. Select the sensor port with the attached US9000 sensor (Figure 7).
15
Set up an FL900 for deployment
3. To change the units, click UNITS.
Note: The selected units in the Sensors tab override the selected units in the Settings menu.
4. Click the Basic Setup tab.
5. Complete the information in the Level Settings section.
a. Select the sensor type—Down-Looking or In-Pipe.
b. If there is sediment in the channel, measure the vertical distance from the bottom
of the flow channel to the top of the sediment. Enter the value in the Sediment
field.
c. Click CALCULATE for the Level Calibration field. The Calculate Level Calibration
window opens.
d. Select the sensor type—Down-Looking or In-Pipe.
e. Click TAKE MEASUREMENT. The sensor measures the liquid level in the flow
channel. When the measurement is complete, the measured level is shown.
f. Measure the vertical distance from the bottom of the flow channel to the top of
the liquid.
g. Enter the measured value in the Actual Level field. Click OK. The software
calculates a calibration value to adjust the measured value to the actual value.
h. The zero level is the distance from the face of the sensor or sensor tube to the
bottom of the channel.
6. Click the Flow Setup tab.
a. Select the shape of the flow channel.
b. Enter the dimensions of the flow channel.
c. If the flow channel has a complex shape, a table is shown. Enter the area at the
specified level intervals.
7. Select the sensor port with the area velocity sensor.
8. Click WRITE TO LOGGER to save the settings. A message window is shown:
16
Option
Description
Warning: all
data will be
lost. Continue?
All data that is stored in the logger is erased when a program is written to
the logger. To save the data, select No and download the data to a safe
location. Select Yes to erase all data and update the logger with the new
program.
Set Logger
Clock
Synchronize to Computer Clock—the logger uses the date and time
settings of the computer. Set Logger Clock—the logger uses the date and
time settings that are set by the user.
Note: If the unit has a modem, the logger automatically uses the date time
settings of the server for the selected time zone. There is no adjustment on
the server for daylight savings time. The logger time is synchronized to the
selected (standard) time zone on the server each evening.
Set up an FL900 for deployment
Figure 7 US9000 sensor setup
3.3.3.4
AV9000 setup—manual
Pre-requisite: Install the sensor in the process and connect the logger to FSDATA
Desktop.
Note: As an alternative, complete a zero level calibration before the AV9000 sensor is installed.
1. Click the Sensors tab in the Instrument dashboard.
2. Select the sensor port with the attached AV9000 sensor (Figure 8).
3. To change the units, click UNITS.
Note: The selected units in the Sensors tab override the selected units in the Settings menu.
4. Click the Basic Setup tab.
5. Complete the information in the Level section.
a. If the sensor is not installed at the bottom of the channel, measure the vertical
distance from the bottom of the flow channel to the installed sensor location.
Enter the value in the Sensor Offset field.
b. Click CALCULATE for the Level Calibration field. The Calculate Level Calibration
window opens.
c. Click TAKE MEASUREMENT. The sensor measures the liquid level in the flow
channel. When the measurement is complete, the measured level is shown.
d. Measure the vertical distance from the bottom of the flow channel to the top of
the liquid.
e. Enter the measured value in the Actual Level field. Click OK. The software
calculates a calibration value to adjust the measured value to the actual value.
f. If there is sediment in the channel, measure the vertical distance from the bottom
of the flow channel to the top of the sediment. Enter the value in the Sediment
field.
6. If the sensor is installed in the opposite direction from the flow, select the Reversed
Sensor checkbox in the Velocity section. Flow measurements will be recorded with a
positive value.
7. Click the Flow Setup tab.
a. Select the shape of the flow channel.
b. Enter the dimensions of the flow channel.
c. If the flow channel has a complex shape, a table is shown. Enter the area at the
specified level intervals.
17
Set up an FL900 for deployment
8. For complex site conditions, contact technical support to complete the information in
the Advanced Settings tab.
Note: It is not necessary to adjust the advanced or tech support settings for typical
applications. Make changes only with the guidance of technical support.
9. Click WRITE TO LOGGER to save the settings. A message window is shown:
Option
Description
Warning: all
data will be
lost. Continue?
All data that is stored in the logger is erased when a program is written to
the logger. To save the data, select No and download the data to a safe
location. Select Yes to erase all data and update the logger with the new
program.
Set Logger
Clock
Synchronize to Computer Clock—the logger uses the date and time
settings of the computer. Set Logger Clock—the logger uses the date and
time settings that are set by the user.
Note: If the unit has a modem, the logger automatically uses the date time
settings of the server for the selected time zone. There is no adjustment on
the server for daylight savings time. The logger time is synchronized to the
selected (standard) time zone on the server each evening.
Figure 8 AV9000 sensor setup
3.3.3.5
IM9001 module setup
When an IM9001 interface module is attached to the logger, the logger can collect data
from a Sigma Flow Meter and transmit the data via a wireless or local connection. The
data can be used to trigger alarms or pace a sampler. The module can also be used as a
network interface for Modbus communication.
Use the Instrument dashboard to set the log intervals and to select the channels that are
logged. The logging intervals that are programmed into the 950 Flow Meter must be more
than or equal to the logging intervals of the logger to be sure that all data is logged.
Note: Configure the Sigma Flow Meter before connection to the IM9001 module. The flow meter
program cannot be configured through the IM9001 module. Refer to the flow meter user manual for
programming details. The logger program and Sigma Flow Meter programs run independently of
each other.
Configure the IM9001 module to communicate with a Sigma Flow Meter.
18
Set up an FL900 for deployment
1. Click the Sensors tab in the Instrument dashboard.
2. Select the sensor port with the IM9001 module.
3. Change any of the options:
Option
Description
Modbus Address Use the same Modbus address that is programmed in the Sigma Flow
Meter.
Baud Rate
Use the same Baud rate that is programmed in the Sigma Flow Meter.
4. Click WRITE TO LOGGER to save the settings. A message window is shown:
Option
Description
Warning: all
data will be
lost. Continue?
All data that is stored in the logger is erased when a program is written to
the logger. To save the data, select No and download the data to a safe
location. Select Yes to erase all data and update the logger with the new
program.
Set Logger
Clock
Synchronize to Computer Clock—the logger uses the date and time
settings of the computer. Set Logger Clock—the logger uses the date and
time settings that are set by the user.
Note: If the unit has a modem, the logger automatically uses the date time
settings of the server for the selected time zone. There is no adjustment on
the server for daylight savings time. The logger time is synchronized to the
selected (standard) time zone on the server each evening.
3.3.4 Verify the sensor calibration
Pre-requisite: Install the sensor in the process and connect the logger to FSDATA
Desktop.
After the sensor setup is complete and the program has been written to the logger, verify
that the sensor measurements are accurate.
1. Click on the Diagnostics tab in the Instrument dashboard. Refer to Figure 4
on page 10.
2. Select the sensor from the pull-down list.
3. Click TAKE MEASUREMENT. The sensor measurement starts. When the
measurement is complete, the sensor data is shown in the FL900 Status panel.
4. Examine the results. Make sure that the sensor data is reasonable. If the data is
questionable, use the Setup Wizard or go through the steps for manual sensor setup
again.
5. To log diagnostic data for the sensor, select a time interval and click LOG
DIAGNOSTICS. All FFT, quality parameters and sub-measurements will be recorded
as part of the datalog for the specified interval.
Note: The diagnostic data is available in the downloaded data file in FSDATA Desktop or in
FSDATA server if the logger is wireless enabled.
3.3.5 Set up alarms
Use the Alarms menu to set up channel alarms, system alarms and notifications.
Channels must first be selected in the General Settings tab before channel alarms can be
set. A maximum of 16 channel alarms can be set.
1. Go to the Alarms tab in the Instrument Dashboard (connected) or Program Editor (not
connected).
2. To set a channel alarm, click the Channel Alarms tab:
a. Click ADD.... The Add Channel Alarm window opens.
b. Select the channel from the drop-down list.
19
Set up an FL900 for deployment
c. Select the type of alarm (low/low, low, high, high/high) and click OK. The channel
alarm is shown in the main section.
d. Select the channel alarm.
e. Enter the setpoint value and deadband. An alarm starts when the channel value
is equal to the setpoint value. An alarm stops when the channel value goes
above (low alarm) or below (high alarm) the setpoint value by the deadband
value.
Figure 9 Low alarm example
1 Channel value
3 Low alarm stops
5 Setpoint
2 Low alarm starts
4 Deadband
6 Time
f.
Select the actions that will start during an alarm condition:
Option
Description
Send SMS from logger
Sends an SMS (text) message from a wireless logger—
useful when there is no server connection.
Send Email from logger
Sends an email message from a wireless logger—useful
when there is no server connection.
Trigger sampler
Starts a sampling program when a sampler is attached.
Switch to secondary log
interval
Switches to secondary log interval—the secondary log
interval is used.
Switch to secondary call Switches to secondary call interval—the secondary call
interval
interval is used.
Send SMS from server
Sends an SMS (text) message from the server—uses less
battery power in the logger.
Send Email from server
Sends an email message from the server—uses less battery
power in the logger.
3. To set a system alarm, click the System Alarms tab:
a. Select the system alarm type:
Option
Description
Low Main Power
Less than 8 V is available from the logger batteries or the external
power supply.
Low RTC Battery
The battery for the internal clock in the logger is weak.
Low Slate Memory The datalog is 80% full.
20
Set up an FL900 for deployment
Option
Description
Slate Memory Full The datalog is full and data collection has stopped.
Sensor Timeout
The sensor has not responded to a call by the server.
Sensor ID Error
The program cannot detect what type of sensor is connected.
b. Select the system alarm actions:
Option
Description
Send SMS from logger
Sends a text message from the logger via the network
provider.
Send Email from logger Sends an email from the logger via the network provider.
Send SMS from server
Sends a text message from the FSDATA server.
Send Email from server Sends an email from the FSDATA server.
4. To enter recipient information for alarm notifications, click the Recipients tab:
a. Enter the email address for each email recipient (maximum of 5).
b. Enter the number for each SMS (text message) recipient (maximum of 5).
3.3.6 Set up flow pacing for samplers
Use flow pacing to set up an attached automatic sampler to collect samples at specified
flow intervals. The sampler must be attached to the auxiliary port on the logger. Use the
Sampler menu to specify when samples are collected.
1. Go to the Sampler tab in the Instrument Dashboard (connected) or Program Editor
(not connected).
2. In the Pacing Source field, select the sensor port that will measure flow for the
sampler.
3. Enter the volume interval that generates a flow pulse to the sampler. For example, a
sampler can collect a sample every 100 gallons of flow.
Note: The sampler can also collect a sample during alarm conditions if the Trigger sampler
action is set for a channel alarm.
3.3.7 Set up a program offline
Use the Program Editor to set up a logger program for later use or to view program
settings from downloaded data files. Save the program as a file, edit as necessary, then
write the program to the logger when the logger is connected to FSDATA Desktop.
1. Go to Program Editor from the main menu.
2. Select NEW to make a new program or LOAD to edit an existing program.
Note: If a downloaded site file is open, the program settings for the site file are shown.
3. Enter the program information in each of the tabs. Refer to Make a basic logger
program on page 8.
Note: The Program Editor shows most of the information that is in the Instrument dashboard.
Some buttons such as the Setup Wizard and Calculate are only available when a sensor is
attached to a connected logger.
4. Click SAVE TO FILE. Save the file in a location for later use. When the logger is
connected, click LOAD FROM FILE, navigate to the saved file and click OPEN.
21
Set up an FL900 for deployment
22
Section 4
Get instrument data
4.1 Download data from a logger
When data is downloaded from the logger, the data includes the channel data, the event
log, the alarm log, the sample history and diagnostic data. The data is automatically
saved as a site file (.fl9) in the specified directory.
1. Make sure that the logger is connected to FSDATA Desktop. Refer to Connect the
logger to FSDATA Desktop on page 7.
2. Click DOWNLOAD. The Download Data window opens.
3. Select one of the download options:
Option
Description
Download all data
Download all of the data from the logger.
Download new data since
last download
Download only the data that was logged since the last
download. For wireless loggers, the last server maintenance
call is the last download.
4. Change any of the download file settings:
Option
Description
Save data to
Change the directory where the data file is saved.
Open file after download
has completed
Automatically open the data file in FSDATA Desktop after the
download is complete.
Export data
Save the data as a TSV or CSV file for use with a spreadsheet
application.
5. When all selections have been made, click DOWNLOAD. A status bar shows the
progress. If the settings are set to automatically open the data file, the data shows in
the screen.
4.1.1 Export logger files to FSDATA server
FL900 logger files can be sent to the FSDATA server where other site users have access
to the data. The server software can complete additional operations such as merge
multiple data files into one data file.
1. Open FSDATA Desktop.
2. Go to Import/Export from the main menu. The Import/Export screen opens.
3. Select the Export to FSDATA option. The Export to FSDATA screen opens.
4. Click SELECT FILES. The file directory window opens.
5. Go to the directory that has the logger files (.fl9) and select one or more files. Click
OPEN.
6. Click EXPORT. The FSDATA Log In window opens.
7. Enter the user name and password and click OK.
Note: Contact technical support if a user name and password have not been set up.
8. Click OK. The Status in the file list changes from pending to successful.
4.2 Download data from a sampler
Data can be downloaded from an AS950 sampler when the sampler is connected to the
computer. The data includes the event log, the alarm log and the sample history. The
data is automatically saved as a site file (.as9) in the specified directory.
23
Get instrument data
1. Connect the AS950 controller to FSDATA Desktop:
a. Use an A-to-A USB cable to attach the AS950 sampler controller to the computer.
Refer to Figure 10.
b. Open FSDATA Desktop and click CONNECT. The Connect to Instrument window
opens.
c. Click AS950.
d. Click CONNECT. The connection status changes to Connected.
2. Go to the Data menu in FSDATA Desktop.
3. Click DOWNLOAD. The Download Data window opens.
4. Select one of the download options:
Option
Description
Download all data
Download all of the data from the logger.
Download new data since
last download
Download only the data that was logged since the last
download. For wireless loggers, the last server maintenance
call is the last download.
5. Change any of the download file settings:
Option
Description
Save data to
Change the directory where the data file is saved.
Open file after download
has completed
Automatically open the data file in FSDATA Desktop after the
download is complete.
Export data
Save the data as a TSV or CSV file for use with a spreadsheet
application.
6. When all selections have been made, click DOWNLOAD. A status bar shows the
progress. If the settings are set to automatically open the data file, the data shows in
the screen.
24
Get instrument data
Figure 10 AS950 sampler connection to FSDATA Desktop
4.3 Import sampler data from a USB drive
Data from an AS950 sampler controller can be saved to a USB flash drive and then
imported into FSDATA Desktop. The imported data is saved as a .as9 file in the specified
directory. The imported data file includes log files, sample history and settings.
1. Use the export menu in the AS950 sampler to save the sampler data to a USB flash
drive.
2. Install the USB flash drive in the computer.
3. Open FSDATA Desktop.
4. Go to Import/Export from the main menu. The Import/Export screen opens.
5. Select the Import from USB option. The Import from AS950 USB screen opens. The
files that can be imported are shown in the Downloads section.
6. Select one or more files to import. Click IMPORT. A confirmation window is shown.
7. Click OK. The Status in the file list changes from pending to successful.
25
Get instrument data
26
Section 5
View data
5.1 View instrument data
Data files from an FL900 logger or an AS950 sampler can be viewed after download in
tabular (spreadsheet) format, as a line graph, x, y scatter plot or mixed tabular and line
graph. The data can be exported to a user-specified location or copied to the clipboard.
Graphs can be opened in PDF format.
1. Go to Data from the main menu. The Data screen opens.
2. Click the OPEN FILE icon in the Sites panel. The file directory window opens.
3. Find the site file (.fl9 or .as9) and click OPEN. The available channels are shown in
the Sites panel.
4. Click on the check box next to a channel to show or remove channels in the Review
pane. Each selected channel is shown as a column in the tabular view and as a line
in the graph view. Refer to Figure 11.
5. Use the drop-down lists in the time span section to show data for a specific time
span.
6. Use the options in the tabular view to change the tabular display.
Option
Description
Sort by column Click on a column header to sort the tabular data by that column.
Export
Save or copy data as a TSV or CSV file. Select the data rows, then click
EXPORT. Select the file type and directory.
Show statistics Click on the Statistics tab to show the minimum, maximum, average and
total values for applicable channels.
7. Use the options in the graphical views to change the graph or scatter plot displays. A
maximum number of 8 channels can be shown on a line graph. A maximum of
2 channels can be shown on a scatter plot.
Option
Description
Select different time periods within the specified time span.
Go to the beginning, back, forward or to the end of the time span.
Drag the displayed time span to the right or to the left.
Click and drag an area on the graph to zoom in on.
Click on the graph to zoom in or out.
Zoom out to the selected time span.
Copy the current graph view to the clipboard for use in other
applications.
Open the graph settings window to change settings such as line
color, y-axis range, grid lines and title bars.
Make a pdf that can be saved, printed or sent to an email
recipient.
27
View data
Figure 11 Mixed data view
5.2 View instrument logs
The user can view events, sensor diagnostic information, alarm logs and sample history
in the Log Viewer menu.
1.
2.
3.
4.
Go to Log Viewer from the main menu. The Log Viewer screen opens.
Click the OPEN FILE icon in the Sites panel. The file directory window opens.
Find the site file (.fl9 or .as9) and click OPEN.
Use the drop-down lists in the time span section to show data for a specific time
span.
5. Click on the tabs to view the available information:
28
Option
Description
Events
Shows a list of events in a tabular format. Select or deselect events from
the list in the left column. The date and time, event type and event data is
shown in the data columns. Click on a column to sort the events by the
column.
Sensor
Diagnostics
Shows the sensor name, date and time and sensor data in a tabular and
graphical format. The graph can be copied to the clipboard for use in other
applications.
View data
Option
Description
Alarms
Shows the date and time, alarm source, alarm type, state and data for all
alarms in the tabular format.
Sample History
Shows the date and time, status (success or failed), sample number,
bottle number, volume and program name in a tabular format when a
sampler is attached to the logger.
6. To save the data as a TSV or CSV file, click EXPORT. Select the file type and
directory.
5.3 Make a report
Reports can show instrument data or site-specific information such as events and alarms.
To make a report, data must first be downloaded from an instrument. All reports are made
in pdf format for a selected time span.
1. Go to Reports from the main menu. The Reports screen opens.
2. Click Data Reports or Site Reports to show the list of available reports.
3. Select a report type:
Option
Description
Data Summary
A summary of instrument data. The maximum, minimum, average and total
(if applicable) values are shown for each selected channel. The report
includes an overall summary and a list of interval summary data for each
channel. The intervals are hourly when the time span is less than or equal
to 48 hours and daily when the time span is greater than 48 hours.
Summary
Statistics
A summary of instrument data. The maximum, minimum, average and total
(if applicable) values are shown for each selected channel. The report
includes an overall summary for each channel. Interval summaries are not
listed.
Tabular Data
A list of Individual data points for up to seven channels.
Event Log
The event log data. The report includes a summary of all events and a list
of individual events.
Sample History The sample history data. The report includes a summary of all events and a
list of individual events.
Site Alarm
A list of alarm conditions for an instrument. The report includes the alarm
type, alarm state and data for each alarm.
4. Click the OPEN FILE icon in the Sites panel. The file directory window opens.
5. Find the site file (.fl9 or .as9) and click OPEN. The available channels are shown in
the Sites panel.
6. For data reports, select the channels to include in the report.
7. To change the units that are shown in a data report, select the units icon. Select the
units to show in the report and click SAVE.
8. Use the drop-down lists in the time span section to show data for a specific time
span.
9. Click CREATE REPORT. The report opens in a PDF format in a new window.
10. Use the toolbar to save or print the report.
29
View data
30
Section 6
Utilities
6.1 Update FSDATA Desktop
When connected to the internet, the application can find available updates.
1. Go to Software Updates from the main menu. The Software Updates screen opens.
2. Click CHECK NOW. The application finds the newest update and compares the
newest version to the installed version.
3. If a newer version is available, click OK to install the newer version. If the installed
version is the newest, click OK. The screen shows the installed version and the date
and time of the last search for an update.
6.2 Update the instrument firmware
Install firmware updates regularly for best results. The firmware update process erases all
data and program information. Make sure data is saved to a file before the firmware
update process starts.
1.
2.
3.
4.
5.
6.
7.
Make sure the device is connected to FSDATA Desktop.
Go to Instrument Tools from the main menu. The Instrument Tools screen opens.
Click FIRMWARE UPDATE. The Firmware Update window opens.
Select the connected device from the drop-down list.
If necessary, click BROWSE to select the correct directory of the update file.
Click UPDATE. A confirmation window opens.
Click YES. The update starts. Wait for the status to show complete.
Note: If the firmware update contains program changes that are not compatible with the current
program settings, the update may fail. If the update fails, deselect the Restore program settings
checkbox and start the update again.
6.3 Restore the default settings
The instrument can be set to use the factory default settings. All measurement and log
data is permanently erased.
1.
2.
3.
4.
Make sure the device is connected to FSDATA Desktop.
Go to Instrument Tools from the main menu. The Instrument Tools screen opens.
Click RESTORE. A confirmation window opens.
Click RESTORE. Wait for the process to complete.
6.4 Erase instrument data
Data can be permanently erased from the instrument. Make sure to save data to a file
before this task is started.
1.
2.
3.
4.
5.
6.
Make sure the device is connected to FSDATA Desktop.
Go to Instrument Tools from the main menu. The Instrument Tools screen opens.
Click CLEAR. The Clear Data window opens.
Select the type of data to be erased (measurement, alarm, event and/or sample).
Click CLEAR. A confirmation window opens.
Click YES. Wait for the operation to complete.
31
Utilities
32
HACH COMPANY World Headquarters
P.O. Box 389, Loveland, CO 80539-0389 U.S.A.
Tel. (970) 669-3050
(800) 227-4224 (U.S.A. only)
Fax (970) 669-2932
[email protected]
www.hach.com
©
HACH LANGE GMBH
Willstätterstraße 11
D-40549 Düsseldorf, Germany
Tel. +49 (0) 2 11 52 88-320
Fax +49 (0) 2 11 52 88-210
[email protected]
www.de.hach.com
Hach Company/Hach Lange GmbH, 2015. All rights reserved.
HACH LANGE Sàrl
6, route de Compois
1222 Vésenaz
SWITZERLAND
Tel. +41 22 594 6400
Fax +41 22 594 6499