1
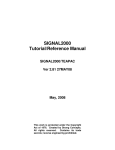
Center for Microcomputers in Transportation
PHOTO BY RON FRANKLIN
Volume 19 Spring 2000 Newsletter
™
N O W A V A I L A B L E ! TURBO ARCHITECTURE & HDM-4
ITS
D
Deployment
A
Analysis
S
System
Gene McHale, Federal Highway Administration
he FHWA is planning to begin
the distribution of the ITS Deployment Analysis System
(IDAS) through the McTrans
Center. IDAS is an ITS sketchplanning analysis tool,
designed for transportation planners from Metropolitan Planning
Organizations (MPOs) and state
DOTs for use in the estimation of
the impacts, benefits, and costs
resulting from the deployment of
ITS components. IDAS operates
as a post-processor to travel demand models and although a
sketch-planning tool, IDAS implements the modal split and traffic
assignment steps associated
with a traditional planning model.
T
The Need for a Tool Like IDAS
The transportation planning community has been using travel demand forecasting models to
study alternatives for many years.
To forecast travel demand, the
traditional “four-step” modeling
approach, which is comprised of
trip generation, trip distribution,
mode choice, and traffic
assignment, is applied. The fourstep models forecast future travel
demand on the transportation
system based on a specific set of
transportation improvement
strategies. It allows comparison
with the do nothing or base conditions as well as other sets of
improvement strategies.
For years, these traditional
approaches and their
corresponding assessment tools
have served the needs of the planning community. However, these
tools are extremely limited in their
ability to evaluate the potential impacts of ITS improvements. For example, the current tools are more
SEE PAGE TWO
T
U
R
B
O
A R C H I T E C T U R E
Turbo Architecture is a high level, interactive software program
that aids transportation planners and system integrators, both in the
public and private sectors, in the development of a Regional and/or
Project Architecture. The Turbo Architecture tool is a planning and integration aid designed to facilitate usage of the National ITS Architecture. The application will utilize your inputs and the National ITS
Architecture databases to provide you with tabular and graphical outputs comprising a high level representation of their Regional or Project Architecture. In order to more easily use the tool, it is highly
recommended that you be familiar with the National ITS Architecture.
(This tool is not an introduction to the National ITS Architecture.)
The Turbo Architecture tool:
· Guides you through the design of a Regional or Project Architecture, identifying and extracting the required portions of the
National ITS Architecture.
· Assists in local mapping and tailoring to a region’s needs.
· Helps you with potential conflict resolution between Regional and
Project Architectures.
· Provides a “jumpstart” toward architecture development and conformance to the National ITS Architecture.
· Is a standalone application. However the data files generated by
the tool are Microsoft Access 97-compatible and you may further
manipulate these files using Microsoft Access 97. See page 4 for
a full description.
Transportation Research Center
UNIVERSITY OF
FLORIDA
512 Weil Hall, PO Box 116585, Gainesville FL 32611-6585
(352) 392-0378
Messages 1-800-226-1013
Fax (352) 392-3224
Email [email protected]
http://mctrans.ce.ufl.edu/
McByte
I
Did you know?
3
New Products
4
Updated Products
6
McTrans Training Opportunities
8
Products Listing
9
2
McTrans spring 2000
ITS Deployment Analysis System (IDAS)
than adequate in modeling the effects of adding an additional lane
of highway, but they cannot measure the effects of a ramp metering
system on the freeway. This is
why IDAS was developed. It
enables the assessment of ITS
improvements by adding on to
the four step models.
•
The Tool
In general, the IDAS software is
designed to pick up where the traditional four step planning
models end. In fact, IDAS takes
the output from four-step
planning models to establish a
base case scenario. The IDAS
user selects from a list of ITS
components and “deploys” one or
more ITS improvements into the
base case. IDAS then executes its
own travel demand model to
determine the new travel patterns
that emerge as a result of the ITS
improvements. The incremental
costs and benefits resulting from
the “deployment” of the ITS components are then compared to the
base case scenario and
presented to the IDAS user.
This is the overall strategy that
serves as the IDAS framework.
Within the IDAS software, this
strategy is implemented in a series
of submodules as described below
and shown in figure 1.
• The Input/Output Interface inputs the data from the “four
step” planning models into
the IDAS software. This input
establishes the base case
scenario for analysis and
includes files that describe
the regional transportation
network in terms of nodes,
links, and the number of trips
from each origin to each destination for the forecast year
being analyzed.
• The Alternatives Generator
provides the graphical
interface for the user to select
the ITS components to deploy
on the transportation network.
The user selects from a list of
ITS components and “drags
and drops” them onto the
graphical depiction of the
transportation network.
• The Benefits Module quantifies
the benefits resulting from the
deployment of the ITS components. The default benefit values within IDAS are based on
ITS deployments and/or
research studies. The user can
change the default values, if
desired. It is within this
•
module that IDAS
incorporates an internal travel
demand model to re-evaluate
travel patterns based on the
addition of the ITS
components. Only benefits attributable to the ITS improvements are reported.
The Cost Module tracks the
estimated costs to deploy the
ITS components selected by
the user. Each ITS component
within IDAS requires the
deployment of one or more
pieces of ITS equipment. The
default equipment requirements and their associated
costs may be modified by the
user if more customized data
is available.
The Alternative Comparison
Module compares the benefits
and the costs of the ITS component improvements to the
benefits and costs of the base
case scenario, presents the
results, and allows for
sensitivity and risk analysis
on parameters. Part of this
module is the
conversion of all
benefits into a monetary value (e.g., the
hourly value of
in-vehicle travel
time). As with the
other modules, the
User
user may change any
Input
of the default
parameters in the
Alternative Comparison Module, if
desired.
community, and DOT, has been
active in the development of IDAS
since its inception and continues
to provide the feedback and
insight needed from the IDAS
“customer community.”
IDAS was developed under the
“rapid prototyping” paradigm, using the following planning organizations as “beta testers” in the
development of the software: Pima
Association of Governments
(Tucson, Ariz. area), Chicago Area
Transportation Study, and
Metropolitan Transportation Commission (San Francisco Bay area).
IDAS Training
A two-day training course is currently being developed with ITS
funds and being managed out of
FHWA’s National Highway
Institute. The training course is
designed to educate the
participants in both the theory behind the IDAS model and in the
use of the software. To meet this
goal, the course will be delivered
in a computer lab environment
with a combination of lectures
and hands-on use of the IDAS
software. A pilot version of the
course is scheduled for delivery
in spring 2000 followed by the
first round of training, which will
be offered at each of the four
FHWA resource centers. The
course should be available to
State and local agencies starting
mid to late summer 2000.
IDAS Rollout
A major rollout of IDAS is planned
at the Intelligent Transportation
Society of America (ITS America)
Annual Meeting in Boston during
the first week in May 2000. IDAS
presentations and
demonstrations will be available
during the course of the annual
meeting. For more information on
IDAS, please visit the ITS Joint
Program Office Web site at
www.its.dot.gov/ or contact the
author at
[email protected]
Travel Demand Model Data
Input/Output Interface
Alternatives Generator
IDAS Development
The development of
IDAS was funded with
ITS funds from the U.S.
Department of
Transportation (DOT)
and was managed by the
FHWA Office of
Operations Research
and Development. The
delivery of IDAS is the
responsibility of the Offices of Travel
Management and Metropolitan Planning in
FHWA. The contract
team that conducted the
work includes the Oak
Ridge National
Laboratory, Cambridge
Systematics, Inc., and
ITT Systems. A steering
committee, composed of
a dozen metropolitan
planning organizations
(MPOs), the research
Cost Module
Alternatives Comparison
Module
Benefit Valuation
Benefits Module
•
•
•
•
IDAS control alternative assignment
Mode choice
Temporal choice
Induced/foregone demand
•
•
•
•
IDAS ITS option assignment
Mode choice
Temporal choice
Induced/foregone demand
Travel Time/Throughput
Outputs
•
•
•
•
•
•
Performance
Cost/benefit analysis
Sensitivity analysis
Ranking of ITS options
Risk analysis
Plots of link volumes
and speeds
Environment
Safety
Travel Time Reliability
∆ Traditional benefit measures
∆ Non-traditional benefit
Figure 1. IDAS Model Structure
Did you know?
McTrans spring 2000
TSIS-CORSIM
• New channelization code logic
introduced in TSIS 4.32 can affect overall
results. In the previous version of TSIS
(4.2), the channelization code of zero or
blank would sometimes behave as
partially restricted, based on an intersection’s configuration. However this
internal logic was having difficulty under
complex scenarios. Therefore, the channelization code of zero or blank is now
strictly interpreted as representing an
unrestricted lane. The current version of
CORSIM is now capable of simulating
1000 nodes: 500 in Netsim, and/or 500 in
Fresim. This is nearly double the number
of nodes that could be simulated in the
previous version. Also, CORSIM is now
capable of simulating all-way stop
controlled (AWSC) intersections in addition to two-way stop controlled (TWSC)
intersections. Earlier versions were not
capable of simulating AWSC
intersections.
• For some reason related to the development system that was used to create
Trafvu, there is a significant slowdown in
performance when the computer’s color
palette uses more than 256 colors. If anyone wants to make Trafvu run faster they
should check their display properties
and set the palette to 256 colors. Trafvu
won’t look any different because it’s
based on a 256 color system, but it will
run must faster. Unfortunately, some other programs might complain about
having too few colors and the quality of
other graphics will suffer. The Trafvu
team is trying to find out how to
eliminate the problem for future releases.
HCS-3
• In HCS-Signals, capacity of a permitted-only left-turn movement is
set equal to the number of “sneakers” per cycle, multiplied by the
number of cycles per hour, when
the opposing movement is
sufficiently congested. The
number of left-turn sneakers is between 1 and 2 vehicles per cycle,
and is computed as a function of
lane configuration and volume
distribution.
• HCS-Signals automatically checks
to determine whether a shared
left-turn lane operates as a “de
facto” exclusive left-turn lane, according to HCM specifications. If
the lane group does indeed operate as a de facto left-turn lane, the
report and the interface will
display “DefL” instead of “TL” next
to the data associated with that
lane group.
• In HCS-Arterials, level of service
scales change for different arterial
classes. The HCM procedures expect only one arterial class to be
used even though HCS-3 allows
multiple classes to be entered. It
so happens that the program only
recognizes the arterial class for
segment #1. Ultimately the Arterials interface may be changed so
as to allow only one arterial class
to be coded. If an arterial changes
characteristics enough to warrant
a different classification, it should
probably be analyzed separately
(i.e. using multiple data files).
TRANSYT-7F
3
• One common question among
TRANSYT-7F users involves the differences between results from multiple
cycle length optimization runs. If the
cycle search increment or the lower
limit cycle length is changed between
runs, this may produce differences in
the output and/or different optimal cycle lengths. The main reason for this is
differences in the initial timing plan.
When doing a cycle search T7F starts
each simulation with the results from
the last simulation and adds the extra
time to one of the phases on each
node. If you change the search
increment or the lower limit, initial conditions will be different for any given
cycle length evaluation. Moreover, differences in the initial timing and traffic
flow patterns can have a significant
impact on the hill climb optimization
process and simulation results.
• “Final” or “normal” optimization uses 8
hill climb step sizes whereas “quick”
optimization that occurs during a cycle
length search uses 6 hill climb step
sizes. Also, final optimization uses the
smallest (and most accurate) possible
simulation step size of 1 second,
whereas quick optimization uses a 3second simulation step size by default.
If better simulation accuracy is desired
during a cycle length optimization, the
input file may be modified to use a
smaller simulation step size than 3
seconds. However, this will increase
the program running time.
4
McTrans spring 2000
T
U
R
B
O
A R C H I T E C T U R E
HIPERPAV
he Turbo Architecture tool
is a high-level, interactive
software program to assist
transportation planners and system integrators, both in the public and private sectors, in the
development of regional and project architectures using the
National ITS Architecture as a
starting point.
The tool is an aid to the
planning and integration of ITS using the National ITS Architecture.
There are two ways to initially enter the information into Turbo
Architecture: via an interview or directly into tabular forms. The interview guides you through a series
of questions and options that
result in the creation of an inventory and a set of services.You may
also go directly to the tabular
forms to create this initial inventory and set of services. In either
case, this information initiates the
development of an architecture.
Once this initial data input is
complete, you can begin to
customize the architecture, which
is a necessary next step. Both the
interview and tabular forms help
you identify and extract the
pertinent National ITS Architecture
pieces you require. In addition, Turbo Architecture allows you to map
and tailor local system names and
descriptions to match local needs,
services and systems. Multiple
useful reports and diagrams are
available for display and printing.
You can extend the elements
defined in the National ITS
Architecture by adding your own
information flows and transportation elements for those areas not
covered by the National ITS Architecture.
HIPERPAV (HIgh PERformance
PAVing) is the first software tool
of its kind to provide real control
over concrete pavement
construction. With HIPERPAV, we
can now successfully integrate
materials with pavement design
with construction operations into
one easy to use Windows-based
software package. For decades,
researchers have studied specific
behaviors in concrete and developed independent models to
characterize these early-age
behavior patterns. HIPERPAV is
the first software package that integrates all these models into
one easy to use decision-making
tool. This integration captures all
aspects of a concrete pavement
construction project and
provides a real systems approach
to analyze the first 72 hours after
construction. With HIPERPAV, we
can now measure the
development of stresses and
strength in concrete pavement
during these critical first 72
hours, to maximize quality,
T
You can create a file that can
contain one regional architecture
and multiple project architectures.
Turbo Architecture allows you to:
• Create a regional architecture,
• Create a project architecture
when no regional architecture
exists,
• Create a project architecture
from an existing regional
architecture, and
• Add a previously-defined project architecture to an existing
regional architecture.
Turbo Architecture helps you integrate multiple project
architectures both with each other
and with a regional architecture. In
addition, Turbo Architecture
provides an initial start toward
both architecture development and
consistency with the National ITS
Architecture. Turbo Architecture is
a Windows™ application program
which produces Microsoft®
Access™-compatible data files
that you may further manipulate
using Microsoft Access™.
In order to properly use the Turbo Architecture tool, it is highly
recommended that the Turbo
Architecture user be familiar with
the National ITS Architecture (this
tool is not an introduction to the
National ITS Architecture). The
Turbo Architecture CD includes a
user’s manual and installation
guides as well as on-line help to
facilitate ease of installation and
productive use. The user’s manual
includes case studies and advance
techniques to aid the user.
Turbo Architecture (#TURBO)
by Iteris, Inc. is available at LOS 1
for $190.
increase long-term performance,
boost productivity, and optimize
pavement options.
HIPERPAV was developed by
Transtec in cooperation with the
Federal Highway Administration
and a Technical Working Group
which included pavement contractors, materials suppliers, industry
association representatives, state
and federal government officials,
and university professors and
researchers. This team ensured
that HIPERPAV is an easy to use
Windows based software that
takes just a few minutes to
operate, and produces sound, reliable results. HIPERPAV takes as
inputs the concrete pavement design criteria, mix design
proportioning, environmental conditions, and construction
conditions. As outputs, HIPERPAV
predicts the stress and strength
development in the concrete pavement, as well as moisture loss
from the surface of the pavement.
HIPERPAV (#HIPERPAV.W95) by
Transtec is available at LOS 1 for
$695.
McTrans spring 2000
PUMPING STATION ANALYSIS
PUMPR.EXE is a program for analyzing stormwater pumping
stations. It is written in Visual Basic for operation under Windows.
This new program replaces
Stormwater Pumping Stations
(#SPS).
In certain locations where a
positive outlet for stormwater is
not possible for all or part of the
time, such as inside a levee where
the adjacent receiving body of water is essentially at the same level
or higher than the land to be
drained, the construction of a
pumping station supplemented by
a holding (storage) basin is
required. The selection of a pumping station capacity and storage
basin volume depends on many
factors and several alternative configurations may be satisfactory for
a particular situation. This software
package is designed to assist the
engineer in the quick analysis of
any pumping station situation.
The program is intended for use
in large installations that employ
mixed flow or axial flow type
pumps with reasonably steep
head-capacity curves where small
changes in the head on the pump
cause only minor changes in pump
capacity. The program may be
used to analyze other types of
pumping stations such as
underpass pumping stations but
with less accuracy.
Inputs to the program are the
ordinates of the runoff hydrograph
(input from a file). They include: the
number of pumps (maximum of
four), the storage in the holding
basin in acre-feet at each elevation
5
FREE CD
and the ON and OFF elevations
and capacity in gallons per minute
of each pump.
In addition to the PUMPR.EXE
program, a program for computing
runoff hydrographs (DABRO.EXE),
two programs for computing storage in holding (storage) basins
(DBVOL.EXE and
DBVOLRECT.EXE and a plotting
program (PLOTITB.EXE) is included in the package. All are written in
Visual Basic for operation under
Windows. The plotting program will
plot up the runoff hydrograph and
the pumped outflow program on
the same axis.
Pumping Stations Analysis
(#PSA) by Bernard L. Golding is
available at LOS 6 for $125.
Advanced Traffic Analysis
CD (#TRAFFIC.CD) is a
self-running multimedia
presentation from FHWA
designed to raise awareness
and encourage use of USDOT
sponsored research in traffic
analysis. Include this free
CD on your next order.
Need Training?
the deal …
McTrans provides:
Advertising in our newsletter,
on the website, via e-mail and
through mailed flyers.
Registrations of participants,
including managing the fees,
providing information on the
training location and
accommodations.
Workbooks for each participant
for use in the course, including
comprehensive information on
the subject and applicable
workshops.
Instructors for the course to
provide both lectures on the
procedures and software workshops or demonstrations.
Highway Capacity Analysis
Site Impact Analysis
Access Management
Transit Capacity
Work Zone Safety
Travel Demand Modeling
Traffic Engineering Fundamentals
Hosts provide:
Access to an appropriate training
site for the course
(computer lab or
meeting room).
Information on
the local area.
Travel is eliminated for your attendees!
Consider hosting a workshop or seminar! Here’s
Free registrations!
For more information or complete course brochures, please contact Bill Sampson at (352) 392-0378, extension 241 or e-mail: [email protected]
6
McTrans spring 2000
Updated Products
HDM-4
Highway Development and Management System
The Highway Design and Maintenance Standards Model
(HDM-III), developed by the World Bank, has been used for
over two decades to combine technical and economic
appraisal of road investment projects, standards and strategies. The International Study of Highway Development
and Management (ISOHDM) has extended the scope of
the HDM-III model to provide a harmonized systems
approach to road management, with adaptable and userfriendly software tools. The new Highway Development
and Management (HDM-4) system is the result of the
study.
HDM-4 Key Features:
Applications:
Three separate levels:
•
Project analysis
•
Program analysis
•
Strategic analysis
Road Deterioration Models:
•
Bituminous pavements
•
8 generic types
•
Defects
•
Concrete (Rigid) pavements (3 types)
•
Unsealed pavements (3 types)
•
Model coefficients can be changed to ease calibration
Road User Effects Models:
•
New/improved vehicle operating cost models to reflect
changes in vehicle technology
•
Acceleration effects (due to speed fluctuations)
•
Non-Motorized vehicles operation costs
•
Road safety (accident rates and costs)
•
Work zone effects (scheduled for version 1.1)
Data:
•
Date hierarchy based on Information Quality Level
(IQL) concept
•
Import and export of input data
Dimension:
•
Road sections – Unlimited
•
Motorized Vehicle types – Unlimited
•
Non-Motorized Vehicle types – Unlimited
•
Maintenance standards – Unlimited
•
Study alternatives – Unlimited
Road Works:
•
Routine maintenance
•
Drainage effects
•
Periodic maintenance
•
Road Improvements
•
Intervention criteria include road user effect parameters
Social and Environment Effects Models:
•
Energy Consumption
•
Vehicle emissions
•
Traffic noise (scheduled for version 1.1)
Eight volumes of user documentation are included on the
CD with HDM-4:
•
Overview of HDM-4
•
Technical User Guide
•
Software User Guide
•
Applications Guide
•
Calibration Guide
•
Road Deterioration and Works Effects
•
Road User Effects
•
Programmers Guide
Unbound, black and white hard copies of the
documentation are also available. HDM-4 (#HDM-4) from
PIARC is available at LOS 1 under various license packs.
Visit our website mctrans.ce.ufl.edu for complete ordering
information.
INTEGRATION 2.20
TURNS/TEAPAC Windows Version
INTEGRATION 2.20 is a trip-based microscopic traffic assignment,
simulation, and optimization model that is capable of modeling networks of up to 10,000 links and 500,000 vehicle departures. The
model is designed to trace individual vehicle movements from a vehicle’s origin to its final destination at a level of resolution of one
deci-second.
The model simulates the departures of vehicles from a timevarying origin-destination (O-D) table. Vehicles are assigned to the
network using a time-varying multi-class traffic assignment.
Vehicles select their speed based on link-specific car-following relationships however, vehicle acceleration capabilities are constrained
by the vehicle’s characteristics. In addition, the model captures
mandatory and discretionary lane changing together with gap
acceptance behavior.
The model computes a number of measures of performance including vehicle delay, stops, fuel consumption, hydrocarbon emissions, carbon monoxide emissions, nitrous oxides emissions, and
the crash risk for 14 crash types.
The popular program TURNS/TEAPAC for turning
movement traffic count tabulation and analysis
has recently been released by Strong Concepts
as a new Windows-based program. Like its DOS
predecessor, TURNS for Windows performs a tabulation and comprehensive peak hour analysis of
turning movement count data. Tabulations include
raw counts and 15-minute totals for the
intersection and every movement, approach and
exit as well as 15-minute volume rates and peak
hour analyses which can be output directly to other TEAPAC programs like SIGNAL97,
PREPASSR, PRETRANSYT, PRENETSIM and
SITE for signal timing studies and site traffic
impact studies. TURNS can import count data
from various electronic turning movement
counters like Jamar and has an option to perform
a signal warrant analysis for all of the volumebased warrants prescribed by the Manual on Uniform Traffic Control Devices (MUTCD).
TURNS is now available for several Windows
platforms. The Windows versions have all of the
features noted above (found in the DOS version),
plus a unique Visual Mode that provides an
intuitive, graphical user interface as a true
Windows program. This Visual Mode is the same
Model Features and Capabilities
INTEGRATION is unique in a number of aspects. First, the model
combines traffic assignment with microscopic simulation. Second,
the model captures the vehicle dynamics in terms of its
acceleration and deceleration behavior. Third, the model includes a
microscopic energy, emission, and safety model. Finally, the INTEGRATION software provides flexibility in modeling numerous Intelligent Transportation System (ITS) applications.
Integration (#INTEG) is available at LOS 6 for $395.
WinTEAPAC2000 interface found in other
TEAPAC programs such as WinSIGNAL97. These
Windows versions also provide a fully indexed, online user guide and context-sensitive help. Data
files are fully interchangeable with the DOS
version of TURNS, for either previous or current
versions. The .W95 versions will run on any of the
Windows 95/98/2000 or Windows NT platforms;
the .WIN versions will run on any of the Windows
3.x or Windows 95/98 platforms.
The basic Tabulation and Peak Hour Analysis
version of TURNS/TEAPAC Ver 3.42 from Strong
Concepts (#TPCTRN.1, #TTPCTRN.1.WIN and
#TPCTRN.1.W95) is available at LOS 7 for
$295. The full-function version (#TPCTRN.2,
#TPCTRN.2.WIN and #TPCTRN.2.W95) which
adds the MUTCD Signal Warrant Analysis
functions of WARRANTS/TEAPAC described below is available at LOS 7 for $595 from
McTrans. Educational versions are available for
half-price and demonstration versions are
available free as downloads from the WWW
(#TPCTRN.0, #TPCTRN.0.WIN and
#TPCTRN.0.W95). Registered licensees of DOS
versions of TURNS may upgrade to a Windows
version at a reduced fee directly from Strong Concepts. See the Strong Concepts ad on page 11.
McTrans spring 2000
WARRANTS/TEAPAC Windows Version
WinTEAPAC 2000
The popular program WARRANTS/TEAPAC for MUTCD Signal Warrant
Analysis has recently been released by Strong Concepts as a new Windows-based program. Like its DOS predecessor, WARRANTS for Windows performs a signal warrant analysis for all of the volume-based
warrants prescribed by the Manual on Uniform Traffic Control Devices
(MUTCD), including warrants 1, 2, 6, 8, 9, 10 and 11. Every possible 60minute period of the count data is searched, starting on each 15-minute
interval. Volume inputs can be from count sheets or direct from electronic counters like Jamar, and non-volume inputs can be made for the other warrant conditions which must be met. WARRANTS also has an
option to perform a comprehensive peak hour analysis and export peak
volume data to other TEAPAC programs like SIGNAL97, SITE,
PREPASSR, PRETRANSYT and PRENETSIM for signal timing studies
and site traffic impact studies.
WARRANTS is now available for several Windows platforms. The
Windows versions have all of the features noted above (found in the
DOS version), plus a unique Visual Mode which provides an intuitive,
graphical user interface as a true Windows program. This Visual Mode
is the same WinTEAPAC2000 interface found in other TEAPAC
programs such as WinSIGNAL97. These Windows versions also
provide a fully-indexed, on-line user guide and context-sensitive help.
Data files are fully interchangeable with the DOS version of
WARRANTS, for either previous or current versions. The .W95 versions
will run on any of the Windows 95/98/2000 or Windows NT platforms;
the .WIN versions will run on any of the Windows 3.x or Windows 95/98
platforms.
The basic Warrant Analysis version of WARRANTS/TEAPAC Ver
1.22 from Strong Concepts (#TPCWAR.1, #TPCWAR.1.WIN and
#TPCWAR.1.W95) is available at LOS 7 for $395. The full-function version (#TPCWAR.2, #TPCWAR.2.WIN and #TPCWAR.2.W95) which
adds the Tabulation and Peak Hour Analysis functions of TURNS/TEAPAC described above is available at LOS 7 for $595 from McTrans. Educational versions are available for half-price and demonstration
versions are available free as downloads from the WWW (#TPCWAR.0,
#TPCWAR.0.WIN and #TPCWAR.0.W95). Registered licensees of DOS
versions of WARRANTS may upgrade to a Windows version at a
reduced fee directly from Strong Concepts. See the Strong Concepts ad
on page 11.
All Windows versions of TEAPAC programs have
been updated to include the new WinTEAPAC
2000 graphical user interface. The WinTEAPAC
2000 Interface (Interface Version 4.01) offers
many new features to enhance the computing
experience with TEAPAC programs. The following new features are among those provided by
the TEAPAC2000 Interface:
•
Context-sensitive link to Help file for error
messages.
•
Context-sensitive link to Help file for
program outputs.
•
Modernized dialog box design consistent
with Windows 95/98/NT.
•
New radio button and drop-down list input
features.
•
Sizable main window for better screen
display and integration with other running
programs.
•
New Toolbar buttons for common functions.
•
File name and save status displayed in main
window caption.
•
Help strings for menu options.
•
Dynamic title display during batch control file
execution.
•
New accelerator keys (shortcuts) for
common menu selections.
•
New File-Close menu option.
•
Sizable File-Open dialog.
•
Proportional scroll button for viewing output.
Update Watch
7
Other useful and unique features carried over
from the previous Windows Visual Mode
interface for TEAPAC include:
•
Visual Mode of input that shows graphically
what inputs are needed.
•
Optional Manual Mode of input for blazing
fast input by power users.
•
Context-sensitive link to Help file for all Visual Mode inputs.
•
Complete, fully-indexed manual on-line as
Help file.
•
Ability to create and run batch/script/macrotype control files.
•
Ability to drag a data or control file from Explorer to the running TEAPAC program.
•
Free program updates via Internet
downloads.
•
Complete data file compatibility between old,
new, DOS and Windows versions.
•
Complete Y2K compliance.
TEAPAC programs which now use this new
interface include SIGNAL97 (#TPCS97),
NOSTOP (#TPCNST), PREPASSR (#TPCPPS),
PRETRANSYT (#TPCPTR), PRENETSIM
(#TPCPNT), TURNS (#TPCTRN)and
WARRANTS (#TPCWAR). Licensees with
current Windows licenses for these programs
(August 1998 or later) can download the new
versions from the WWW. Discounted upgrades
and updates for these new versions are also
available for older licenses and DOS versions directly from Strong Concepts. See Strong
Concepts ad on page 11.
Package
Version
Status
Target
Distribution
HCS-3
TRANSYT-7F
TRANSYT-7F
TSIS
TSIS
3.2
8.1
8.2
4.3
5.0
In testing
Complete
Complete
Complete
Under development
Spring
Available
Available
Available
Fall
Automatic to registered users
Registered users may upgrade
Automatic to registered users
Automatic to registered users
Registered users may upgrade