1
IDAT: User’s Manual
IDAT
USER MANUAL
Version 1.2
March 2015
IDAT: User’s Manual
Contents
Contents .......................................................................................................................................................... 1
1.
What is IDAT ......................................................................................................................................... 2
1.1.
Introduction .................................................................................................................................... 2
1.2.
What’s new? ................................................................................................................................... 2
2.
Launching IDAT software ...................................................................................................................... 3
3.
Initial Screen, the Search Pane ............................................................................................................... 4
4.
3.1.
Search Pane: Results Screen, Tables .............................................................................................. 5
3.2.
Search Pane: Results Screen, Plotting ............................................................................................ 7
3.3.
Search Pane: Results Screen, Parallel Axis plots ........................................................................... 8
3.4.
Search Pane: Results Screen, View and Plot Neutron Balance ...................................................... 9
3.5.
Search Pane: Results Screen, Spectra and Sensitivity Plots ......................................................... 11
3.6.
Search Pane: Results Screen, MeshTal Viewer ............................................................................ 12
3.7.
To Do List For Mesh Plots: .......................................................................................................... 17
Rank Similar Pane ................................................................................................................................ 18
4.1.
To Do List For Find Similar Pane: ............................................................................................... 19
5.
Measurement Trend Plot Panes ............................................................................................................ 20
6.
Uncertainty Plot Pane ........................................................................................................................... 26
7.
Troubleshooting.................................................................................................................................... 27
7.1.
Startup problems........................................................................................................................... 27
7.2.
Speed problems ............................................................................................................................ 28
7.3.
Memory problems ........................................................................................................................ 28
7.4.
Java 3D installation ...................................................................................................................... 29
8.
Conclusion ............................................................................................................................................ 30
9.
References ............................................................................................................................................ 31
Appendix A: Glossary .................................................................................................................................. 32
Page 1 of 36
IDAT: User’s Manual
1. What is IDAT
1.1. Introduction
The International Reactor Physics handbook Evaluation Program (IRPhEP), Database and Analysis
Tool known as ‘IDAT’, is a search and analysis tool that has accompanied the annual IRPhEP DVD
release since 2013. Example uses of IDAT include:
finding sodium void reactivity experimental benchmarks,
searching for experiments done at the BFS1 facility,
examining C/E trends in keff by reactor system,
finding the light water reactor (LWR) keff measurement with the least uncertainty,
searching spectral indices measurements with minor actinides,
ranking experiments based on similarity of neutron balance information.
Features are described in this manual.
IDAT is based on the graphical user interface DICE [3] (Database for the International handbook of
evaluated Criticality safety benchmark Experiments), which has accompanied the ICSBEP Handbook since
2001.
The International Criticality Safety Benchmark Evaluation Program (ICSBEP) Handbook contains
mainly keff measurements; the IRPhEP Handbook contains an order of magnitude more measurement types,
and so, IDAT includes features for searching and trending these additional types. For instance, users can
query all experimental benchmarks of spectral indices measurements which use Ge-Li detectors.
Currently information from all 139 IRPhEP 2015 evaluations is contained in IDAT. The contents of
the CRIT, BUCK, SPEC, REAC, COEF, KIN, RRATE, and POWDIS measurements have been extracted
into a relational database. Since no accepted ISO benchmarks are in the current handbook, no searching or
trending capability exists for this type of measurement. MISC measurements are present in the handbook,
but not yet stored in the database.
IDAT incorporates interactive ways to interrogate the data, as well as, assist in the knowledge transfer
process.
1.2. What’s new?
New features have been added in IDAT 2015 edition database tool:
Parallel Axis plots (see chapter 3.3),
reduced Chi-Squared value displayed on trend plots,
tree structure for codes and libraries,
blue bars, indicating C/E uncertainties, displayed on multi-level plots,
descriptive pictures at the evaluation level.
Page 2 of 36
IDAT: User’s Manual
2. Launching IDAT software
IDAT is available on the IRPhEP Handbook DVD and online via Java Web start.
Requirements are:
A Java Runtime Environment, JRE, version 6 or higher. More recent versions (7 or 8) are
strongly recommended.
A reasonably fast internet connection to connect to the NEA database.
Have a large screen.
To start IDAT from the DVD:
on Windows: run the “idat.bat” file in the IDAT folder,
on Linux: run the “idat.sh” file in the IDAT folder,
on Mac OS X: run the Mac bundle in the IDAT/mac_os_x folder.
See Startup problems for troubleshooting startup problems.
IDAT has been primarily tested on Windows + Linux, and minimal Macintosh testing. The tool is most
likely to work on windows machines, as this is the current development environment. Some mesh plotting
features are known to not work on Mac’s.
Page 3 of 36
IDAT: User’s Manual
3. Initial Screen, the Search Pane
IDAT is organised into panes. By default IDAT initially displays the search pane, shown in Figure 1. This
pane has a similar appearance and functionality as DICE.
Currently eleven panes exist. The panes are:
Search (Shown in Figure 1),
Rank Similar (See Rank Similar Pane),
Trends Plots panes CRIT, BUCK, SPEC, REAC, COEF, KIN, RRATE and POWDIS (See
Measurement Trend Plot Panes),
δ CRIT (See Uncertainty Plot Pane).
Note: Each of the above panes can be ‘cloned’ by right clicking on the pane tab and selecting ‘clone
pane’, allowing the user to view multiple independent panes at the same time.
Figure 1 depicts a search for LMFR cases. Individual evaluations can be chosen by using the drop down
box, as is shown in the figure. When searching multiple criteria, the user can hold down the CTRL or
SHIFT key to select multiple items. A preview of the number of evaluation and cases to be returned is
shown in the bottom left corner. Pressing the “Search!” button, located in the bottom right corner, executes
the query.
Figure 1: Searching for liquid metal fast reactors.
IDAT has three search types, selection lists, numeric values and text fields (All are similar to DICE).
Selection List: Users can select one or more items from the list. Items can be grouped together by using
the CTRL or SHIFT keys.
Page 4 of 36
IDAT: User’s Manual
Numerical Values: User selects a value or a range of values. A numeric value in scientific notation can be
used (e.g. 1E3 means 1000).
Note: If a numeric value is invalid, it is displayed in white on a red background (e.g. you cannot add a
percent sign [%] in the accuracy field).
Text Fields: User enters a word or part of a sentence in the text field. This criterion also supports a
wildcard character (‘%’). Also present is a “case sensitive” checkbox.
The query pane, located at the bottom of the screen, displays the search criteria currently set. Also shown
to the left of the search button, are the columns selected to be displayed in the results window
(Measurements and Total keff Sensitivity in the example shown in Figure 2).
Figure 2: Query Pane located at the bottom of the search tab
Each time a criterion is added, changed, or removed, the status bar is dynamically updated to display the
number of evaluations and cases matching the current criteria.
Note: The query panel to the left of the search button indicates the data that will be returned from the
search; if a search is executed and none of the cases contain the desired data (Total keff Sensitivity
over all energy for instance in Figure 2) the query will fail. The user is redirected to the no results
screen. The user should then consider deleting the offending items from the query panel by
selecting the text and pressing the delete button or by pressing the “Clear”.
3.1. Search Pane: Results Screen, Tables
Once the query is executed a results window is returned, as shown in Figure 3.
The results can be viewed and plotted in multiple formats:
flat table, with all columns displayed in a single table (Recommended for first time users),
hierarchical tables, evaluations appear in one pane and cases in the other (horizontal or vertical
split),
plots,
balance plots,
spectra plots,
sensitivity plots.
In Figure 3, the “Measurements” box is checked on the left side of the screen in a Vert. view, producing
two lists, the top which contains information at the evaluation level and a bottom list which contains
information at the case level, in this instance the measurements done at the case level. By checking the
Page 5 of 36
IDAT: User’s Manual
various boxes, a user can display ~all of the data which is stored in the data base. An explanation of the
terms is included in Appendix A: Glossary.
Figure 3: Displaying the parameters in the database
Only the evaluations returned from the initial search are available to the user from the results screen. To
return a different set of evaluations, press the “New search” button, and execute a new query.
To return the initial search pane, see Figure 4, the user can press either the ‘Refine search’ button, which
retains the selected columns and search criteria, or the ‘New search’ button which will start a blank new
search (that is, with no search criteria and with only the Identification and Measurements columns selected
for results display).
Figure 4: Refine and New search buttons on results screen
Note: blue text in results table are links to associated files (evaluation for instance in Figure 3), double
clicking them to open these files (evaluation PDF in the case of blue evaluation id’s, but also
pictures, calculation inputs files, balance files, mesh tallies). If needed the path to the Handbook
folder containing all evaluations PDFs (either on the DVD or a copy on hard drive) can be changed
in FileSettings.
Page 6 of 36
IDAT: User’s Manual
3.2. Search Pane: Results Screen, Plotting
Parameters in the evaluations returned from a search can be displayed in graphical form by clicking the
“Plots” button. An example is shown in Figure 5.
Figure 5: Plotting the parameters in the database
To plot the data, select “X axis”, “Y axis”, and “Series” from the selected results columns. At least one
numerical column must be present in order to obtain plots. The text columns cannot be used in plots, but all
others can, except for the “Y axis”, which requires a numerical column (e.g. “Number of cases”). For
example, you can plot “C/E” (Y axis) against “Evaluation identification”.
By right-clicking on the plot, a contextual menu allows the user to:
set plot properties (title, legend, ticks)
save the plot in a file
print the plot
zoom in or out.
The user can also use the mouse to zoom in by pressing the left button and then dragging the mouse from
the top-left to the bottom-right corner. To reset the zoom level, drag the mouse from the bottom-right to the
top-left. To display the data values corresponding to each point, hover the cursor over the point to display a
tooltip showing its coordinates.
Note: The legend is not displayed when there are more than 20 items to show. Press the “Select columns”
button to to hide the left pane and enlarge the plot.
Page 7 of 36
IDAT: User’s Manual
3.3. Search Pane: Results Screen, Parallel Axis plots
Parallel Axis Plots allows visualizing the relationship between search results values.
Figure 6: Plotting the parameters in the database
Search results table columns are represented as vertical axes. For each results table row a polyline links its
values on each axes. See http://en.wikipedia.org/wiki/Parallel_coordinates for a longer description.
The checkboxes at the bottom allow selecting the search results columns which should be displayed as
vertical axes.
Numerical fields and classification fields (e.g. Fuel, Moderator/Coolant...) can be displayed by this
visualization, text ones (e.g. Title) cannot be selected, by default only the first result table columns are
initially selected.
You can drill down in the values in two different ways:
By zooming a given vertical axis : click and drag in the yellow background area or a vertical axis;
By limiting the range of values displayed for a given axis: click on the upper/lower axes triangle
and drag them to define a range, the polylines of the search results with value in this range only
will be displayed.
Note:
Axes can be reordered by clicking and dragging their titles, this is the most efficient way for
revealing trends;
Axes can be moved left and right in their vertical band : click on axis and drag it;
The polyline segments colours express their weight, that is the number of cases that a given
segment represent, the colour scale used is the light spectrum from blue (low weight) to red (high
Page 8 of 36
IDAT: User’s Manual
weight), in current implementation the segments are not drawn in increasing weight order, so small
weight ones may obscure the greatest ones;
Double clicking on polylines will switch into a mode where all will be drawn in black and the one
near the location you double-clicked will be highlighted in red;
A contextual menu is available with a right click on the plot:
o 'Intensity mode' controls the polylines colouring scheme;
o 'Make uniform'/'Make all uniform'/'Reset positions' controls the distribution of numerical
values along axes : according to their magnitude (the default) or evenly spaced ('uniform');
o 'Selection dialog' bring a dialog which allow highlighting some of the results (by selecting
row(s) in the table popup);
o 'Column role', 'Column axis dimension', 'Clear all column axes' options have no effect in
DICE.
Saving with menu “File > Save” is not yet implemented, take a screenshot instead.
3.4. Search Pane: Results Screen, View and Plot Neutron Balance
In addition to containing neutron balance information, IDAT allows retrieval and visualisation of the
capture and fission data contained in the neutron balance files. To view a balance text file, click the check
box “Balance” as shown near the bottom left of Figure 7, followed by the apply button. Double clicking
the blue text ‘Balance’ will pop up a text file with the neutron balance information for the entire
system (not the core as in DICE).
Figure 7: Searching for the balance files available in IDAT
Page 9 of 36
IDAT: User’s Manual
Alternatively the neutron balance data can be plotted to allow for visual cross comparisons between the
cases. Pressing the “Balance plot” button, opens a new window, with a list of balance files, all of which
can be plotted. The list is linked to the cases returned from a search. An example is shown in Figure 8. The
user can filter the isotopes displayed and/or limit the number of isotopes displayed using the ‘Top N’
selector located at the bottom right corner.
Figure 8: Plotting the available balance files.
The balance files have been computed by running MCNP and KENO models included in IRPhEP. In
MCNP, when not present, the PRINT card has been added and the MCNP output from the table that begins
with “Total over all nuclides” has been extracted, along with the number of neutrons that have leaked out
of the model, and the average number of neutrons per fission. In KENO, the utility code KMART has been
run, to generate the 3-group reaction rates. It is possible to have a single case with neutron balance
information computed by two different codes, or two different libraries.
For searching purposes the database stores the percentage of captures, normalised to 100% and the
percentage of fissions normalised to 100%, while the plots normalise to 1000.
Note: In the case of two different libraries, where library A contains balance information by element, while
library B contains balance information by isotope, IDAT will sum the isotopic neutron balance information
in library B and add summed balance information in the element column on plot. The balance information
by isotope remains on the plot as well.
Page 10 of 36
IDAT: User’s Manual
3.5. Search Pane: Results Screen, Spectra and Sensitivity Plots
Figure 9: Spectra plot in IDAT
IDAT can plot spectra and sensitivity data. Clicking on the “Spectra plots” or “Sensitivity plots” buttons,
will return a plot screen with a list of evaluations that have matched the query and contain either spectra or
sensitivity information, depending on the plot type selected.
To plot:
Select the dataset(s) in the tree on the lower right pane.
Select the representation:
Y axis log (for Spectra only).
Per unit lethargy/Per unit energy/Total within bin.
Normalisation: to one or the default normalisation (for Spectra only).
Energy Group structure: select one structure from the drop-down list, press the “…” button to add
an energy file to this list.
All data share the same representation. When you change the energy group structure, all plots and the table
are automatically updated.
To zoom in, drag the mouse from the top-left corner to the bottom-right corner. To reset the plot to its
initial zoom level, drag the mouse from the bottom-right corner to the top-left corner.
You can switch between the plots and a tabular display by using the buttons “Plots” and “Table”.
Click on the “Clear” button to remove all plots and empty the table.
Click on the “Load own data…” button to add a curve from a file.
The “Lines width” spinner change plots thickness (all other plots settings are available by right clicking on
the plot and selecting “Properties...” in the popup menu)
Page 11 of 36
IDAT: User’s Manual
A sensitivity file must be in any of the following formats in order to plot:
ABBN sensitivity format,
TSUNAMI1D [TSUNAMI A format],
TSUNAMI3D [TSUNAMI B format],
WPEC SG33.
Check the corresponding button in the Open file dialog before pressing the OK button.
3.6. Search Pane: Results Screen, MeshTal Viewer
The MeshTal viewer is a standalone tool that can be invoked within IDAT. It is used to plot fluxes and
reaction rates of IRPhEP handbook benchmark models, giving users access to qualitative plots. To access
this functionality, click the check box “Mesh Tallies” as is shown in Figure 10, followed by the apply
button.
Double click one of the blue text ‘Meshtal’ in the list, which starts the viewer.
Figure 10: Searching for mesh files available in IDAT. Press the blue word Meshtal, to invoke the plotter.
Each user likely has software to visualise mesh plots generated by their own code; the MeshTal viewer is
not intended to be the best visualisation tool, rather to provide a quick visualisation tool to assist in the
understanding and modelling of IRPhEP benchmarks.
The tool can:
allow users of the database understand the physics of a particular evaluation,
allow users to compare a benchmark model they have created, with the benchmark models
distributed with IRPhEP,
Page 12 of 36
IDAT: User’s Manual
facilitate comparisons between libraries, codes,
visualise reaction rate data.
Currently the MeshTal viewer can read specific output formats of MCNP, SERPENT, and DANTSYS with
sample input cards shown at the end of this section, as well as limited KENO mesh files. In theory any
model could be run and results read into the MeshTal viewer.
Four plot panes are accessible for each plot:
2D Slice, Shown in Figure 11,
2D Surf, Shown in Figure 12,
3D View, Shown in Figure 13,
3D Isosurface, Shown in Figure 14. The isosurface plots the flux/reaction rate above a threshold
value, controlled by the slider bar.
Figure 11: 2D Slice, NRAD thermal captures. Bottom plot displays capture profile along X-axis at the point the cursor is
located.
Page 13 of 36
IDAT: User’s Manual
Figure 12: 2D Surface plot, RMBK thermal flux
Figure 13: 3D tomographic view, ATR thermal flux.
Page 14 of 36
IDAT: User’s Manual
Figure 14: 3D Isosurface view, RHF thermal capture
Features/Options in MeshTal Viewer:
PoV: Change the 2D Slice view to different perspectives TOP, BOTTOM, FRONT, BACK, LEFT,
RIGHT.
Paste X,Y,Z, Value data: Within 2D slice, allows the user to mark X,Y,Z data. The intent is to allow
importing of RRATE measurement data onto the mesh plots.
Show Rel. Err: Click this box to plot the error associated with a mesh tally, if it is contained in the mesh
file. Error of the mesh file has been chosen solely based on run time considerations.
Show Grid: Overlays the rectangular mesh that was used to create the mesh plots. The mesh has been
selected based on file size considerations. Most mesh files are ~100 Mb unzipped and 10 Mb zipped.
Colour Scale: Rainbow is the default colour scale, setting the highest value across all points to red and the
lowest to blue. Plus minus, results in all values red and all negative values blue, black and white is useful
when importing the plots into black and white publications.
Per slice colour scale: The maximum value in the shown slice (rather than the maximum value of all
slices) is set to the maximum of the colour scale.
Log colour scale: User plots the log of the fluxes and reaction rates.
Zoom: This slider bar is used in the 2D Slice plots, but for other plots the bar is supplanted by the mouse
wheel.
Right Slider Bars: Allows the spatial position or energy displayed to be adjusted. Automatically created
based on reading the mesh file. All mesh files have been generated in 3 groups for IPRhEP, but an arbitrary
Page 15 of 36
IDAT: User’s Manual
group structure and spatial mesh can be used. For isosurfaces the slider bar controls the threshold value for
points to be plotted, for instance raising the slider bar will result in reaction only over a certain threshold,
allowing the user to determine maximal points.
Plot horiz. Axis: Allows the user to see the multi-group energy profile at the point of the cursor, or a
X,Y,Z profile of the fluxes and reaction rates.
Files: By default, when invoking the MeshTal viewer from IDAT, the file is loaded into A: (but not
displayed). The user can load a different mesh file into B. Then using the display options, different
operations such as taking the difference between the two files can be performed.
XForm A/B coord: Allows the coordinate system to be transformed. This feature should be used when
comparing the mesh results between two models which were calculated with different origins.
Users can put their own models into the MeshTal viewer. Currently the import formats are limited, but
slowly being expanded. Examples of MCNP and SERPENT input cards that will generate compatible
output files are shown below. Note the MeshTal viewer can read in both .zip and .gz files.
Example of MCNP Mesh input card
FMESH4:N
GEOM=xyz ORIGIN=-90 -90 0
IMESH=90 IINTS=180
JMESH=90 JINTS=180
KMESH=200 KINTS=10
OUT=ij
EMESH=0.625e-6 0.100 20
c Capture Tally
FMESH14:N GEOM=xyz ORIGIN=-90 -90 0
IMESH=90 IINTS=180
JMESH=90 JINTS=180
KMESH=200 KINTS=10
OUT=ij
EMESH=0.625e-6 0.100 20
FM14:N -1 0 -2
c Fission Tally
FMESH24:N GEOM=xyz ORIGIN=-90 -90 0
IMESH=90 IINTS=180
JMESH=90 JINTS=180
KMESH=200 KINTS=10
OUT=ij
EMESH=0.625e-6 0.100 20
FM24:N -1 0 -6
c Scattering Tally
FMESH34:N GEOM=xyz ORIGIN=-90 -90 0
IMESH=90 IINTS=180
JMESH=90 JINTS=180
KMESH=200 KINTS=10
OUT=ij
EMESH=0.625e-6 0.100 20
FM34:N -1 0 2
Examples of SERPENT Mesh input card
ene 1 1 1E-11 0.625E-6 1.00E-1 20
det 14 de 1
dx -80 80 160
dy -80 80 160
Page 16 of 36
IDAT: User’s Manual
dz 0 250 10
det 24 de 1 dr -2 void
dx -80 80 160
dy -80 80 160
dz 0 250 10
det 34 de 1 dr -6 void
dx -80 80 160
dy -80 80 160
dz 0 250 10
det 44 de 1 dr -3 void
dx -80 80 160
dy -80 80 160
dz 0 250 10
Notes about DANTSYS mesh plots.
MeshTal Viewer can plot DANTSYS rmflux files, if the input and output are located in the same directory,
and if the output is named “<my_output>.<EXT>” and the corresponding input named “EXT.inp”.
3.7. To Do List For Mesh Plots:
Expand the number of compatible file formats. For example, currently uses MCNP out=ij format,
which is not the default. Also, doesn’t work with non rectangular mesh tallies.
While different tally numbers can be used, in MCNP F4,F14,F24,F34 will automatically be
labelled as Flux, Capture, Fission, Elastic Scattering.
In the tallies provided with IDAT, the higher number mesh tallies, which don’t display anything,
are 299 group tallies earmarked for subsequent extraction into IDAT.
Page 17 of 36
IDAT: User’s Manual
4. Rank Similar Pane
The Rank Similar pane allows users to rank benchmarks based on 3 group fluxes, neutron balance data,
and sensitivity.
Currently the pane applies a Euclidean distance metric to the 3 group flux, capture, fission, neutron balance
or sensitivity information, and returns a sortable list with the case label, code, library and ranking. The
rankings are normalised on a scale where the most similar system is given a numerical value of 1.000, and
the least similar is assigned a value of 0.000. A shade of green is used to highlight values close to 1.000.
An example of a search where the user inputs the percentage of fissions in 3 groups is shown in Figure 15.
Figure 15: Rank similarity pane, experiments are being ranked based on the similarity of neutron balance information
Cases that do not have calculated neutron balance data can be returned in the list using the check box,
‘Show cases with no data’. The similarity ranking is left blank for these cases. Coverage of the number of
cases with data is displayed to the right of the checkboxes.
A single case can have information computed with different codes and nuclear data libraries. Thus, the
impact of using a different nuclear data library or code on the similarity metric can be investigated.
Neutron balance data can also be entered manually by clicking the ‘Enter manually’ button, which pops up
a table for data entry. As shown in Figure 16, the user can enter all the nuclides, with the number of
captures, fissions and (n,2n) reactions. The software will then determine the similarity between the entered
neutron balance data, and all other balance data stored in the database. The similarity is normalised so that
the most similar system has a similarity of 1 and the least similar has a similarity of 0.
Page 18 of 36
IDAT: User’s Manual
Figure 16: Pop up window to manually enter neutron balance data
For 3- group percent fission the metric and neutron balance information the similarity metric used is,
Where p is system one, q is system two. For multi-group fission, N is the percentage of fission in each
group, while for neutron balance, N is the capture, and fission for each element, except that for fissile
elements the distance is by isotope. It is expected that the neutron balance calculations will be done with
multiple codes and data libraries. This will allow users to observe differences in the balance information
produced by these codes and libraries.
The 3-group sensitivities check box allows a calculation to be done to identify which experiment contains
3-group keff sensitivity, most similar to a 3 group sensitivity profile input by the user. In this case the
Euclidean distance is computed without dividing by
.
Currently, most balance information is computed with MCNP and KENO, owing to the large number of
models distributed with ICSBEP and IRPhEP. To generate the balance file in MCNP, the PRINT card has
been inserted into the ‘*.inp’ file if previously absent, and the table “total over all nuclide” was extracted
and converted to a simplified format, using a script.
Note: IDAT numbers correspond to the balance numbers corresponding to the entire system, while in
DICE the balance information of the reactor core is used. Users should be aware of the difference.
4.1. To Do List For Find Similar Pane:
Introduce more metrics for similarity.
Use ranking in C/E trends plots.
Page 19 of 36
IDAT: User’s Manual
5. Measurement Trend Plot Panes
The measurement panes give an overview of the trends in C/E within the database for a particular
measurement. This differs from the plots in the Search pane, which was originally implemented as an error
check for DICE data. In IDAT, the intent is to first allow the user to see the overall information content in
the database and apply filters to ‘drill down’ to a particular data set.
Eight measurement trend plot panes currently exist: CRIT, BUCK, SPEC, REAC, COEF, KIN, RRATE
and POWDIS.
Figure 17 shows a typical result of the keff pane. Each of the tabs has a similar functionality for the
different measurements. An explanation of the quantities displayed is below.
Figure 17: Plot of the C/E associated with keff measurements, averaged by reactor type.
Page 20 of 36
IDAT: User’s Manual
Bars Correspond to Average Values:
Each red bar represents an average value, while the dotted blue bar is the overall average. To display
additional information about the number of points used in the average or the value and standard deviation,
hover the cursor over the bar. The averaging for each bar can be performed via four methods using “Plot
Options” drop down box, see Figure 18.
Figure 18: Drop down box with average options on plot panes
In all formula, N is the points at which both a C and an E value exist.
ARITHMETIC
GEOMETRIC [4]
In the case of a negative C/E, the geometric mean is calculated by separating the positive and negative
components, computing the geometric mean of each, and then computing a weighted average of the two
geometric means, where the average is weighted by the number of data points [5].
WEIGHTED BY VALUE
With W
Useful in reaction rate tallies, when C/E averages are dominated by points with low reaction rates.
Page 21 of 36
IDAT: User’s Manual
WEIGHTED BY UNCERTAINTY
With W
where
In this formula, C/E values with no uncertainty are eliminated from the calculation.
Uncertainty associated with each bar from averaging of multiple data points: Standard deviation bars
The uncertainty bar corresponds to the standard deviation of all C/E values within a data set.
Correlations should be taken into account; however there is not sufficient information within the database
to include correlations at this point.
Uncertainty associated with each bar from measured and calculated uncertainty: Blue band uncertainty
The blue band uncertainty is the RMSE of the combination of the benchmark error (located in the E.
Uncertainty or E. Uncertainty RMS column) and the calculated error (Located in the C. Uncertainty or C.
Uncertainty RMS Column).
In the absence of errors and approximations (code+modelling+nuclear data+ etc) one would anticipate that
the C/E would fluctuate in this range.
For single level plots the number of data points can be reduced by checking the box beside the word Top,
in the plot options. Using the drop down box in plot options, the results can be sorted by highest or by
lowest C/E.
Note: The user will encounter E.Std dev and E. Uncertainty RMS. The first occurs when multiple points
have been collapsed, for example the standard deviation of the collapsed C/E’s; if there is only 1 data point,
this value is always zero. The second refers to the experimental uncertainty, which, if multiple data points
are present is RMSE (Root-mean-square-error).
Double clicking on a specific entry in the table returns a popup window with the data points, in the case of
SPEC and RRATE this list contains multiple points in a table which can also be plotted in 1-dimensional
plots as shown in Figure 19.
Page 22 of 36
IDAT: User’s Manual
Figure 19: Pop up window returned after double clicking on a row in the RRATE pane
Reduced Chi-Squared Value
In each trend plot the user can chose to display the reduced chi-squared value, which is a metric indicating
the performance of the computed averages. Based on whether the user selects points or bars, the goodness
of fit of the overall average, or the categorical averages can be displayed. If the reduced chi-squared value
is high, then C/E values are fluctuating more than the uncertainty of the benchmarks within the categories.
The equation computed is:
Where
is the computed average, either the overall average of all points, , or the average within each category;
with the radio button points corresponding to the former and bars to the later.
corresponds to the number of degrees of freedom. When the radio button ‘points’ is selected, the number
points minus 2, while if bars is selected than it is the number of points minus the number of bars minus 1.
Page 23 of 36
IDAT: User’s Manual
Plots with Multiple Levels
In the plot options two levels of detail can be selected. The first controls the values that will be plotted on
the x-axis; the second level controls the number of bars in the first level, each with a distinct colour. In the
example shown in Figure 20, the first level is the Device input (Object/material of which the reaction rate
is being counted), while the second level is showing the reaction, which in this case is either Capture (Red
bars) or Fission (Blue bars).
Figure 20: Example of a two level plot, where the first level is reaction and the second level is device.
Note: In the list, if multiple points have been collapsed, the user can retrieve the data behind a point by
double clicking.
Filters
Figure 21 shows an example in which the average C/E is displayed by Case ID, for all cases with SPEC
measurements. Specific data can be selected by applying combinations of the filters present on the left.
Page 24 of 36
IDAT: User’s Manual
Figure 21: Spectral Indices C/E Unfiltered
In Figure 22, the result has been filtered to only show spectral indices C/E in which the ENDF/B-VI.8
library has been used.
Figure 22: Spectral Indices C/E, filtered to only show cases computed with ENDF/B-VI.8
Note: If the user unchecks all boxes, no filter is applied, since otherwise the results would be no
evaluations.
Page 25 of 36
IDAT: User’s Manual
6. Uncertainty Plot Pane
Figure 23: δ CRIT tab, displaying the benchmark model uncertainty, averaged by reactor
The δ CRIT tab allows plotting and trends of the keff benchmark uncertainties. Uncertainties can be
displayed by type, such as ‘Composition’, ‘Geometry’, ‘Measurement’... or by regions such as, ‘Fuel’,
‘Coolant/Moderator/Reflector’, ‘Core’... See Figure 24.
Figure 24: Plotting keff uncertainty data grouped by ‘Type’
Note: When plotting ‘TOTAL’ the total is the components summed in quadrature.
Page 26 of 36
IDAT: User’s Manual
7. Troubleshooting
7.1. Startup problems
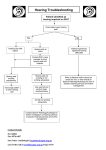
IDAT cannot start if it cannot connect to any database. If this occurs, you will obtain the following dialog:
Figure 25 No connection dialog
If you are trying to connect to the NEA master database, first check if the NEA website is currently
accessible (try both http://www.oecd-nea.org and https://www.oecd-nea.org, IDAT use HTTPS). If you
need to connect through an HTTP/HTTPS proxy, click on the “Setup HTTP proxy...” button to open the
Settings dialog. Restart IDAT for the settings to take effect.
If you are trying to connect to a local database, check that the data files exist on the media (DVD or
computer) and that you have read access.
If you still cannot connect to either master database, please send an email message containing the error
messages to [email protected]. You can copy these messages to the clipboard by using the “Copy
messages” button.
7.1.1. Windows
To track down start up problems on Windows, follow these instructions:
1.
Determine if you have a suitable Java environment.
2.
Open a command window (Start menu > Run…) then type cmd.
3.
In the Command Prompt window, issue the java –version command.
4.
If you see the following message, your computer does not have Java properly installed:
C:\>java -version
'java' is not recognized as an internal or external command,
operable program or batch file.
Page 27 of 36
IDAT: User’s Manual
If this is the case, check that the PATH environment variable is correctly set.
Microsystems
offers
a
web
page
to
verify
your
Java
www.java.com/en/download/installed.jsp.
Alternatively, Sun
installation
at
You can download Java from www.java.com (You should use a JRE 1.6 version at a minimum). Once this
is done, go to the IDAT\software folder and type the following command:
java –jar IDAT.jar
IDAT should now open. If not, to request further help, if there are error messages in the console, rightclick in the title bar, choose menu “Select all”, then “Copy”, and send the text in the clipboard to the IDAT
developers ([email protected]) for assistance.
7.1.2. Linux/UNIX
To troubleshoot problems on Linux, follow the below instructions:
First, make sure your Java installation is correct with the following command:
java –version
You may need to put the full path to your Java executable in the idat.sh script and make sure that it has
execution rights.
If you experience problems with OpenJDK Java, especially graphical interface problems, please install
Oracle Java. See support of your Linux distribution and www.java.com.
7.2. Speed problems
The following tips will improve execution speed:
•
Copy the DVD onto your hard drive instead of running from the DVD drive
•
Connect to the NEA remote database
•
Narrow the search to a few evaluations before pressing the “Search !” button
•
Display only relevant columns in result views.
7.3. Memory problems
Java programs will limit themselves to use a maximum amount of memory, this maximum depends on
your system and Java version. IDAT start files (idat.bat and idat.sh) are provided with an option to specify
a fixed amount: 768MB:
-Xmx768m
This option -Xmx768m specifies that IDAT will take at most 768Mbytes of memory. If you have more
physical memory, you can edit this command line and replace the option -Xmx1024m or -Xmx1g. For
example to allow IDAT to use at most 1024MB of memory the idat.bat file should be:
javaw -Xmx1024m -jar IDAT.jar
Page 28 of 36
IDAT: User’s Manual
7.4. Java 3D installation
To have full capabilities with Meshtal Viewer you need:
a 3D capable video card,
Java 3D libraries installed in your Java Runtime Environment.
If you use the online version of IDAT the Java 3D libraries will be automatically downloaded from the
NEA website. If you have a permanent internet connection prefer this version as Java 3D will very likely
be supported without efforts.
If you use the DVD version you have to manually install the libraries provided in the folder
“IDAT/java3d”:
-
-
Select the right ZIP for your Java: for 32bit Java the file named “j3d-1_5_2-<OS>-i586.zip”, for
64bit Java the file named j3d-1_5_2-<OS>-amd64.zip. On 64bit system note that it is the version
of your Java Runtime Environment which matters, not the version of your OS, e.g. if you have
installed a Java 32bit on a Windows 7 64bit then take the file “j3d-1_5_2-windows-i586.zip”
Unzip this file in a temporary location
Unzip the file “j3d-jre.zip”
The content of the extracted “bin” folder (a .dll file for Windows, a .so file for Linux) has to be
copied to the “bin” folder of your Java Runtime Environment
The content of the extracted “lib/ext” folder has to be copied to the lib/ext” folder of your Java
Runtime Environment
The location of your Java Runtime Environment depends on your system but common locations
are : “C:\Program Files\Java\jre1.8.0_45”, “C:\Program Files (x86)\Java\jre1.8.0_45”, in IDAT
you can see this location in the About dialog, scroll to see the “Java home :” line.
Note that to be able to install these files you will need administrative privileges on your computer. It is also
a good idea to seek assistance from IT people around you if needed.
Note also that this installation will have to be redone after each update of the Java Runtime Environment.
Contact [email protected] if you need assistance, please indicates which operating system and version
you use, and the version of Java you have installed. The best way to collect these information’s is to use
the “Copy messages” button of the IDAT About dialog.
Page 29 of 36
IDAT: User’s Manual
8. Conclusion
IDAT has been created to facilitate search and analysis of the International Handbook of Reactor Physics
Experiments. Previous NEA efforts on DICE have been utilised during the development of IDAT. The
currently allows users to search and trend CRIT, BUCK, SPEC, REAC, COEF, KIN, RATE and POWDIS
measurements, which represent most of the data contained IRPhEP.
IDAT development has been made possible thanks to the voluntary contribution of the government of
Japan.
Please send any comments, requests and bugs to [email protected] which is an alias for each of the
following individuals:
Ian Hill ([email protected])
Nicolas Soppera ([email protected])
Manuel Bossant ([email protected])
The IDAT team would appreciate any feedback if this manual has been useful and any ways in which it
could be improved.
Page 30 of 36
IDAT: User’s Manual
9. References
[1] “International Reactor Physics Benchmark Experiments (IRPhE) Project”, NEA/NSC/DOC(2006),
OECD-NEA, March 2011.
[2] “INTERNATIONAL HANDBOOK OF EVALUATED CRITICALITY SAFETY BENCHMARK
EXPERIMENTS,” NEA/NSC/DOC(95)03/I-VIII, OECD-NEA, September, 2011
[3] Y. Rugama, N. Soppera, M. Bossant and B. Briggs, “DICE: Database for the International Criticality
Safety Benchmark Evaluation Program Handbook” Proceedings of the Eighth International Conference on
Nuclear Criticality Safety, ICNC 2007, Vol II pages 246 - 248, June 2007
[4] P.J. Fleming, J.J. Wallace, “HOW NOT TO LIE WITH STATISTICS: THE CORRECT WAY TO
SUMMARIZE BENCHMARK RESULTS”, Communications of the ACM, Volume 29, Number 3, March
1986.
[5] E. A.E. Habib, “Geometric Mean for Negative and Zero Values”, IJRRAS, Volume 11, Number 3, June
2012.
[6] I. Hill, N. Soppera, M. Bossant, “IDAT : The International Handbook of Evaluated Reactor Physics
Benchmark Experiments Database and Analysis Tool”, Nucl. Sci. Eng., 178, 280 (2014);
http://dx.doi.org/10.13182/NSE14-37
Page 31 of 36
IDAT: User’s Manual
Appendix A: Glossary
EvalId: (Reactor Name)-(Reactor Type)-(Facility Type)-(Three Digit Numerical Identifier)
CaseId: Identifier that corresponds to the number of different reactor configurations present in the
evaluation. Excluded are core perturbations made solely for reactivity coefficient calculations. TYPE:
Three digit number.
The criteria for a case in IDAT are as follows:
Each Section 3.1 CRIT experimental benchmark keff is a case.
Other measurements can be considered cases, however many BUCK, SPEC, REAC, COEF, KIN,
RRATE measurements are not defined as cases because they are based on a documented critical
configuration. In these instances, the case has both a CRIT measurement and a BUCK, SPEC,
REAC, COEF, KIN, RRATE measurement.
Some evaluations without criticality measurements include:
BFS1-FUND-EXP-002
BFS1-FUND-EXP-003
BFS2-FUND-EXP-001
CROCUS-LWR-RESR-001
TCA-LWR-EXP-001
VENUS-PWR-EXP-005
ZEBRA-LMFR-EXP-003
ZPPR-SPACE-EXP-003
ZPPR-SPACE-EXP-004
REAC/COEF/KIN measurements, are not cases unless they clearly two measurements in which
neither has been previously defined as a case. For example, if a REAC measurement such as
control rod worth is performed then there will not be a new case, unless the reference state is not a
CRIT measurement. In this way many measurements can be represented by a single case.
If a critical measurement and a perturbation is done, followed by a BUCK, SPEC or RRATE
measurement, the core state is considered a new case. For example, a critical case, followed by a
change in boron concentration with a reaction rate measurement, then the reaction rate
measurement will be considered a new case.
Measurements: The measurements performed for each case. A check box indicates an acceptable
measurement, a blank box denotes an unaccepted measurement and no box is present if a measurement was
not done. Each of the measurements includes a measured value and uncertainty taken from section 3.x, and
corresponding calculated values taken from section 4.x, where x depends on the measurement.
CRIT - Criticality Measurements
EvalId
CaseId
Keff Benchmark Value
Keff Benchmark Value Uncertainty
Keff Calculation
Keff Calculation Uncertainty
Code
Library
Page 32 of 36
IDAT: User’s Manual
Note: If an IRPhEP evaluation contains a link to an ICSBEP evaluation in Section 3.1 and Section 4.1, then
the keff calculation is entered into IDAT.
δ CRIT - Criticality Uncertainty
EvalId
CaseId
TypeSet
RegionSet
Description
+ Sigma Keff
- Sigma Keff
BUCK - Buckling Measurements
EvalId
CaseId
Buckling Dimension
Buckling Benchmark Value
Buckling Benchmark Value Uncertainty
Calculated Value
Calculated Uncertainty
Code
Library
Buckling Dimension: Describes the direction of the buckling measurement in inverse meters squared, three
types of buckling can be stored:
Axial
Radial
Total
SPEC - Spectral Index Measurements
EvalId
CaseId
Device
Reaction Numerator
Reaction Denominator
PosX, PosY, PosZ
Energy
EnergyUncertainty
Spectral Index Value
Spectral Index Value Uncertainty
Calculated Value
Calculated Uncertainty
Code
Library
Page 33 of 36
IDAT: User’s Manual
Device: Physical device used to measure the spectral index. Current choices include:
Beta Scan
Fission Chamber
Ge-Li Detector
NaI detector
Proportional Counter
Solid State Track Recorder
TOF (Time of Flight)
Reaction Numerator: The isotope and reaction in the numerator of the spectral index. Note, for spectra
measurements that do not measure a ratio, the numerator keyword contains the isotope. Examples are:
Pu239-Fission
U235-Capture
U238-Epithermal Capture
Reaction Denominator: The isotope and reaction of the denominator of a spectral index measurement.
Pu239-Fission
U235-Capture
U238-Epithermal Capture
Position X/Y/Z: Position in cm. Origin is currently arbitrary, but an attempt has been made to choose the
origin presented in the benchmark model when present.
Energy (keV): Upper energy of a spectrum measurement. This field is set to zero in the case of a spectral
index over the entire energy range.
Energy Uncertainty: Uncertainty in the energy measured.
REAC - Reactivity Effect Measurements
EvalId
CaseId
MeasurementID
Reactivity Effect
Position Description
Material
Method
Unit
COEF - Reactivity Coefficient Measurements
EvalId
CaseId
MeasurementID
Coefficient Type
Parameter Range Low
Parameter Range High
Parameter Unit
Measurement Method
Page 34 of 36
IDAT: User’s Manual
KIN - Kinetics Parameter Measurements
EvalId
CaseId
Parameter
RRATE - Reaction Rate Measurements
EvalId
CaseId
Device
DeviceSpecification
DeviceInput
Reaction
Position X,Y,Z
Energy
Energy Uncertainty
Device: What type of device is used to measure the spectral index. Choices include:
Fission Chamber
NaI detector
Ge-Li Detector
Proportional Counter,
Solid State Track Recorder
TOF (Time of Flight)
Proton Recoil
Device Specification: The gamma ray being scanned. No such detail exists for fission chambers, currently
considering adding more detail to the fission chamber description.
Device Input: Material of which the reaction rate is being counted; typically the foil or fission chamber
material.
Reaction: The reaction being scanned; currently fission or capture.
Position X/Y/Z: Position in cm. Origin is currently arbitrary, but an attempt has been made to either choose
the centre or bottom of the model.
POWDIS - Power Distribution Measurements
Same as Reaction Rate measurements; see above.
CALCULATED FILES
INPUTS: Input file for a particular code.
BALANCE: Neutron balance file
MESH TALLIES: Mesh tally file
Page 35 of 36
IDAT: User’s Manual
OTHER ITEMS
Additional parameters have been entered into the database. These parameters are considered to be self
explanatory.
Evaluator
Internal Reviewer
Independent Reviewer
Organisation/Laboratory
Title of Evaluation
Keywords
Year Evaluation was Approved
Years Experiment Performed
References
Case Label
Materials
Fuel: A list of fuel materials used in the evaluations.
Fuel Composition: A list of materials, where the material compositions are extracted from section 3.x.3 of
the evaluation.
Cladding: A list of cladding materials in the evaluations.
Moderator/Coolant: A list of moderator and coolants used in evaluations
Absorber: A list of absorber elements used in evaluations
Page 36 of 36