1
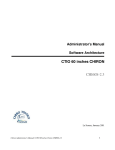
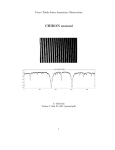
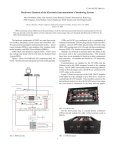
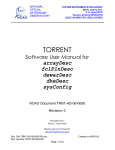
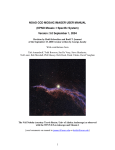
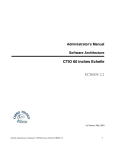
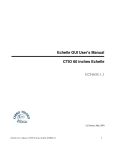
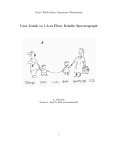
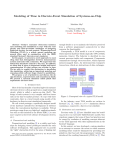
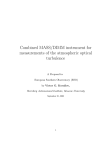
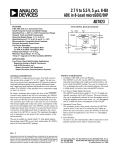
Orange controller for fiber echelle: final report
A. Tokovinin, R. Schmidt, M. Bonati
Version 1.1. January 9, 2010
file: prj/bme/doc/orange report.tex
This document presents the final report on the ACTR project #454. The goal of the project
was to upgrade the controller and data-taking software of FECH from Arcon+IRAF to
Monsoon+Arcview by the end of CY 2009.
Figure 1: Installation of the new controller on December 30, 2009: R. Alravez, O. Saá, R. Schmidt,
M. Hernandez, M. Bonati, D. Rojas.
1
1
Sequence of events and actions (Feb. 2009 to Jan. 2010)
February 6: Proposal to ACTR to upgrade the controller and computer of fiber echelle. Remaining
funds from the “Design study” sub-award would serve for purchasing the hardware.
March 17: The ACTR decides to do the controller upgrade and to use Monsoon Orange, rather
than Leach. See [1] for the definition of the ACTR project #454 presented by A. Tokovinin (AT).
May 1: R. Schmidt (RS) sends technical information to M. Hunten (MH), the controller fabrication begins.
June 22-26: A decision to attach the controller to the CCD is taken, suggested by MH and
approved by RS and AT.
August 9: Tim Abbott develops detailed project schedule.
August 17: Monsoon Orange is delivered to La Serena. The delay is 1 month w.r.t. original plan.
August-October: A. Cisternas designs a mechanical system to suspend the controller below the
dewar. Its fabrication takes some time and is finished first week of October.
November 9-11: AT strongly objects to suspending controller from the CCD dewar. RS agrees
that having short cables is easier and safer, but may increase noise. It is decided to make cables.
Meanwhile, the data-taking software developed by M. Bonati (MB) is nearly ready, connection to the
TCS is tested. See [2] for the project status at this stage.
November 9-17: Discussion of the forthcoming 1-month echelle shutdown. SMARTS has not
been informed timely (in March), the schedules are made, and the shutdown impacts some programs.
It is finally decided to go ahead with the shutdown.
December 1: Echelle shutdown starts. The dewar is removed and sent to La Serena (cold, in
carry-all). During the following two days, the CCD was tested by RS and MB with Arcon, to get
reference performance. Then the temperature control was tuned by MB on Dec. 4.
December: MB and Xavier Rojas (XR) install the ADAM module in the electronic box which
controls the comparison lamps and prism motion and check the functionality. New Ethernet line is
installed at the telescope to connect ADAM with external world.
December 10: First images with the new controller are acquired. They are still noisy.
December 18: Brain-storm meeting between RS,MB,EM,MW,RA,PM to solve the noise problem.
December 21: The noise is brought down to 7.5ADU (6.3el). This is about 10 µV, or ∼ 2 times
better than noise at the KPNO Orange system. The noise reduction was achieved by removing the
relay in the power supply (the analogue voltages are proviosnally switched manually).
December 29: The relay (this time driven by 110VAC) is installed again by RA in Power Supply
box, the noise is not affected. AT takes test images with the new system.
December 30: The dewar and controller are installed at echelle and tested. The molecular sieve
in the dewar was replaced.
January 2: MB installs the RS-232 cable to the Lakeshore temp. controller and makes a list of
SW modifications after talking to the observer, D. Fischer (DF). AT adjusts the dewar position angle
and focus by taking comparison spectra.
January 4: First (technical) echelle night with the new controller and data-taking software.
Observers J. Velasquez (SMARTS), DF, J. Brewer, AT. MB works night and day to adapt the software
and to fix remaining bugs.
January 5-6: First regular observing nights with the echelle.
2
Coude room
systran fiber
Linux PC
Ethernet
Dewar
RS−232
Rack behind
control room
shutter
Monsoon Orange
Telescope
ADAM
+5V
Power−supply
Lakeshore
box
Figure 2: Elements of the new controller system and their connections.
2
System description
The new controller consists of several inter-connected modules (Fig. 2).
CCD: SITE SI424A 2K x 2K CCD with 24 µm pixels. This CCD has 4 output amplifiers. The
two “upper” were used by Arcon.
Dewar: One of CTIO’s golden MK II dewars. It uses LN2 for cooling and has a hold time of
about 14 hours. Two 41-pin connectors (with exactly the same pinout as used by Arcon) are used for
CCD signals, temperature sensing and to drive the heater.
New controller: Orange Monsoon. This uses a 4 slot Monsoon in a hermetic housing. The
controller has three boards (Master Controller board, Clock board and an 8-channel Acquisition
board). It also uses two transition boards: one for the Clock and one for the Acquisition board. The
power supply is in a separate (gray) box. Orange Monsoon has two additional connectors: one for the
shutter control output and another for the data fibers. See Fig. 3 for a concept drawing (there are a
few differences with respect to our unit). The controller is connected to the dewar with two cables of
25-cm length (plus 60-mm connectors on both ends). The cost of the controller and other components
is given in Table 3 in [1].
Power supply box: it contains several Acopian linear power supplies that generate 5V digital,
±5V analog, ±15V analog, and 32V. This unit had to be modified (K1 was replaced by a relay) to
keep the noise down. See Fig. 4 for a view of this box.
3
Figure 3: Monsoon Orange conceptual drawing. Box size 435x390x108 mm, mass 9.9 kg.
Temperature controller: Lakeshore model 325 temperature controller is used for the CCD
temperature stabilization. The signals for temperature sensing and heater control go from the 41-pin
hermetic connectors through the Orange Monsoon to a couple of Lemo connectors. Additional power
supply +5V is also needed to drive the heater.
Comparison-lamp control is now automated by installing the ADAM 6050 module in the electronics box at the telescope. The module is connected to the PC via Ethernet (Ethernet cable to the
telescope was added).
Linux PC computer is installed in the back of the console room. It is connected to other
elements by a dedicated optical fiber, RS-232 serial line and Ethernet (Fig. 2). The observer connects
to this PC via VNC from any terminal in the console room.
3
3.1
Performance of the detector with the new controller
Waveforms and modes
The waveforms of Monsoon Orange are designed to approximate those of Arcon used with the same
CCD, at faster readout speed. Three files (SI424A.ucd, SI424A normal.mod and SI424A fast.mod)
are used two generate the waveforms and the bias voltages for the CCD. The original idea is to keep
reading the CCD through the two upper amplifiers. Presently there are two readout modes with
different gains, speeds and noise. It is possible to select a region-of-interest (ROI) or bin the signal in
the line and/or column directions.
An attempt to increase the pixel time further for reducing the readout noise and approaching the
performance of Arcon in this respect was not successful. The gain and offset with a longer pixel time
could be adjusted only by hardware changes, and there was not enough time to implement and test
4
Figure 4: Power supply box.
Table 1: Readout modes and parameters
Parameter
Pixel time, µs
Dwell time, µs
Readout time, s
Gain e-/ADU
RON, ADU
RON, e-
Fast mode
OUT1 OUT2
5.2
0.8
18
3.3
3.0
2.8
3.3
9.2
9.9
Normal mode
OUT1 OUT2
8.9
2.65
27
0.91
0.81
8.0
8.2
7.3
6.6
those changes.
3.2
Noise and readout speed
Table 1 lists the pixel time and the full-chip readout time (without binning) in the two available
modes, for each of the two amplifiers (OUT1 is upper-left, OUT2 is upper-right). The readout noise
was measured in the overscan region by RS. The gains were measured independently by MB and RS,
their results differ by few percent. Note that the higher gain of the upper-left amplifier is the CCD
feature which was known with Arcon and is independent of the controller.
5
Figure 5: Power spectrum of the CCD line signal in the fast (left) and normal (right) readout modes
obtained on Dec 29, 2009 in the lab.
Figure 6: Power spectrum of the CCD line signal in the fast (left) and normal (right) readout modes
obtained on Dec 30, 2009 at the telescope.
3.3
Pick-up noise
The presence of periodic noise was checked by looking at the power spectrum of the signal along
the CCD lines. The IDL program noise1.pro reads the bias image, removes few strongly outlying
pixels. Average line signal is subtracted from each CCD line, the result is Fourier-transformed, and the
average power spectrum of all lines is accumulated. The spectra show an almost uniform component
(white noise) and several lines (Figs. 5,6). The overall variance (RON) is dominated by the white
noise, the lines give only a small contribution (e.g. about 1 ADU in the normal mode).
The frequencies of the two strongest lines, 28.8 kHz and 63.7 kHz, are the same in the laboratory
and on the telescope. This means that these signal components are produced by the system itself,
possibly in the power supplies. In the normal mode, the Nyquist frequency is 56.2 kHz, therefore the
6
Figure 7: Illustration of the CTE evaluation.
line at 63.7 kHz is aliased to 48.7 kHz. The frequency of these periodic noise components does not
depend on the readout speed.
3.4
Charge transfer efficiency
Figure 7 shows a plot of the single cosmic-ray event. No trace of the signal in adjacent pixels is seen,
so the CTE is excellent.
4
Data-taking software and documentation
The software for taking images and controlling the comparison lamps is written by MB. It is a substantially modified version of the SOI ArcView software. The GUI is written in LabView (Fig. 8).
The software and instrument control are extensively documented by MB in the following:
• ECH60S-1.X. GUI User Manual.
• ECH60S-2.X: Administrator’s Manual / Software architecture. General system architecture and
maintenance: software tree, configuration files, etc.
• ECH60S-3.X: Scripting reference. Reference for scripting: commands available, responses, examples, etc
• ECH60HF-4.X: CCD temperature control. Temperature controller tuning.
7
Figure 8: Screen-shot of the first GUI version.
8
Figure 9: Left: design of the Monsoon Orange mechanical coupling to the dewar (implemented, but
not used). Right: provisional installation of the Monsoon Orange on Dec 30, 2009.
• ECH60HF-5.X: comparison lamps automation. Comparison lamps schematic / hardware changes.
• ECH60HF-6.X: Panview configuration. Hardware files / drivers descriptions.
5
Mechanical details
The Arcon controller was rigidly attached to the dewar. Originally, it was planned to do the same with
Monsoon Orange (Fig. 9, left). However, the Orange is heavier (9.9 kg compared to 6 kg for Arcon)
and bigger. It is a source of mechanical and thermal perturbations which are disruptive for highprecision radial-velocity work done with the echelle. Connecting the controller with cables removes
the mechanical coupling. It is also easier to implement and less risky for the dewar connector pins.
Figure 9 (right) shows a picture of the provisional controller installation where it is strapped to
a wooden box of suitable height. In the definitive installation, the controller will be in the “vertical”
position (as planned initially), but displaced below and sideways w.r.t. the dewar connectors. The
controller box will be rigidly attached to the white tubular frame holding the spectrograph and will
be electrically isolated from it.
6
Conclusion: lessons learned
The controller upgrade has significantly improved the echelle operation. Now time and labor losses for
changes between echelle and RCspec are eliminated, calibrations can be taken during daytime without
dependence on the RCspec. Data storage and transfer are improved. More importantly, though, the
readout time is now much shorter (27s, compared to 105s with Arcon in normal mode), effectively
9
increasing the number of photons collected by the telescope. The bigger readout noise is the only
negative (and foreseen) consequence of the upgrade.
Monsoon Orange is not a “plug-and-play” device. The controller was delivered with sufficient
technical documentation. The results of Monsoon tests were supplied as well, but since it was not
tested with an actual CCD, some noise problems were not detected. In future controller upgrades, it
will be important to perform and report tests of the hardware prior to its delivery.
A certain number of problems was found and solved as part of the normal learning/debugging
process with a new system. One pending issue is reaching reliable communication through Systran
board and leaving the system work in this definitive configuration. This also implies changing the PC
computer.
The new controllers should provide the same functionality as the existing Arcons (see Torrrent
requirements in [3]). This is not the case for Monsoon Orange. We were not able to reproduce the
slow Arcon-like readout mode (and to reduce the RON) because with the long pixel time the gain
became unacceptably small and the large signal offset was beyond the compensation range. Currently,
the “normal” mode is much faster than the Arcon’s slow mode.
RS repeatedly pointed out that this system has no spares. Some spares may become available only
after the prototype DECam system is de-commissioned, but there are many caveats (e.g., the boards
from DECam system first need to go through a rather time consuming modification, calibration and
test procedure before they are ready as spares). Any failure will disrupt echelle observations and will
to be addressed by bringing the dewar to La Serena. The hope is that the controller will not fail
during one year of planned operation, until the new echelle spectrometer is commissioned.
References
[1] Orange controller for fiber echelle. March 30, 2009 (DocDB 192-v2)
[2] ACTR project #454: Orange Monsoon for 1.5-m. Nov. 30, 2009 (DocDB 235-v1).
[3] Torrent development status. M.Hunten et al. March 18, 2009 (DocDB 198-v1)
10