1
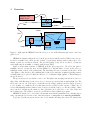
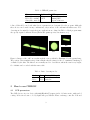
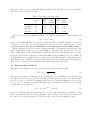
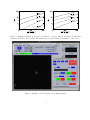
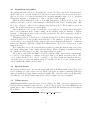
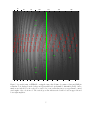
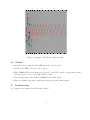
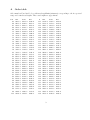
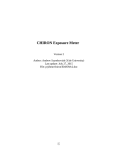
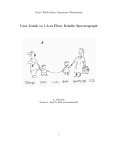
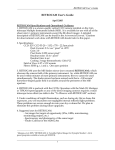
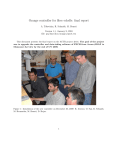
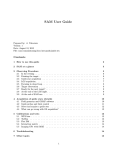
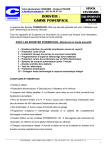
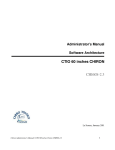
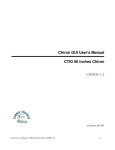
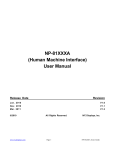
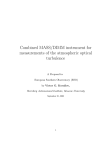
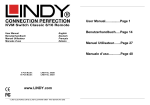
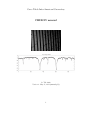
Cerro Tololo Inter-American Observatory
CHIRON manual
A. Tokovinin
Version 2. May 25, 2011 (manual.pdf)
1
1
Overview
Fiber
Calibration lamps
Quartz, Th−Ar
Prism
Fiber
FEM
Starlight
Guider
GAM mirror
On the telescope
In the coude room
Viewer
Fiber
CCD
Focus
Image slicer
Shutter
Iodine cell
Spectrograph
Figure 1: Light path in CHIRON, from the telescope to the CCD. Elements under user control are
pink-colored.
CHIRON is a high-resolution fiber-fed echelle spectrometer installed at the CTIO 1.5-m telescope.
It can record multi-order echelle spectra of single objects (stars) with spectral resolution up to R =
80 000, 3 pixels per resolution element. The spectral format on the detector is fixed, covering the
wavelength range from 4200Å to 8800Å without gaps [TBC].
Figure 1 shows main elements of CHIRON from the user perspective. We follow the path of
starlight, directed towards the fiber module (FEM) by a diagonal mirror located in the telescope
GAM (at certain position of the pickup arm). The star image is focused on a mirror with a hole; most
of the light goes into the fiber, the remaining halo is reflected towards the acquisition/guiding camera.
A small prism can be placed behind the mirror to feed calibration light (quartz or Th-Ar lamps) to
the spectrometer.
The spectrometer is located in the coude room. The light beam emerging from the fiber can be reshaped into a slit-like image by the image slicer, to increase spectral resolution without light loss. The
slicer can be moved out of the way to work with bare fiber image (with spectral resolution decreased
to R ≈ 30 000) or to mask the fiber by slits (increase the resolution at the expense of light loss). A
viewer with manually-activated mirror is used only for troubleshooting, to see the sliced image. Other
user-controlled elements are the shutter, iodine cell which can be placed in or out of the beam, and
the focusing stage. The CCD is operated by a GUI-driven data-acquisition program.
CHIRON is designed to be very stable, its internal environment is maintained at constant temperature. Opening the spectrometer, any other intervention or manipulation are strictly prohibited.
To specify observations, astronomer needs to decide whether the image slicer is needed, whether the
2
Table 1: CHIRON parameters
Slicer
Slicer (R = 80 000)
Fiber (R = 30 000)
Slits (wide, narrow)
Iodine cell
IN
OUT
CCD
Normal/Fast readout
Binning HxV
Region-of-interest
iodine cell should be used, and what detector parameters are best suited for the program. Although
these choices can be made in any combinations, only a subset of all combinations makes sense. Two
observing modes suitable for typical science applications are defined in Table 2. Each program must
also specify required calibration data (Th-Ar and quartz spectra, bias frames, etc.).
Slits
Fiber
Slicer
Figure 2: Images of the “slit” as seen through the viewer, with fiber illuminated by the quartz lamp.
The position of the translation stage defines whether the fiber image is “sliced”, transmitted unchanged
or masked by the slits. The slits are not normally used for observations, unless the star is very bright;
R = 120 000 can be reached with the narrow slit.
Table 2: Basic observing modes
Mode
Normal
Fiber
2
2.1
Slicer
Slicer
Fiber
Binning HxV, speed
3x1, fast
4x4, slow
How to use CHIRON
CCD parameters
The CCD detector is a e2v device with 4096(H)x4112(V) square pixels of 15-micron size, with graded
coating. It lives in a dewar cooled by liquid nitrogen, with the Monsoon-Orange controller. Left and
3
right parts of the detector are read with different amplifiers. The gain and readout noise in fast and
slow readout modes are listed in Table 3.
Table 3: Readout modes of the CCD
Mode
Normal 1x1
Normal 2x2
Fast 1x1
Fast 2x2
Readout
time
s
37
14
22
10
Upper-left
RON,
Gain
el
el/ADU
4.5
2.39
4.3
2.23
9.6
2.59
7.5
2.53
Upper-right
RON
Gain
el
el/ADU
4.2
2.05
4.1
1.92
7.4
2.19
6.1
2.10
The detector response is slightly non-linear. A formula to linearize the measured signal S (in
ADU)
Scorr = S (1 − kS)
(1)
leads to the resulting linearity of about 1% at signal level up to 104 ADU, using the non-linearity
coefficients k of [4.5, 4.0] × 10−6 in the normal mode and [5.0, 4.3] × 10−6 in the fast mode for the
[left,right] amplifiers. It is not recommended to exceed the signal level of 10 000 counts.
Echelle dispersion is directed along the columns (vertically), cross-dispersion along the lines. The
charge transfer efficiency is very good, about 0.999986 per pixel in the line direction and even better
in the column direction. The CCD has minor cosmetic defects. In the left amplifier, there is a charge
trap at X=566,567 and Y=3414 (pixel count in the trimmed image), making for two bad columns. In
the right half, the most prominent defect is a charge trap at X=2305,2306 and Y=2460 which leaves a
dark tail in those two columns below the trap. The tail extends for about 1000 pixels, then disappears.
There are two localized detector blemishes at X,Y=(2347, 2526) and (2399, 2516).
2.2
Exposure-time calculator
Calculation of the sigmal-to-noise ratio per pixel is based on the following formula:
q
S/N = Nph / Nph + KR2
(2)
where Nph is the number of stellar photons per spectral pixel collected during the exposure time, R is
the CCD readout noise in electrons, K is the number of binned pixels across the order. In the normal
mode R = 8, K = 9, pixel size is 0.0202Å. In the fiber mode with 4x4 binning and slow readout,
R = 4.3, K = 2.5 and the spectral pixel is 4 times larger. The number of photons received during
exposure time t is calculated as
Nph = F0 ǫ t 10−0.4V
[el/pixel]
(3)
where F0 = 3.4E5 photons/s/pixel is the flux of V = 0m star outside atmosphere per 0.0202Å, ǫ = 0.04
is the total system efficiency, V is source magnitude. These parameters are valid around 500 nm near
the center of order in the normal mode. The plots in Fig. 3 were produced using these data.
4
Figure 3: Estimated signal-to-noise ratio at 500 nm vs. exposure time in normal mode with slicer
(left) and in the fiber mode (right). The numbers near curves indicate V -magnitude of the source.
Figure 4: Snapshot of the PCguider screen during guiding.
5
2.3
Acquisition and guiding
The guiding camera is connected to the guiding PC, ctioxb. Use VNC connection to 139.229.12.62:1.
In the VNC screen, open the PCguider program from a menu activated by the left mouse button
(Fig. 4). In order to see better the star images, use automatic intensity scaling. To do so, use menu
in PCguider: Options → Parameters → olut = off (the default is sigma).
When the field is illuminated by sky or dome light, dark images of the two holes are seen. The
guiding box should be centered on the small hole, normally at X=289, Y=255. You may want to shift
the box by ±1 pixel to achieve better centering of the star in the hole. The normal box size is 29
pixels. The North-South direction coincides with Y.
After pointing the telescope, the object should be seen on the screen. Adjust camera integration
time to avoid saturation (max. counts < 4096). In the PCguider menu, use Windows → Camera
Control → Integration Time, set the new value, press Enter. The effect is immediate. In Fig. 4,
the integration time is 100 ms.
Using hand paddle, move the telescope to bring the star into the box. Most of the image disappears
in the hole, and we see a ring (donut), as shown in Fig. 4. The guiding loop can now be closed. To
view the image better, adjust the display using its control panel (display menu: Options → Control
panel). It is helpful to adjust the contrast and brightness and to use zoom for a larger view of star
image in the hole.
For focusing the telescope, move the star away from the hole, make sure that the image is not saturated in the camera (max. count < 4096) and in the display. With bad settings of brightness/contrast,
the central part of the image looks “flat”, with right settings it is peaked.
The position of the guider arm must be checked because the GAM control software systematically
goes wrong, so the displayed coordinates of the guide arm do not match its actual position. The
correct position should be X = −268, Y = +259, Z = −41. Put a bright star away from the hole,
defocus the telescope, and verify that the image is donut-like, not cut on one side. If this is not the
case, re-initialize the GAM control program.
2.4
Spectral format
The spectral formal is fixed. It covers the wavelength range from 410 nm (start of the bluest order
137) to 874 hm (end of the reddest order 65). Figure 5 shows the spectrum of a F0II star (Canopus)
with order numbers and approximate central wavelengths. The order table is listed in the Appendix.
Note that the order 109 (517 nm) is right at the center, it is split between two amplifiers.
2.5
Taking spectra
CHIRON and its CCD are controlled by the ctioe1 computer. Use VNC connection to 139.229.12.29:9.
Read the GUI user manual1 to find out how to operate it. The program controls all CHIRON motors
(prism, slicer, iodine cell and focus), calibration lamps, and CCD. The nominal (best) focus setting is
10.24 [TBC].
1
http://www.ctio.noao.edu/˜atokovin/echelle/CHI60S-1.2 chiron User Manual.pdf
6
70
90
80
110
100
130
120
D1
4239
4207
4371
4405
4304
4146
4271
4439
4337
4510
4176
4547
4475
4621
4698
4660
4860
4903
5125
4819
5034
5079
5269
5319
5370
4584
4738
4989
4778
4946
5172
5474
5537
5582
5638
5935
5220
5421
5695
5753
5812
5873
6128
6197
6264
6633
8556
6480
6062
6407
6793
6876
6961
7048
5998
6335
6712
7137
7228
7322
7723
7517
7418
7831
8054 7941
8674 8542
8415
8291
7619
8171
D2
Hb
Hg
Ha
D1
D2
70
80
90
100
110
120
130
Figure 5: Spectral format of CHIRON covering the range 410–874 nm. Spectrum of Canopus (F0II) in
normal mode is displayed in the background (bias-subtracted and trimmed, 4096x4112 pixels). Order
numbers are indicated by the scales above and below, some stellar lines in green, approximate central
wavelengths of the orders in red. The vertical green line indicates the division between upper-left and
lower-right amplifers.
7
70
100
110
4207
4371
4337
4176
4304
4146
4271
4439
4239
4405
4547
120
4510
4698
4660
4475
4621
4819
4860
4903
5125
4584
4738
4989
4778
4946
5172
5079
5269
5319
5370
130
120
5034
5474
5220
5421
5695
5537
5582
5638
6712
5998
5753
6062
5812
6128
5873
6197
90
110
100
6335
6407
8556
6480
6264
7137
6793
6961
80
6633
7048
7418
7517
6876
7322
7723
7228
7619
8171
8291
8415
7831
8054 7941
8674 8542
90
80
5935
70
130
Figure 6: Spectrum of the Th-Ar comparison lamp.
2.6
Checklist
• Open the telescope and place the GAM arm at X=-268, Y=+259.
• Switch on the FEM electronics on the telescope.
• Enter CHIRON GUI, verify that it is connected to the CCD controller, temperature monitor
and TSC (green-colored boxes). Take ThAr spectrum.
• Check temperatures of the CCD and CHIRON. [Give right values]
• Enter the PCGuider program, verify that it acquires the guide-camera images.
2.7
Troubleshooting
To be written. Cite software troubleshooting by Marco.
8
A
Order table
Order numbers N are listed below, with wavelength limits (min,max) corresponding to the free spectral
range and central wavelengths. These wavelengths are approximate.
# N
65
66
67
68
69
70
71
72
73
74
75
76
77
78
79
80
81
82
83
84
85
86
87
88
89
90
91
92
93
94
95
96
97
98
99
100
Min
8607.5
8477.8
8352.2
8230.3
8111.9
7996.8
7885.0
7776.3
7670.5
7567.5
7467.3
7369.7
7274.6
7182.0
7091.6
7003.5
6917.6
6833.8
6751.9
6672.0
6594.0
6517.8
6443.3
6370.5
6299.3
6229.7
6161.6
6095.0
6029.8
5966.0
5903.6
5842.4
5782.5
5723.8
5666.3
5609.9
Cent
8673.9
8542.5
8415.0
8291.3
8171.1
8054.4
7940.9
7830.6
7723.4
7619.0
7517.4
7418.5
7322.2
7228.3
7136.8
7047.6
6960.6
6875.7
6792.8
6712.0
6633.0
6555.9
6480.5
6406.9
6334.9
6264.5
6195.7
6128.3
6062.4
5997.9
5934.8
5873.0
5812.4
5753.1
5695.0
5638.1
Max
8740.4
8607.2
8477.8
8352.2
8230.3
8111.9
7996.9
7885.0
7776.3
7670.5
7567.5
7467.3
7369.7
7274.6
7182.0
7091.6
7003.5
6917.6
6833.8
6751.9
6672.0
6594.0
6517.8
6443.3
6370.5
6299.3
6229.7
6161.6
6095.0
6029.8
5966.0
5903.6
5842.4
5782.5
5723.8
5666.3
N
101
102
103
104
105
106
107
108
109
110
111
112
113
114
115
116
117
118
119
120
121
122
123
124
125
126
127
128
129
130
131
132
133
134
135
136
Min
5554.6
5500.4
5447.3
5395.2
5344.0
5293.8
5244.6
5196.3
5148.8
5102.2
5056.5
5011.5
4967.4
4924.0
4881.3
4839.5
4798.3
4757.8
4718.0
4678.8
4640.3
4602.4
4565.2
4528.5
4492.4
4456.9
4421.9
4387.5
4353.7
4320.3
4287.4
4255.1
4223.2
4191.8
4160.9
4130.4
9
Cent
5582.2
5527.5
5473.8
5421.2
5369.6
5318.9
5269.2
5220.4
5172.5
5125.5
5079.3
5034.0
4989.4
4945.7
4902.7
4860.4
4818.9
4778.0
4737.9
4698.4
4659.6
4621.4
4583.8
4546.8
4510.5
4474.7
4439.4
4404.7
4370.6
4337.0
4303.9
4271.3
4239.1
4207.5
4176.3
4145.6
Max
5609.9
5554.6
5500.4
5447.3
5395.2
5344.0
5293.8
5244.6
5196.3
5148.8
5102.2
5056.5
5011.5
4967.4
4924.0
4881.4
4839.5
4798.3
4757.8
4718.0
4678.8
4640.3
4602.4
4565.2
4528.5
4492.4
4456.9
4421.9
4387.5
4353.7
4320.3
4287.4
4255.1
4223.2
4191.8
4160.9