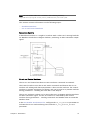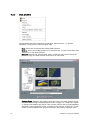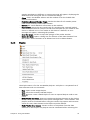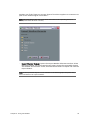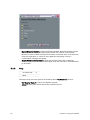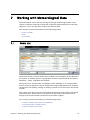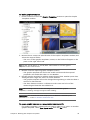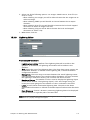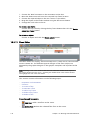
1
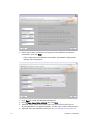
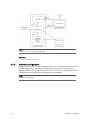
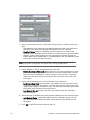
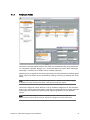
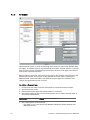
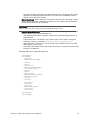
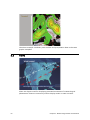
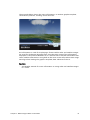
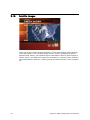
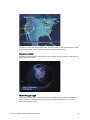
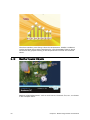
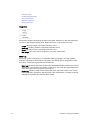
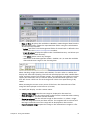
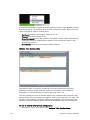
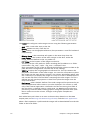
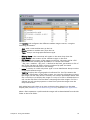
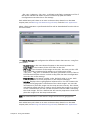
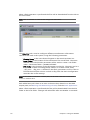
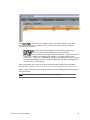
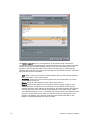
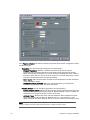
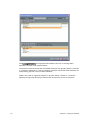
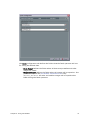
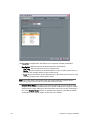
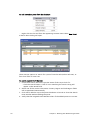
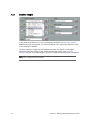
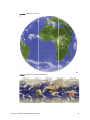
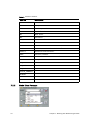
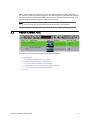
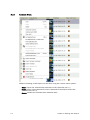
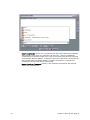
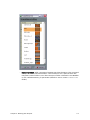
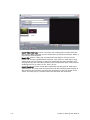
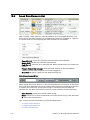
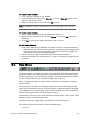
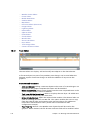
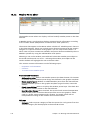
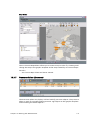
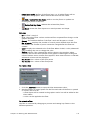
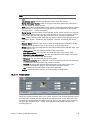
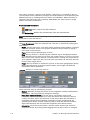
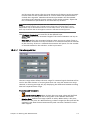
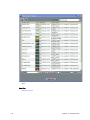
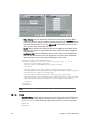
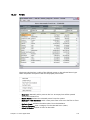
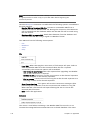
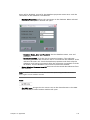
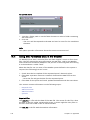
The above scene example displays the weather point’s name, temperature, wind
direction indicator and a weather vane for showing wind speed.
Points over a Globe
Display any point related information over a Globe, where the point is placed at its
geographical location.
Weekly Forecast Graph
The graph display type is similar to the points table display, with the addition of
using a graph to display data variation. The temperature values are used to
control the graph points.
Chapter 5: Meteorological Data Visualization
47