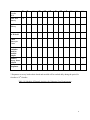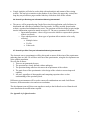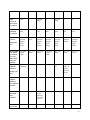
1
THE UNIVERSITY OF WEST INDIES FACULTY OF SCIENCE AND AGRICULTURE DEPARTMENT OF COMPUTING AND INFORMATION TECHNOLOGY COMP 6650 Web Usability Semester Project Report Project Title: User centered redesign of the website - www.tntschools.com Student(s) Name(s): Aneisha Le Platte Darrell Bartholomew Enisha Jack Student(s) ID No.: 05706299 807000342 806007271 Date: 02/12/2010 Advisor: Dr. Alexander Nikov 0 TABLE OF CONTENTS 1. Project Proposal 1.1 Organization that is the Focus of your Project Page 6 1.2 Your Relationship to the Organization 7 1.3 Very General Description of the Proposed Project 7 2. Plan for Collecting Requirements 2.1 Who are the Targeted Users for this Web Site? 10 2.2 How Will You Have Access To Users? 10 2.3 What Is The Overall Plan For Collecting User Requirements? 10 2.4 What Type Of Information Do You Need To Gather? 12 2.5 What Information Gathering Techniques Will You Use? 12 2.6 How Will You Develop Your Information Gathering Instruments? 13 2.7 How Will You Pilot-Test Your Information-Gathering Instruments? 13 3. Site Requirements/Preliminary Design Plan 3.1 What Methods Were Used to Collect Requirements? 14 3.2 Statistics 14 3.3 What was Learned About the Client Organization? 14 3.4 What was Learned About the Users Relating to Their Technological Environment? 15 3.5 What was Learned About the Users Relating to Their Technological Experience? 23 3.6 What was Learned About the Users Relating to Their Content Needs? 24 3.61 What was Learned About the Users Relating to any Benchmark Web Sites? 24 3.7 What was Learned About the Users Relating to any Demographic Information? 26 1 Page 3.8 What was Learned About the Users Relating to Their Domain Knowledge? 26 3.9 Were There any Unexpected Findings from the Requirements Gathering? 27 3.10 Preliminary Design Plan 27 4. Full Design Plan/Interface Prototype 4.1 What Content will be Included on the Web Site? 28 4.2 How will Navigation be Provided? 28 4.3 What Will the Page Layout Look Like? 29 4.4 Download Speed 29 4.5 What Colors will be Used? 30 4.6 Will there be any Graphics that Need to be Developed? 31 4.7 How did the Requirements Gathering Impact the Design of the Web Site? 31 5. Usability Testing 5.1 What Methods Will be Used to Collect Usability Data? 35 5.2 What are Expected Common Tasks of Users? 35 5.3 What Tasks will be Utilized in the Usability Testing? 35 5.4 Where Will the Usability Testing Take Place? 36 5.5 Usability Testing Participants 36 5.6 Expert Reviews 36 5.7 Specific Concerns 36 5.8 Results of the Usability Testing 37 5.9 Individual User Experiences 38 5.10 What was Learned from the Usability Testing? 44 2 Page 6. Implementation and Marketing 6.1 Who Will Manage the Web Site? 46 6.2 Where Will the Web Site Be Housed? 46 6.3 What Will the URL of the New Web Site Be? 46 6.4 On What Date will the Site Go Live? 46 6.5 Will the Web Site Manager Need any Training or Documentation? 46 6.6 How Often Will the Content on the Web Site Need to be Updated? 47 6.7 How Will the Web Site Be Marketed? 47 6.8 Site Evaluation 48 6.9 Future Suggestions 48 References 57 Appendix A Survey 59 Appendix B Screenshot of survey posted on www.tntschools.com 64 Summary of survey responses from Google Docs 65 Appendix C Sample of Usability Task Lists and Satisfaction Questionnaire: Developer‟s Copy 69 3 TABLE OF FIGURES Figure 1.0 Current website for tntschools.com Page 9 Figure 2.0 Operating System 16 Figure 3.1 Web browsing statistics 17 Figure 3.2 Internet Explorer version statistics 17 Figure 4.0 Screen resolution statistics 18 Figure 5.0 Flash versions statistics 19 Figure 6.0 Java support statistics 19 Figure 7.0 ISP statistics 20 Figure 8.0 Browser statistics – Survey 21 Figure 9.0 Browser version statistics – Survey 21 Figure 10.0 Screen resolution statistics – Survey 22 Figure 11.0 Browser plug in statistics – Survey 19 Figure 12.1 ISP – Survey 22 Figure 12.2 Internet Connection speed statistics – Survey 22 Figure 13.0 Computing experience statistics – Survey 24 Figure 14.0 Web browsing statistics – Survey 24 Figure 15.0 Website rating statistics – Survey 25 Figure 16.0 User Group age statistics – Survey 27 Figure 17.0 User gender statistics – Survey 27 Figure 18.0 Logo used in the redesign of tntschools.com 32 Figure 19.0 Architectural design of website 33 Figure 20.0 Sketch of new homepage design 34 4 Figure 21.0 Initial design of Home page Page 35 Figure 22.0 Usability Testing Summary of task completion – old website 41 Figure 23.0 Usability Testing Graph of task completion – old website 41 Figure 24.0 Usability Testing Summary of task completion – new website 43 Figure 25.0 Usability Testing Graph of task completion – new website 43 Figure 26.0 Screenshot of Home webpage 49 Figure 27.0 Screenshot of Products webpage 50 Figure 28.0 Screenshot of AkiSIS webpage 51 Figure 29.0 Screenshot of Timetabling webpage 52 Figure 30.0 Screenshot of About Us webpage 53 Figure 31.0 Screenshot of Contact Us webpage 54 Figure 32.0 Screenshot of News webpage 55 Figure 33.0 Screenshot of FAQ webpage 56 Figure 18.0 Survey Posted on Website 64 LIST OF TABLES Page Table 1.0 Schedule of Planned Activities for Gathering User Requirements 12 Table 2.0 Summary of survey responses 65 5 1. Project Proposal 1.1 Organization that is the Focus of your Project The partnership www.tntschools.com is the result of a partnership between two young businesses: Daveaux Business Services Ltd. and AkiSoft Consulting Ltd. The entities joined forces in order to distribute school based software products, namely Aki Student Information System (AkiSIS) and AkiTimeTabler to secondary schools and tertiary institutions throughout Trinidad and Tobago. The role of AkiSoft Consulting AkiSoft is the creative force behind www.tntschools.com. They are responsible for the development, maintenance and support of the software systems. As an individual entity, AkiSoft Consulting is a provider of software solutions that solve real business problems. They transform ideas into solutions that optimize business processes which ultimately lead to higher productivity and profits. They are currently involved with providing: Custom solutions School management systems Royalty collection software Related rights distribution software Decision support systems Vision statement Our aim is to make a significant impact on the computing environment within the Caribbean and Latin Americas through the provision of quality information systems. Mission statements Providing quality customized software solutions that add value to any institution. Providing product support parallel to none The role of Daveaux Business Services Ltd Daveaux is the marketing machinery that drives www.tntschools.com. They are responsible for attracting new clients and act as the face of the partnership. Daveaux also manages ongoing projects ensuring deadlines are met and requirements are upheld. Daveaux tagline „Management through technology‟ 6 1.2 Your Relationship to the Organization One of the group members, Enisha Jack, is employed by AkiSoft Consulting Ltd as support personnel. In fact, she is responsible for the site as it currently exists. She will therefore have direct contact to both business involved in the venture. At the end of the project, it is guaranteed that the site created will be fully implemented. 1.3 Very General Description of the Proposed Project The current website As previously mentioned, this project involves the redesign of the website, www.tntschools.com. Its target user groups are: 1. Prospective customers- This group would include school administrators or teachers. These are persons interested in purchasing any of the software products offered. The website currently provides some details of the features of the products offered as well as contact information. 2. Current user groups - This includes: i. Students ii. Parents iii. Teachers Currently, the users of AkiSIS must visit the website to use it. They also can download AkiSIS user manuals in pdf format. The news page provides insight into the happenings at the business as well as product update information. The following were some of the problems with the current website: Navigation – Lack of navigational feedback since users are unaware of their current location or where they have been on the site. The hyperlinks used in the website did not indicate this. Poor organization of content – The homepage, for example, has too much information presented to the user. As a result, there was a lot of vertical scroll on the page. Poor structure of information – Information did not facilitate scanning by readers. Poor color scheme Missing information – In the contact us page, there was no address information or business hours listed for the company. The goals of the website are: to market the student information system, AkiSIS, as well as AkiTimeTabler to allow access to the web component of AkiSIS to provide manuals for AkiSIS to earn revenue through advertisements geared towards students, teachers, parents i.e. the current users of the site. 7 Figure 1.0 Current website for tntschools.com Aim of project The main focus will be redesigning the current site to improve usability. We are hoping to accomplish a higher degree of functionality through implementing a more user centered interface through improved navigation, effective layout, relevant and concise information, added product support and product updates. Scope The redesign will be centered on improving the information architecture and structure of information on the pages within the website. The Log In page will however not be part of the redesign since this page links to AkiSIS (the web component of the student information system). Some measures to employ: - Improved color scheme - Improved navigation - More readable font - Restructuring of information layout 8 Mission of website “To be a marketing tool for all our school based software products while providing up to date information about product updates and high quality product support to all stakeholders of the systems.” Measurable Goals Increase the number of visits to the site by 60% per day (current statistics shows a low user count). Increase in combined sales of AkiSIS and AkiTimeTabler by 30% Revenue growth from advertising – 30% 9 2. Plan for Collecting Requirements 2.1 Who are the Targeted Users for this Web Site? As identified in section 1.3, the targeted users of the website include: Prospective customers – school administrators or senior teachers/instructors at secondary or tertiary educational institutions Current user groups – these are the teachers, parents and students who must visit the website in order to use AkiSIS software. 2.2 How Will You Have Access to Users? Enisha, our contact to the company, has access to the email addresses and even telephone contacts of some of the current AkiSIS customers. In this way, it will be relatively easy to distribute any surveys that may be employed. It is hoped that the fact that users will have a chance to have an input into the redesign of the website will motivate them to participate in the survey. Through their involvement in the process, it is hoped that respondents will acknowledge that these activities are primarily geared towards meeting their needs as a user of the website. 2.3 What is the Overall Plan for Collecting User Requirements? Surveys The contact information available to us on current users will enable us to initiate a correspondence with them via an electronic based format. These surveys will primarily target teachers as we believe they will be most interested in the redesign of the website. We aim to attract a sample population of 30 users. We intend to post the survey on the tntschools.com current website. Using this approach we intend to target both current as well as prospective users. We will also email the survey to a sample of the current users through Google Docs. Website analysis Google Analytics will also be used to help with defining user requirements. This gives statistics on users‟ profiles. It can be used to determine the technical environment of website visitors, the navigation and overall usage of the website. This has been active since the initiation of the project. 10 Date: October 2010 Pilot Test Survey 8th 9th 10th 11th 12th 13th 14th 15th 16th 17th 18th 19th X Update Survey X Post Survey on Website X Email Survey to Users X Send reminder email to emailed sample Remove survey from website Analyze Responses X X X X * Responses to survey both website based and emailed will be tracked daily during the period 9th October to 19th October. Table 1.0 Schedule of Planned Activities for Gathering User Requirements 11 2.4 What Type of Information do you Need to Gather? In the redesign of the website, it is important that the design team understands who the website's users are and what they expect to get from interacting with it. This means that different types of information about the users, their preferences and their experience need to be gathered. Demographics - Since the age range of the website's users is very large the design team needs to know the makeup of these different groups of users. Questions related to the age and gender of these users will thus be asked in this section. Content Requirements - It is important to understand exactly what the users would like to achieve when they visit the website, therefore we have to find out if they are satisfied with what is currently there and if not, what they would like to see there in future systems. How familiar the users are/are not with these systems impacts on their ability to effectively utilize the systems and the website. Computing Experience - Since there are usually novices, intermediate and expert users, the website needs to cater to the need of all user groups. A lot of parents are expected to interact with the website as well as adolescent children. This means that the website design should be very simple to accommodate this. Through our requirements gathering we will be able to find out what user level our users fall into so that we may better tailor the website to accommodate them. Computing Environment - The website needs to be designed with certain things in mind. The design team therefore needs to find out information related to browser use and internet connection of the users in order to optimize their interaction with the website and to ensure that they can view pages with ease. Benchmarking - The design team can try to find out if any of these users access similar websites to gain and idea of what users expect when they visit this one. Information which is available about the current site such as a log of visits can also be useful to the design team, since it provide information about how many users currently access the site. 2.5 What Information Gathering Techniques Will you Use? Surveys - Since surveys are easy to come up with and they are also cheap and easy to distribute, we intend to utilize surveys to gather the necessary information for the redesign of the website. The electronic surveys will be in two forms: email and web-based. Paper-based surveys can also be distributed as well, if needed. 12 Google Analytics will also be used to help with task analysis and content of the existing website. This tool gives statistics on the number of site visitors, the pages they visited, how long they stayed on these pages and the links they clicked on while on the website 2.6 How will you Develop your Information-Gathering Instruments? The survey will be prepared using Google Docs since this application easily facilitates its distribution and collection of statistics based on results. It will be emailed, posted on the website, or printed and administered to users. The questions will be developed to gain insight into the information required as stated in section 2.4. The survey questions will include : o Open-ended questions – these will give users the chance to express their opinions in their own words o Close-ended questions – these types of questions allow statistics to be easily collected Multiple choice Yes/No Likert scale 2.7 How will you Pilot-Test your Information-Gathering Instruments? The electronic survey questionnaire will be pilot tested to ensure all the aims of the requirement gathering phase are met. We will have trial run of the questionnaire, using the development team as the sample population. We will aim to ensure: 1. There are no grammatical errors. 2. The questions are clearly defined with no ambiguity. 3. The questions being asked are relevant to the requirements of the website. 4. The main focus of the questionnaire is the design of the website to ensure improved usability. 5. All users, regardless of demographic and computing experience have a clear understanding of the questions posed. Different test environments will be used to ensure all considerations are made for different browsers, different monitor sizes and screen resolutions. The development team will then come together to analyze the feedback received from the trial run to determine the modifications required. See Appendix A for Questionnaire 13 3. Site Requirements/Preliminary Design Plan 3.1 What Methods Were Used to Collect Requirements? An electronic survey was the primary method employed to gather requirements from the users. Surveys were administered via email to a small sample (20) of the website‟s current users. It was also posted on the current website (www.tntschools.com) on the “News” webpage. Also, at the beginning of the project, Google Analytics was enabled on the website. This allowed us to track website usage as well as the technical environments of its visitors. This information was also used in overall analysis of website users. 3.2 Statistics Sample Group Out of the 20 surveys emailed and the survey posted on the website, there were 7 respondents. Distribution dates Website survey – this was posted at www.tntschools.com/news.html on October 9th 2010. Responses were collected during the period October 9th to October 19th. The survey was removed on October 19th. Emailed surveys – these were sent on October 10th 2010 indicating a response by 18th October. There were no responses by October 16th and so a reminder email was sent to the same sample with an extended response date (October 19th). Google Analytics This tracking system was activated on all pages of the website excluding the “Log In” page on September 19th 2010. It has since been able to produce statistics on the number of visitors of the website, the pages they visit and well the technical environments under which they operate. The statistics generated will be presented in the following sections. See Appendix B for Summary of responses 3.3 What was Learned About the Client Organization? The creators of www.tntschools.com envision their website as the primary source of support for users of Aki Student Information system. The website should also act a marketing tool for the school-related software products offered through Daveaux Business Services. In addition to these primary objectives, the businesses hope that they are able to earn revenue through advertisements featured on the website. These ads will be geared towards the various users of the website 14 3.4 What was Learned About the Users Relating to Their Technological Environment? GOOGLE ANALYTICS STATISTICAL DATA: According to Google Analytics, from September 19th to October 19th, the following was found in relation to the technological environment of the website‟s users: Total number of site visits during the period: 91 Total number of unique visitors: 38 Operating systems The following chart shows the findings: Operating System used by visitors Macintosh 2% (not set) 1% Windows 97% Figure 2.0 Operating System According to statistics, Windows is the most popular operating system used by the current visitors of the website. As a result, the website will be developed on a Windows platform, more specifically, Windows Vista. 15 Browsers The following chart shows the findings: Browser used vs No of Visitors 60 50 40 30 20 10 Visits 0 Figure 3.1 Web browsing statistics Based on the statistics, illustrated by the chart above, it can be seen that most visitors of the website use Internet Explorer to browse the internet. Figure 3 on the next page goes on to show that of these users, most use version 8 of the browser. Website design must therefore ensure that IE users can access and use the new website. Also, since together Chrome and Firefox users represent almost one half of the visits to the current sites, the new design must also allow the website to be accessed by these users. Internet Explorer versions used 40 35 30 25 20 Visits 15 10 5 0 8 6 Figure 3.2 Internet explorer versions 16 Screen Resolutions Screen resolutons used vs No of visitors 45 40 35 30 25 20 15 10 5 0 Visits Figure 4.0 Screen resolution statistics From the above graph, it can be seen that the most popular screen resolution used is 1024x768. Owing to this, the new website design must ensure that the website will be displayed correctly at this resolution. 17 Flash versions Flash version used vs No of visits 50 45 40 35 30 25 20 15 10 5 0 Visits 10.1 r85 (not set) 10.0 r32 10.0 r45 10.1 r53 10.0 r22 10.1 r82 10.0 r12 10.1 r51 Figure 5.0 Flash versions statistics Using Google Analytics, it was found that in most of the visits to the website, most users had a version of flash installed. This means that they would be able to view flash media on the website. With respect to our design, from these findings, flash may be used to display advertisements on the website. Java Support No.of visitors with Java enabled Yes No Figure 6.0 Java support statistics 18 The previous figure shows that in most visits to the website, the computer used had java enabled. This would suggest that a significant number of users could access media presented using Java. Service providers ISPs vs No. of visits microsoft corp greendot cable & wireless (barbados) limited Visits global crossing telecommunication services of trinidad and tobago columbus communications trinidad limited. 0 10 20 30 40 50 60 70 Figure 7.0 ISP statistics The results shown in the bar chart above, illustrates that most use Flow packages (Trinidad and Tobago). This is good news since Flow‟s packages have download speeds from 5Mbps. 19 STATISTICS GATHERED FROM SURVEY RESPONDENTS: What browser do you use? Figure 8.0 Browser statistics – Survey Similar to the findings from Google Analytics, Internet Explorer and Google chrome were reported as the top browsers by the limited responses from the survey. Consequently, as stated before, we will ensure that the redesign of the website is tailored primarily to run on these two browsers. What version of the browser do you use? Figure 9.0 Browser version statistics – Survey Again, the survey statistics are supported by the Google Analytics results. Version 8 of Internet Explorer was most popular. However, it can be seen that there were respondents who were not aware of the browser version. This fact should relate to the level of user experience of the respondent. 20 What screen resolution do you use? Figure 10.0 Screen resolution statistics - Survey Again supporting Analytics, of the respondents, resolution 1024x728 was most popular. As a result this will be used as the design resolution. What browser plug-ins do you use? Figure 11.0 Browser plug in statistics – Survey User statistics show that the majority of users have flash plug-ins. The manuals on the website are in PDF format and the statistics show that users have Adobe Acrobat Reader. This means they will be able to access the manuals. 21 Please select your internet service provider ISP Figure 12.1 ISP - Survey Please select the associated package from the ISP you selected in the previous question Figure 12.2 Internet Connection speed statistics - Survey Of the small sample received, the majority of users have a Flow internet connection with a speed between 5 Mbps and 25 Mbps. One user had a Blink connection of 2Mbps.The number of respondents was limited so it is difficult to gauge what is the average speed of the users, but users seem to have a reasonable internet connection especially when considering the statistics from Google Analytics. In this way, user speeds allow for fast loading of web pages. 22 3.5 What was Learned About the Users Relating to Their Technological Experience? STATISTICS GATHERED FROM SURVEY RESPONDENTS: How comfortable are you using the computer? (Computing experience) Figure 13.0 Computing experience statistics - Survey From the findings, all of the users have used a computer. The majority of users see themselves as comfortable using a computer. The others are either extremely competent users or users with some computing experience. How often do you go online? (Frequency of web browsing) Figure 14.0 Web browsing statistics - Survey The majority of the users browse the web every day. The remainder of respondents browses between 1 and 4 times per week. These findings suggest that our users have a fair level of computing skills and are so aware of some internet conventions. 23 3.6 What was Learned About the Users Relating to Their Content Needs? STATISTICS GATHERED FROM SURVEY RESPONDENTS: Overall, how do you rate the website? Figure 15.0 Website rating statistics - Survey Users seem to have a neutral feeling towards the site. It appears that these users have encountered little difficulty when accessing the site and its contents. There was one user that found the site to be poor but generally it was seen as acceptable. Respondents listed the following requirements they most look for in a site: Content Availability of useful information Presentation Ease of finding helpful information in very little time. Up-to-date information It is evident from the responses that users are looking for a website that is easy to navigate and meets basic requirements for using the product with the news section frequently updated. 3.6.1 What was Learned About the Users Relating to any Benchmark Web Sites? STATISTICS GATHERED FROM SURVEY RESPONDENTS: List some of the websites that you visit most often. User‟s listed the sites they most visit as: facebook.com (most users listed this) hotmail.com (most users listed this) 24 deviantArt.com mangastream.com bbc.co.uk gozmodo.com http://www.visualmathlearning.com http://www.math.com/ wikipedia Yahoo Gmail This showed that user‟s are primarily interested in entertainment and email providers. Competitor websites are: http://focus-sis.org/index.php http://www.pearsonschoolsystems.com/products/powerschool/ We will look at the design of these sites to see how we can improve on the current design of www.tntschools.com . 25 3.7 What was Learned About the Users Relating to any Demographic Information? STATISTICS GATHERED FROM SURVEY RESPONDENTS: Age Figure 16.0 User Group age statistics – Survey Gender Figure 17.0 User gender statistics - Survey It must be noted that the sample size was too small to be representative. However, the data shows users are within the age group 20 – 49 years. This eliminates the need to primarily accommodate visual impaired users although we will still take all users into consideration. The font size can be a generally readable. 3.8 What was Learned About the Users Relating to Their Domain Knowledge? From Sections 3.4 and 3.5 it is obvious that users are frequent web browsers and have the necessary applications (Adobe Acrobat Reader) to use the site and access its contents (manuals in PDF format). Users listed the below as the sites they are most interested in: entertainment news (several users listed this option) 26 tech reviews (several users listed this option) academics websites like msn.com where I can find articles about almost anything Gaming forums Torrent websites Music From this we can conclude that the users who took part are confident web surfers and have a fair understanding of how to use the internet. 3.9 Were There any Unexpected Findings from the Requirements Gathering? All findings were along the line of expected results. One thing that stood out was the percentage of users with Java support. The data showed the majority of visitors have Java support. 3.10 Preliminary Design Plan The new website will be redesigned to focus on achieving user satisfaction. It will take into consideration: A user group of fairly competent users Up-to-date information Internet Explorer 8 and Google Chrome as the main web browsers Windows Vista as the development platform Design will be centered on a resolution of 1024 x 768 Users with a connection speed that will allow quick loading of web pages Since users listed content organization as one of the downfalls, this will also be considered 27 4 Full Design Plan/Interface Prototype 4.1 What Content will be Included on the Web Site? The content of the new website includes the following pages: Home – General details about the website Products – Provides links to both the AkiSIS and Timetabling pages AkiSIS – Information on AkiSIS Timetabling – Information on the timetabling component of the website About Us – information about the website Contact Us – contact information for the company o Contact Name o Contact Telephone number o Contact email address o Business address o Business hours o Business telephone number News – news highlights about the website and software information FAQ – frequently asked questions about the software Log In – log in for AkiSIS users (not included in the redesign) Where Will the Content Come From? The content for the redesigned website are primarily already included in the current website but we will be reorganizing the content into the relevant pages. At present, there are user manuals in pdf format on the website. These will be included in the redesign of the website. We are also going to include a webpage about the software developers and this information will be taken from company documentation. 4.2 How will Navigation be Provided? The navigation for the website will be provided through the use of a top menu. This will be topical navigation with links to the major sections of the website. There is no need for audience splitting given the nature of the website and the target users. The use of „breadcrumbs‟ will be implemented to ensure users know where they are at all times and can backtrack to any page at any point. There will a sitemap to provide the overall layout of the website. The tabs on the top menu will be: Home Products News Contact Us About Us Log In 28 4.3 FAQ What Will the Page Layout Look Like? Elements that will appear on each page (header information): Title Bar - Company name and tag line Page title that identifies the current page The top menu with links to all the main sections of the web site Breadcrumb navigation trail At the base of each page the following elements will appear (footer information): Web master link Last updated date The page layout scheme will consists of the website‟s header information, the top menu and the relevant information for each page. The layout will be kept simple. Advertisements will appear on each of the following pages: Home News Products The identifying information for the website will be the header of each webpage. The contact information will be provided in the „Contact Us‟ tab in the top menu. 4.4 Download Speed Based on current files for the redesigned website, the below calculations show that we are within the acceptable download speed of 10 seconds. Calculating Download Speed Download speed of website = Size of html files, images / network connection speed (bits) For a minimum connection speed of 256 Kbps: Download time of website = 7, 544, 832 b / 256, 000 bps = 29.472 seconds Download time for each webpage = 29.472 s / 8 webpages = 3.684 seconds Download time for manuals = 9, 060, 352 b/ 256, 000 bps 29 = 35.392 seconds For an average internet connection (Flow basic package) of 5 Mbps: Download time of website = 7, 544, 832 b / 5, 000, 000 bps = 1.51 seconds Download time for each webpage = 1.51 s / 8 webpages = 0.19 seconds Download time for manuals = 9, 060, 352 b/ 5, 000, 000 bps = 1.81 seconds Factors that will affect the download speed of a webpage include: The manuals available on the website are presented in pdf format. Graphics used in advertisements The manuals may affect the download speed of the website. However, these user manuals are essential to the website since they are guides for use of the information system, AkiSIS. Advertisements are part of the service provided by tntschools.com and as such they will need to be implemented in the design. These two features should not have any great impact on the download speed as the current calculated speed of the webpages are relatively small and any further delays should still maintain a reasonable load time. Maximum size of file Max size = Internet connection speed / Maximum response time For a minimum connection speed of 256 Kbps: Max size = 256 kbps * 10 s = 2,560 kb = 320 KB The above calculation is based on the lowest internet connection available locally; 256 Kbps and the acceptable download speed of 10 s. This ensures that our current redesigned webpages meet the requirements. 4.5 What Colors will be Used? The tntschools.com currently does not have a logo and it is not the responsibility of the development team to design one. For the purpose of this course, we are using a substitute logo 30 instead. Since the business also does not have a particular colour, the design team is free to use any colours in the design of the site. The colours chosen for the redesign of the site were blue and white, in keeping with the colours used in the logo. Text will be white against blue, and black against white. Hex value of colour used: #000099 Figure 18.0 Logo used in the redesign of tntschools.com 4.6 Will there be any Graphics that Need to be Developed? Presently, the graphics that exist on the website are mainly the advertisements and the logo for AkiSoft Consulting Ltd. The new version of the website intends to maintain the same advertisements that were there before and eventually new advertisements will be accommodated. A logo will be sourced for the website for the purpose of this course. Apart from this, no other graphics will be developed. 4.7 How did the Requirements Gathering Impact the Design of the Web Site? The Requirements Gathering process helped us to identify the technical environment that must be taken into consideration when designing. Findings include: - Operating system: Windows Vista Screen resolution: 1024 x 768 Internet browser: Internet Explorer 8 Maximum page size: 320 KB The following items show the information architecture, a sketch of the new design and a first draft of the redesigned home page. 31 Home Products AkiSIS About Us Contact Us News FAQ Log In Timetabling Figure 19.0 Architectural design of website 32 ComaC LOGO Company Name Tag Line – (Managing education through technology) Top Menu Breadcrumbs Trail where applicable Advertisements Page Title Main Content f Footer Figure 20.0 Sketch of new homepage design 33 Figure 21.0 Initial design of Home page The figure above shows the design of the homepage during the first iteration. It must be acknowledged that this design does not correspond to the information architecture also illustrated in this section. However, the final design incorporates the architecture shown above. 34 5 Usability Testing 5.1 What Methods Will be Used to Collect Usability Data? The following are the methods that we will be using to collect usability data: Task/time performance – We will be measuring how long it takes a user to complete a task and which tasks were/were not completed by the users. Number of errors – Each error made by the users will be recorded with accompanying comments to explain the error. Think Aloud Protocol – Users would also be encouraged to think aloud during the performance of their tasks, so as to provide us with feedback. Since the voice and video would be recorded, we would be able to revisit user comments during their task performance. User satisfaction – User satisfaction would be measured by means of a survey, to be administered at the end of the task performance. 5.2 What are Expected Common Tasks of Users? The most frequently performed tasks on the website will be: Downloading a user manual Finding product information o Features o Requirements o Cost Finding the contact information of the business Users will also be expected to perform some basic navigation around the website. Users may also visit the: About Us page to find information about the business News page to view the latest happenings FAQ page to find solutions to some commonly asked questions about using the products 5.3 What Tasks will be Utilized in the Usability Testing? The following are the tasks that we will ask the participants of the usability test to perform: 1. Find and write the name of the developer of the software application provided by tntschools.com. 2. Find and write one type of student information accessible through AkiSIS. 3. Find and write the cost for Option 2 of the Timetabling system if a school has 900 students. 35 4. Find and write the email address of Daveaux Business Services. 5. Find and write a news event that occurred in October 2010 regarding AkiSIS. 6. Find and write the support advice provided on the website for the commonly asked question below: “Why can’t I view my transcript?” 7. Write the note given in the Student User Manual for the AkiSIS system regarding passwords after accessing AkiSIS for the first time. 5.4 Where Will the Usability Testing Take Place? The usability testing of the website will take place at the University of the West Indies, St. Augustine campus, Faculty of Science and Agriculture, Department of Computing and Information Technology, Usability Lab. This will be conducted under the supervision of course demonstrator, Tricia Rambharose. 5.5 Usability Testing Participants The usability participants were recruited from the University to be representatives of the student target user group. Students were approached and asked to be involved in this exercise. Since the information system can be used at both Secondary and Tertiary level educational institutions. The participants are representatives of the tertiary student body. Due to time constraints and the unavailability of representatives of the teacher and parent bodies, only the student target group will be participants in our usability exercise. 5.6 Expert Reviews The constraints of the project and the unavailability of personnel actively involved with the use of the website do not permit us to consider expert reviews in the usability testing. Dr. Alexander Nikov has served as advisor throughout the course of this project. He has consistently provided feedback at each phase; however, he was not physically present at the usability testing exercise. We had a walkthrough of the website design prior to the usability testing. 5.7 Specific Concerns Users of the old website listed organization and appeal as one of the major issues of the website. We will be looking for feedback on the redesign and restructuring of the website. 36 5.8 Results of the Usability Testing Usability Pre-Testing: Thursday 25th November, 2010 4:00 p.m. Usability Testing: Friday 26th November, 2010 4:00 p.m. Location: The University of the West Indies, St. Augustine campus, Faculty of Science and Agriculture, Department of Computing and Information Technology, Usability Lab. Participants: Two tertiary level students – user 1 performed his tasks based on the current (old) website and user 2 worked with the redesign of the website. 37 5.9 Individual User Experiences The usability testing exercise was conducted by testing the current (old) website design and the new website design. The exercise was carried out using only one user for each test environment (version of the website) so that all our analysis and criticism of the websites are solely based on each of the user‟s experience. A combined analysis of the usability testing task results and satisfaction survey responses is therefore not applicable. Usability Testing User Task List and Survey instruments Usability Testing: Summary of task responses from participants tntschools.com Usability Testing The design team of the tntschools.com website thank you sincerely for you participation in this Usability Testing design exercise. Your contribution will help to guarantee our client an effective, efficient and satisfactory website for their targeted audience as well as the general public. Please be reminded that you will be video recorded as well as observed by the design team from an adjacent room, throughout the exercise. To enable us to capture much needed data, we kindly ask the following: Say the number of the task when you begin each task (e.g. “Task one ….Task two”). Fill in the tasks sheet with your response to the relevant task. Complete the satisfaction questionnaire after completing the usability testing of the website. If you encounter any difficulty, feel free to speak it out (For example: “Cannot find the home page link from the Contact Us page”). We encourage you to be completely honest. If you feel uncomfortable at any point or require assistance, please say so and someone will respond immediately. Your participation in this exercise is much appreciated and once again we would like to extend our gratitude. 38 USABILITY TASKS Please write the responses to the task in the spaces provided. 1. Find and write the name of the developer of the software application provided by tntschools.com. User 1: AkiSoft Consulting Ltd User 2: AkiSoft Consulting Ltd 2. Find and write one type of student information accessible through AkiSIS. User 1: Applicants User 2: Timetable 3. Find and write the cost for Option 2 of the Timetabling system if a school has 900 students. User 1: $18,000 User 2: 18,000 4. Find and write the email address of Daveaux Business Services. User 1: [email protected] User2: [email protected] 5. Find and write a news event that occurred in October 2010 regarding AkiSIS. User 1: partaking in this survey User 2: implementation of system by Holy Name Convent POS 6. Find and write the support advice provided on the website for the commonly asked question below: “Why can’t I view my transcript?” User 1: NA User 2: You need to disable your pop up blocker. 7. Write the note given in the Student User Manual for the AkiSIS system regarding passwords after accessing AkiSIS for the first time. User 1: Each user has their own username and password that they will use to log in. User 2: Change password, keep new password to yourself 39 Usability Testing: Satisfaction survey responses from participants User Satisfaction Survey Please rate the following questions based on the tasks you completed on the website www.tntschools.com by placing a tick to indicate your response. Green – user 1 X Blue – user 2 X 1. The words, phrases and concepts used are familiar to you. 2. The information is presented in a simple, natural and logical order. 3. There are facilities provided to return to the top level at any stage (e.g. links back to homepage). 4. There is a consistent look and feel to the system interface. 5. The relationship between controls (e.g. buttons, hyperlinks) and their actions are obvious. 6. The „look‟ and „feel‟ of the website is simple, intuitive, easy to learn and pleasing. 7. The website is free from irrelevant, unnecessary and distracting information. 8. Help is clear and direct and simply expressed in plain English, free from jargon and slogans. 9. The navigational feedback (e.g. showing your current and initial location, where you've been and what options you have for where to go) is provided. 10. Related pieces of information are grouped together. 11. Each screen is comprised of one (1) document on one (1) topic with the most important information appearing at the top. 12. Hypertext has been used appropriately to structure content. 13. Pages have been structured to facilitate scanning by the reader. Strongly Disagree Disagree Neutral Agree XX X Strongly Agree X X X X X XX X X XX XX X X X X X X X X X X 40 User 1 (Old Website) Figure 22.0 Usability Testing Summary of task completion – old website Figure 23.0 Usability Testing Graph of task completion – old website User 1 Task Completion Times: Task 1 – 28 seconds Task 2 – 32 seconds Task 3 – 41 seconds Task 4 – 32 seconds Task 5 – 49 seconds 41 Task 6 – not applicable Task 7 – 45 seconds (Since task 6 was not applicable to user, Task 7 incorporates times from Task 6 and Task 7 in the screenshot) Total Task Completion Time: 4 minutes 28 seconds The user commented that the manual took some time to load. This information was gathered by the user thinking aloud and us being able to hear it on the audio equipment. The user managed to successfully complete all 6 tasks given to perform. It is important to note that although the answers given in Tasks 1 and 7 were not the expected answers, they were found in the same section as the preferred answers. The feedback about the manual taking long to load is useful feedback, as it lets us know that the manual size is a possible issue negatively affecting the user experience. 42 User 2 (New Website) Figure 24.0 Usability Testing Summary of task completion – new website Figure 25.0 Usability Testing Graph of task completion – new website 43 User 2 Task Completion Times: Task 1 – 29 seconds Task 2 – 2 minutes 21 seconds Task 3 – 20 seconds Task 4 – 27 seconds Task 5 – 36 seconds Task 6 – 29 seconds Task 7 – 2 minutes 6 seconds Total Task Completion Time: 7 minutes 13 seconds The user navigated to the wrong page during task 2. Instead of going to the Products page they went to the About Us page. The user also commented that they did not fully understand what they were supposed to do for task 2, and navigated to the wrong page again. This time they went to the Timetabling page instead of the Products page. The user managed to successfully complete 6 out of 7 tasks given to perform. Task 2 was the only task the user was unable to correctly complete. It is important to note that although the answer given in Task 1 was not the expected answer, it was found in the same section as the preferred answer. 5.10 What was Learned from the Usability Test It was found that Tasks 1 and 4 were completed in almost the same amount of time by both users. Task 1 asked for the name of the software developer and in both cases the user found this information on the homepage. It was however expected that the users would have visited the About Us page for this information. The behavior of the users, however, may be as a result of the wording of the question. The question asked for the name and the development team expected Dr Wayne Goodridge as the answer, however, both users wrote AkiSoft Consulting. It must be noted that on the homepage the software developer was described as AkiSoft Consulting. Despite this, the team accepts Task 1 as being completed by both users because of the question should have been wording differently. The efficiency of this task was 28 seconds on the old website and 29 seconds on the new website. Task 4 asked for the email address of the business. In both cases, the users navigated to the correct page, the Contact Us page. Using the old website, the efficiency of this task was 32 seconds and on the new website, its efficiency was 27seconds. While Tasks 1 and 4 had similar efficiencies, they were not the most efficient of the usability testing. In fact, Task 3 on the new website was most efficient, taking User 2 only 20 seconds to complete it. In the current/old website design, information was grouped by paragraphs and so did not facilitate the easy scanning and retrieval of information. Consequent to this, User 1 took 41 seconds to complete the same task. However, in the new design, information on the Timetabling 44 page, was presented in list form so to making it easier to scan. It must be noted however, that User 2 was also already on the Timetabling page when the task was started. User 2 had one major problem during his usability test. This user had some trouble understanding what was asked in Task 2. As a result, the user was unsure where he should have gone to find the relevant information. While attempting to find this information, this user first navigated to the correct page, the Products page. From here, he was unsure how to move forward and eventually get the relevant page, the AkiSIS page. At the end of the 2 minutes 21 seconds, the user was unable to correctly complete the task. This may be as a result of the wording of the question in addition to the use of navigational clues in the new design. The results of the satisfaction survey show that User 1 was more satisfied with the old website than User 2 and the new design. Both users had similar responses concerning the dimensions Match between system and real world (domain knowledge), Help and documentation, Recognition rather than recall and Aesthetic and minimalist design. The noteworthy differences between the responses are: User 2 felt the new website design had a more consistent look and feel than User 1 thought of the current/old design Also, user 2 felt that the information new design was more structured. This was one of our goals of redesign. However, User 1 felt information was grouped together better in the current design than user 2 felt of the new design. In both designs, users felt that navigational feedback was poor. This means that the new design must include both breadcrumbs and show active and visited links before the website goes live. User 1 believed that the current design presented information in a logical and easy to learn order. However, User 2 felt only „Neutral‟ that this criterion was met in the new design. This clearly suggests that the information on each page must be reorganized in order of importance in order to help visitors use the website. Based on the results of Usability testing, the following additions and/or changes will be made to the redesign: 1. Some form of navigational feedback should be included 2. The content of pages should be regrouped in a more natural order and 3. Content should also better facilitate scanning 45 6 Implementation and Marketing 6.1 Who Will Manage the Web Site? The newly designed website will continue to be managed by our teammate and AkiSoft Consulting staff, Enisha Jack. She will be responsible for keeping content up-to-date and relevant. 6.2 Where Will the Web Site Be Housed? The current website is housed on a server that is rented from Webberz. For now at least, it is safe to say that the new design will continue to be hosted on this server. 6.3 What Will the URL of the New Web Site Be? Will the client organization reserve a domain name? The URL of the new website will also be www.tntschools.com. 6.4 On What Date will the Site Go Live? When will the web site be available to anyone on the web? (Chapter 10) The official launch of the website cannot yet be determined. For the purposes of this project, we employed the use of a substitute company logo for the website redesign as it is not the responsibility of the development team to develop graphics for use on the website. As such, the date of launch is based on the company contracting graphic developers to design an official logo for the website. We are currently unable to give a proposed date when the website will be made available to the public given this restriction. On completion of this project, the website will continue to be the responsibility of our teammate, Enisha Jack. She is a member of the AkiSoft Consulting staff and intends to see the website redesign through to implementation. 6.5 Will the Web Site Manager Need any Training or Documentation? As previously stated, management of the website will be the continued responsibility of our teammate, Enisha Jack. In light of this, no official training or documentation will be required as she is familiar with all aspects of the website design. Furthermore, she is quite capable of maintaining the website and will ensure content is kept up-to-date and can implement any changes if necessary. 46 6.6 How Often Will the Content on the Web Site Need to be Updated? The webpages of the website will be updated periodically based on the type of content. Webpages that will need to be maintained on a regular basis include: News This will be updated to reflect current events involving tntschools.com and the partnership businesses. Frequency of the update will be based on availability of new content. FAQ Will be updated to ensure that new and common questions are addressed in a timely manner. Products Will be updated as new products are developed by the software development component of the partnership. All other content will be updated when there is a need. 6.7 How Will the Web Site Be Marketed? The marketing techniques that can be employed for the website includes: URL of website This will be included in business emails and documented on company stationery such as letterheads. Search Engines The website can be registered with Google. The client organization will inform the current users of the website redesign during meetings and/ or letters. 47 6.8 Site Evaluation The site can be evaluated in the future by means of a feedback form, which would allow users to send feedback about their experiences using the website. It can provide information such as whether or not they are satisfied with the content and functionality of the site, and provide suggestions as to what they would like to see on the site in the future. Google Analytics is another useful tool for site evaluation. Some website statistics that would be useful to be track using this tool are number of site visits and new visits, number of page views per visit and average time spent on the site by a user. 6.9 Future Suggestions Some suggestions for the client organization in the future could be to add some more features to the website in the future, such as a support section, especially if more products are added to the website. Another suggestion could be to add a review section, specifically aimed at providing a means for the customer to send their feedback about their experiences using the site. 48 User centered redesign of the website - www.tntschools.com Screenshots of website: Home Figure 26.0 Screenshot of Home webpage 49 Products Figure 27.0 Screenshot of Products webpage 50 Products -> AkiSIS Figure 28.0 Screenshot of AkiSIS webpage 51 Products -> Timetabling Figure 29.0 Screenshot of Timetabling webpage 52 About Us Figure 30.0 Screenshot of About Us webpage 53 Contact Us Figure 31.0 Screenshot of Contact Us webpage 54 News Figure 32.0 Screenshot of News webpage 55 FAQ Figure 33.0 Screenshot of FAQ webpage 56 References Websites: Logo: http://www.coolchaser.com/graphics/tag/yamaha%20logo Calculating download speed: http://www.isitebuild.com/calculate.htm Colour hex values and html tags: http://www.w3schools.com/ Web Usability lectures: http://www2.sta.uwi.edu/~anikov/comp6650/lectures.htm Web Usability Sample projects: http://www2.sta.uwi.edu/~anikov/comp6650/project-samples-2009.htm http://www2.sta.uwi.edu/~anikov/comp6650/project-samples-2008-sem2.htm Text books: Lazar, J (2007). Web Usability: A User Centred Design Approach. Addison-Wesley. 57 - Survey Questionnaire APPENDIX A 58 WEBSITE SURVEY This survey is aimed at improving the usability of this website (www.tntschools.com). Please try to answer all questions. Tick the appropriate checkboxes or write your responses in the space provided. * Required What is your age? * 10-19 20-29 30-39 40-49 50 and over What is your gender? * Male Female How comfortable are you using a computer? * I have never used a computer before in my life I have a little experience using computers I am comfortable and competent using a computer I am an extremely comfortable and highly competent computer user How often do you go online? Never 1-2 times per week 3-4 times per week Everyday Please select your internet service provider from the following list: * Flow Blink Broadband (TSTT) Greendot Other: Please select the associated package from your internet service provider you selected in the previous question: * 59 Flow Turbo 20HR Flow Turbo 5 Flow Turbo 25 Flow Turbo 50 Flow Turbo 100 Blink 500 MB Blink 2 GB Blink 4 GB Blink 6 GB Blink 8 GB Greendot Personal Package Other: What browser do you use? * Mozilla Firefox Internet Explorer Google Chrome Other: What version of the browser do you use? * 7 8 9 I do not know Other: What screen resolution do you use? 1280 x 720 1024 x 768 800 x 600 640 x 480 I do not know Other: 60 What browser plug-ins do use?(You may select more than one) Adobe Acrobat Reader Flash Player I do not know Other: The last time you visited the website, were you able to find what you wanted? Yes, very easily Yes, after a little while No What do you think the website is missing? (If any) Do you visit websites similar to www.tntschools.com?(If No, skip question 13) Yes No What do you like about these websites?(Only answer if you answered Yes to question 12) 61 List some (2 or 3) of the websites that you visit most often? * What type of websites are you generally interested in? * What do you like most about these websites? * Overall, how do you rate the website www.tntschools.com? Very Good Good Neutral Poor Very Poor Submit Powered by Google Docs 62 APPENDIX B - Screenshot of survey posted on www.tntschools.com Summary of survey responses from Google Docs 63 Figure 34.0 Survey Posted on Website 64 10/19/201 0 11:26:00 10/19/201 0 11:41:56 10/19/201 0 16:55:50 10/19/201 0 17:23:21 10/19/201 0 21:57:22 10/19/201 0 22:40:22 What is your 20-29 age? 30-39 40-49 30-39 40-49 20-29 20-29 What is your Male gender? Female Male Female Male Male Female Timestamp 10/18/201 0 13:22:59 How comfortable are you using a computer? I am comfortab le and competent using a computer I have a little experience using computers I am an extremely comfortabl e and highly competent computer user I am comfortabl e and competent using a computer I am comfortabl e and competent using a computer I am comfortabl e and competent using a computer I am an extremely comfortabl e and highly competent computer user How often do you go online? Everyday 1-2 times per week Everyday Everyday 3-4 times per week Everyday Everyday Please select your internet service provider from the following list: Flow Blink Broadband (TSTT) Flow Flow Flow Flow Flow Please select the associated package from your internet service provider you selected in the previous question: Flow Turbo 25 Blink 2 GB Flow Turbo 5 Flow Turbo 25 Flow Turbo 5 Flow Turbo 5 Flow Turbo 25 What browser do Google Chrome Internet Explorer Mozilla Firefox Google Chrome Internet Explorer Internet Explorer Google Chrome 65 you use? What version of the browser do you use? latest 8 I do not know 6 I do not know 8 8 What screen resolution do you use? 1280 x 1024 800 x 600 1280 x 720 1440 x 900 I do not know 1024 x 768 1024 x 768 What browser plug-ins do use? Adobe Acrobat Reader, Flash Player I do not know Adobe Acrobat Reader, Flash Player Adobe Acrobat Reader, Flash Player Adobe Acrobat Reader, Flash Player Adobe Acrobat Reader Adobe Acrobat Reader, Flash Player The last time you visited the website, were you able to find what you wanted? What do you think the website is missing? (If any) Yes, after a little while Yes, very easily Yes, very easily Yes, after a little while Yes, very easily Yes, very easily Yes, very easily organizati on Nothing really. It gets the job done for me. Do you visit websites similar to www.tntscho ols.com? No No No appeal & organisato n No No ability to try the software for a trail period What do you like about these websites? Overall, how do you rate Yes Poor Neutral Neutral Yes Informativ e Neutral Neutral Good Good 66 the website www.tntscho ols.com? List some (2 or 3) of the websites that you visit most often? facebook. com deviantArt .com mangastre am.com www.hot mail bbc.co.uk http://ww gozmodo.c w.visualm om athlearnin g.com What type of websites are you generally interested in? entertainm ent news tech reviews academic tech / news What do you like most about these websites? content availabilit y of useful informatio n presentatio n wikipedia hotmail.co m facebook Facebook, Hotmail, Yahoo Facebook Gmail Hotmail Academic sMathemati cs websites like msn.com where i can find articles about almost anything News, Gaming forums, Torrent websites, Music and Entertain ment websites Entertain ment Ease of finding helpful informatio n in very little time. their content There is so much to do and the content is always being updated. Entertaini ng http://ww w.math.co m/ Table 2.0 Summary of survey responses 67 APPENDIX C - Sample of Usability Task Lists and Satisfaction Questionnaire: Developer‟s Copy 68 Task List – Developer: Tasks and expected responses USABILITY TASKS Please write the responses to the task in the spaces provided. 1. Find and write the name of the developer of the software application provided by tntschools.com. Dr Wayne Goodridge . 2. Find and write one type of student information accessible through AkiSIS. Can be one of: Applicants, Admissions, Students, Health, Grade Book 3. Find and write the cost for Option 2 of the Timetabling system if a school has 900 students. The price will be $20 x 900 = $18,000.00 4. Find and write the email address of Daveaux Business Services. [email protected] 5. Find and write a news event that occurred in October 2010 regarding AkiSIS. AkiSIS goes live at Holy Name Convent. 6. Find and write the support advice provided on the website for the commonly asked question below: “Why can’t I view my transcript?” You need to disable your pop up blocker. 7. Write the note given in the Student User Manual for the AkiSIS system regarding passwords after accessing AkiSIS for the first time. It is advised that he/she change the password that they were given and keep the new password to themselves. 69 Satisfaction Survey – Developer: Dimensions included User Satisfaction Survey Please rate the following questions based on the tasks you completed on the website www.tntschools.com by placing a tick to indicate your response. Strongly Disagree Disagree Neutral Agree Strongly Agree Match between system and real world 1. The words, phrases and concepts used are familiar to you. 2. The information is presented in a simple, natural and logical order. User control and freedom 3. There are facilities provided to return to the top level at any stage (e.g. links back to homepage). Consistency and standards 4. There is a consistent look and feel to the system interface. Recognition rather than recall 5. The relationship between controls (e.g. buttons, hyperlinks) and their actions are obvious. Aesthetic and minimalist design 6. The „look‟ and „feel‟ of the website is simple, intuitive, easy to learn and pleasing. 7. The website is free from irrelevant, unnecessary and distracting information. Help and documentation 8. Help is clear and direct and simply expressed in plain English, free from jargon and slogans. Navigation 9. The navigational feedback (e.g. showing your current and initial location, where you've been and what options you have for where to go) is provided. Structure of information 10. Related pieces of information are grouped together. 11. Each screen is comprised of one (1) document on one (1) topic with the most important information appearing at the top. 12. Hypertext has been used appropriately to structure content. 13. Pages have been structured to facilitate scanning by the reader. 70