1
Software Release (1.0.1)
Last updated: April 30, 2014.
MARS: Multiple Atlases Robust Segmentation
Guorong Wu, Minjeong Kim, Gerard Sanroma, and Dinggang Shen
{grwu, mjkim, gerard_sanroma, dgshen}@med.unc.edu
Image Display, Enhancement, and Analysis (IDEA) Laboratory
Department of Radiology and Biomedical Research Imaging Center (BRIC)
University of North Carolina at Chapel Hill, Chapel Hill, NC 27599
1. Purpose
A lot of medical-imaging-based studies demand accurate segmentation of anatomical structures, in order
to quantitatively measure structure differences across individuals or between two groups [1, 2]. For
example, multiple brain regions need to be automatically delineated for hundreds of brain MR images
before constructing brain connectivity network [3, 4]. To this end, automatic ROI (Region of Interest)
labeling has been a hot topic in medical image processing areas, as evidenced by many labeling and label
fusion methods that have been developed to improve both segmentation accuracy and robustness.
The software is hosted at IDEA lab webpage of University of North Carolina at Chapel Hill
(http://bric.unc.edu/ideagroup/free-softwares/) and NITRC (http://www.nitrc.org/projects/mars/). Our
software is free to use for the academic research purpose Please cite the paper [5, 6] as references if your
studies use this software.
This software is distributed WITHOUT ANY WARRANTY; without even the implied warranty of
MERCHANTABILITY or FITNESS FOR A PARTICULAR PURPOSE.
2. System and Installation
This software is developed using QT (http://qt.nokia.com/) and has been tested on Windows XP (32bit/64-bit), Window 7 (32-bit/64-bit), MAC (64-bit, OS X 10.9.2), and Linux (64-bit, kernel version
2.6.18-194.el5). Since GLIRT is for the large data analysis, we suggest the computation machine has
more than 2G memory and 10G free disk space.
2.1 Overview of MARS
In general, MARS has integrated several state-of-the-art multi-atlas based segmentation methods, such as
majority voting, local weighted voting, and non-local patch based segmentation methods. Specifically, we
also included our recently-developed patch based segmentation method in this software. Compared with
convention methods, our method has the following advantages: (1) add sparsity constraint to suppress the
influence of misleading patches; (2) reduce the joint risk of two patches jointly making the same
segmentation errors, (3) augment the conventional image patch with multi-scale representation and labelspecific patch partition, and (4) use iterative framework to correct the possible mis-segmentations. In
order to efficiently segment the ROIs in imaging-based researches, we developed user-friend GUI to
facilitate the fast and easy processing of hundreds of images.
2.2 Installation for Windows User
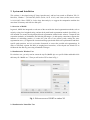
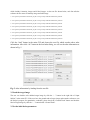
For windows user, you only need to extract the zip file (MARS.zip) to a specific folder and double click
the binary file “MARS.exe”. Then you will see the GUI as show in Fig. 1.
Fig. 1. Welcome screen of GLIRT in window XP.
2.3 Installation for Linux/Mac User
For linux/mac user, please download the software (MARS.tar.gz) and extract (using command tar xzfv
MARS.tar.gz) to certain folder, for example, /home/usrname/MARS. If you are using C-Shell, you can set
up the path by typing “setenv PATH ${PATH}:/home/usrname/MARS” your c-shell profile
(~usrname/.cshrc). If you are using BASH, type “export PATH=${PATH}:/home/usrname/MARS” in
your bash profile (~usrname/.bashrc). Then, use the “source” command to make the change take effect
immediately (“source ~usrname/.cshrc” for C-Shell user and “source ~usrname/.bashrc” for BASH user).
To test if you have successfully set the MARS software, you can type “MARS” in terminal window. If
you can see the welcome screen shown in Fig. , congratulations, you are able label your medical image
data by MARS.
Fig. 2. Welcome screen of MARS in Linux/Mac.
3. The MARS GUI
The main GUI is shown in Fig. (Windows) and Fig. (Linux). Next, we will illustrate how to use our
software to label ROIs in your data step by step.
3.1 Load the atlases and label maps
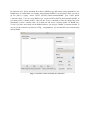
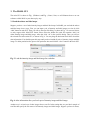
Suppose you have a set of atlas intensity images and their label maps. In MARS, you can load the atlases
and label maps in two ways. First, you can input a pair of intensity and label images at a time by click
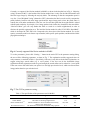
“Add” button in main GUI. Then you will see the open file dialog, as shown in Fig. 3. In current version,
we only support 8-bit ANALYZE format. Please select the header file (with file extension “.hdr”) for
either intensity image and label image. After that, click “ok” in the open file dialog. Then, you will see
the selected files in the main GUI, as shown in Fig. 4. You may drag the horizontal scroll bar to check the
atlas information. You should repeat this steps until you have loaded all pairs of intensity image and label
image. To delete particular atlas, please click particular atlas and click the “clear” button in the main GUI.
Fig. 3. Load the intensity image and label image for each atlas.
Fig. 4. Atlas information after you load a pair of intensity image and label image.
Another way is to load a set of atlas images from a text file. In the testing data, we provided a sample of
text files that specify the file names of all intensity images and label images. Suppose you have 8 atlases,
which include 8 intensity images and 8 label images. As the text file shown below, each line tells the
software the file names of intensity image and label image.
1: /Users/grwu/Projects/MARS/TestData/na02_cbq.hdr /Users/grwu/Projects/MARS/TestData/na02_label.hdr
2: /Users/grwu/Projects/MARS/TestData/na03_cbq.hdr /Users/grwu/Projects/MARS/TestData/na03_label.hdr
3: /Users/grwu/Projects/MARS/TestData/na04_cbq.hdr /Users/grwu/Projects/MARS/TestData/na04_label.hdr
4: /Users/grwu/Projects/MARS/TestData/na05_cbq.hdr /Users/grwu/Projects/MARS/TestData/na05_label.hdr
5: /Users/grwu/Projects/MARS/TestData/na06_cbq.hdr /Users/grwu/Projects/MARS/TestData/na06_label.hdr
6: /Users/grwu/Projects/MARS/TestData/na07_cbq.hdr /Users/grwu/Projects/MARS/TestData/na07_label.hdr
7: /Users/grwu/Projects/MARS/TestData/na08_cbq.hdr /Users/grwu/Projects/MARS/TestData/na08_label.hdr
8: /Users/grwu/Projects/MARS/TestData/na09_cbq.hdr /Users/grwu/Projects/MARS/TestData/na09_label.hdr
Click the “load” button in the main GUI and choose the text file which encodes above atlas
information. After click “ok” button in the load atlas dialog, we will see the atlas information as
shown in Fig. 5.
Fig. 5. Atlas information by loading from the text file.
3.2 Load the target image
The user can load the to-be-labeled target image by click the “…” button in the right side of “Input
Subject” in the main GUI. If the user have the ground truth of target image and want the software to run
the analysis program for quantitative evaluation, please check the “Ground Truth” button and load the
label of target image by click the “…” button beside “Ground Truth”.
3.3 Set the label fusion parameters
Currently, we support 4 label fusion methods in MARS, as shown in the droplist box in Fig. 6. “Majority
voting” (denoted as MV) is the baseline label fusion method since it only uses the label information and
label the target image by following the majority labels. The advantage is that the computation speed is
very fast. “Local Weighted Voting” (denoted as LWV) determines the label at each voxel by compute the
patch similarity between each atlas image patch and the target image patch, where the patch center is
actually the voxel under consideration. Thus, the vote for each atlas patch has the weight which is related
with the patch similarity. In principle, if two image patches look similar, they should bear the same labels.
“Non-local Mean” goes one step further that allow to search in a certain neighborhood, in order to
alleviate the possible registration error. The last label fusion method is called “UNC IDEA SuperMAS”,
which is developed in UNC IDEA lab. Compared to the above three label fusion methods, we use the
sparsity constraint, multi-scale feature representation, label-specific patch partition, and hierarchical label
propagation techniques.
Fig. 6. Currently supported label fusion methods in MARS.
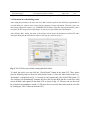
To set the parameters, please click “Setting…” button in the main GUI. In the parameter setting dialog,
the user will the following parameters, as show in Fig. 7. The explanation and the suggested value for
each parameter is conclude in Table 1. Specifically, if the user is only able to do the linear registration, we
suggest using large search radius (e.g. 4 voxel points). If the user can do the deformable image
registration and the registration results are good enough, the search radius can be reduced to 1 voxel point.
If the user want to fast label fusion, one option is to use high pre-selection level, which can discard more
image patches than low pre-selection level.
Fig. 7. The GUI for parameter setting.
Table 1. The specification of the parameters used in MARS.
Name
Meaning
Patch Size2,3,4
Search Radius2,3,4
Patch Normalization2,3,4
The radius of image patch
The radius of searching neighborhood
Indicate whether we need to normalize the intensity
values in each image patch.
The threshold to discard the less similar image patches
Pre-Selection Level2,3,4
Value
Range
1~10
1~10
true, false
Suggested
Value
2
2
true
0~1
0.8
Sigma Value2,3
Sparseness Degree4
2: applicable to LWV
The sigma value in exponential penalty
The strength of sparsity constraint
0.001~0.1
0.001~0.05
0.01
0.01
3: applicable to Nonlocal Mean 4: applicable to UNC IDEA SuperMAS
3.4 Check and save the labeling result
After setting the parameters, the users can click “Run” button to perform the multi-atlas segmentation. It
is worth noting our software does not provide the function of image registration. Therefore, please use
other image registration software (e.g., HAMMER SUITE https://www.nitrc.org/projects/hammer_suite/)
to register all atlas images to the target image, in order to have good label fusion performance.
After clicking “Run” button, the status of label fusion will be shown in the bottom of Main GUI and a
message noticing that the label fusion is done will be pop up, as shown in Fig. 8.
Fig. 8. The GUI after successfully running the label fusion.
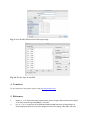
To check the result, user can click the “Check Result” button in the main GUI. Then, please
proceed following steps to check the label fusion result: (1) Save the label fusion result, e.g.,
“Result.hdr”, as displayed in Fig. 9. Currently we only support the 8-bit ANALYSIS format. (2)
The software will automatically compute the Dice ratio in each ROI and the overall Dice ratio
across all ROIs, and reported in the main GUI, as shown in Fig. 10. The user can use the scroll
bar to browse the quantitative results. (3) The user also can save the Dice ratio result in a text file
by clicking the “Save” button in the main GUI.
Fig. 9. Save the label fusion result of the target image.
Fig. 10. The dice ratio in each ROI
4. Contact us
For any questions or bug reports, please email to [email protected].
5. References
1. 2. Aljabar, P., et al., Multi-‐atlas based segmentation of brain images: Atlas selection and its effect on accuracy. NeuroImage, 2009. 46(3): p. 726-‐738. Hsu, Y.-‐Y., et al., Comparison of Automated and Manual MRI Volumetry of Hippocampus in Normal Aging and Dementia. Journal of Magnetic Resonance Imaging, 2002. 16: p. 305-‐310. 3. 4. 5. 6. Liu, J. and J. Ye, Moreau-‐Yosida regularization for grouped tree structure learning, in Advances in Neural Information Processing Systems. 2010. Li, Y., et al., Discriminant analysis of longitudinal cortical thickness changes in Alzheimer's disease using dynamic and network features. Neurobiology of Aging, 2012. 33(415-‐427). Wu, G., et al., Robust Patch-‐Based Multi-‐Atlas Labeling by Joint Sparsity Regularization, in MICCAI Workshop on Sparsity Techniques in Medical Imaging. 2012: Nice, France. Wu, G., et al., A Generative Probability Model of Joint Label Fusion for Multi-‐Atlas Based Brain Segmentation. Medical Image Analysis, 2013. In press.