1
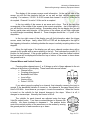
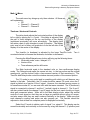
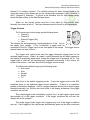
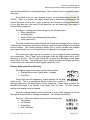
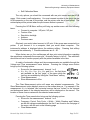
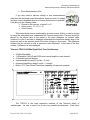
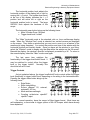
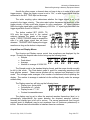
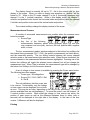
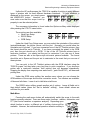
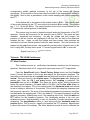
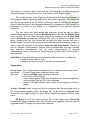
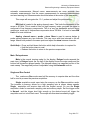
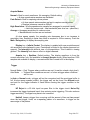
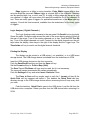
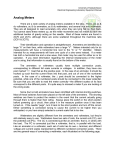
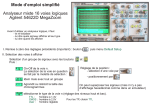
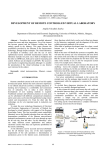
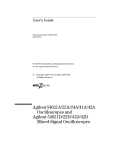
University of Saskatchewan
Electrical Engineering Laboratory Equipment Manual
Digitizing Oscilloscopes (2009)
This document is meant to be a reference to the operation of the digitizing
oscilloscopes available in the laboratories. Major topics will be covered, but not all the
features of the scopes will be outlined here. Refer to the operations manual of the
scope you are using for detailed information. The operations manuals are available
from the technicians in 2C94.
All oscilloscopes, whether analog or digital, have similar operating principles and
similar major controls. Where they mainly differ is in their individual “bells and whistles”.
An oscilloscope is used to display voltage waveforms as a function of time.
These waveforms are usually cyclic in nature, and the oscilloscope performs some
processing on the waveform so that a “stationary” display is shown. There are three
major controls that dictate the way the waveform is displayed: volts/div (vertical)
control, time/div (timebase) control, and the triggering circuitry. The volts/div control
dictates how “big” or how much of the screen the waveform occupies vertically. The
time/div control dictates how many cycles (or fraction of a cycle) of the waveform are
displayed horizontally. The triggering circuitry is used to synchronize the display so that
a stationary waveform is displayed. The display may be triggered by a signal present at
any of the oscilloscope’s input channels.
A short note about triggering and time is necessary at this point. Triggering is
actually a simple operation in principle. For instance, suppose you had a signal
generator set to output a 2 Vp-p sine wave hooked to channel 1 of an oscilloscope and
had the oscilloscope set to trigger off of channel 1, at a level of 0 V, with a positive
slope. This means that every time the input sine wave rises through 0 V, the
oscilloscope will register a new trigger event, and uses that data to synchronize the
waveform on the screen. The time at which the trigger actually occurs is deemed to be t
= 0 by the oscilloscope. Data displayed to the left of the trigger event is called
pretrigger data; to the right, post trigger. The time/div setting controls how many cycles
of the sine wave are actually displayed on screen. In this case, the sine wave s(t) =
sin(!t) V would be displayed. If the trigger level was increased to 500 mV, then s(t) =
sin(!t + "/4) V would be displayed. It’s important to remember that it’s still the same
sine wave, but that it is being displayed with a different t = 0 point.
A digitizing oscilloscope is really just a fancy analog to digital converter (A/D) with
a display. The oscilloscopes in the lab all have 8 bit A/Ds, which means that they can
resolve 256 discrete voltage levels. The levels themselves are dictated by the channel
settings (mainly volts/div). Most scopes have one A/D, and each channel shares it. If
you are examining so-called “fast” or “high speed” signals, turn off all but one channel of
the oscilloscope (if possible) to dedicate the A/D within the scope exclusively to that
signal. Doing so will increase the sampling or resolution of that signal. Each scope also
has a bandwidth rating – either 60 MHz or 100 MHz. This number refers to the
bandwidth of the analog electronics that precede the A/D.
Revised: Sept. 2009, J. Kowalski
Page 1 of 25
University of Saskatchewan
Electrical Engineering Laboratory Equipment Manual
There is one last important point to be made about the digitizing oscilloscopes.
They all have coaxial connectors (known as BNC connectors); they consist of an inner
conductor and an outer conductor, which is connected to ground internal to the scope.
When you connect a scope to your circuit with a BNC-to-alligator clip cable, remember
that the red clip is the signal connection, while black clip is ground. Wherever that black
clip is connected will be grounded!
In terms of functionality, that’s really all there is to the operation of an
oscilloscope. What is more difficult to remember is where the controls are on all of the
different oscilloscopes, and where to find the specialized functions such as the “x vs. y”
display mode. The specifics of each oscilloscope in the lab now follow.
HP 54600A/54601A 100 MHz Digitizing Oscilloscope
•
•
•
•
•
Repetitive Bandwidth – 100 MHz
20 MSample/s 8 bit A/D
2 channel (HP 54600A) / 4 channel (HP 54601A) input and display
Vertical sensitivity range 2 mV/div – 5 V/div
Horizontal sensitivity range 2 ns/div – 5 sec/div
The HP 54601A, is really just a two channel oscilloscope. The two main
channels are channels 1 and 2, with channels 3 and 4 being auxiliary or reduced
performance inputs. Each input has an input impedance of 1 M# in parallel with a
capacitance of $ 13 pF. Each input may tolerate an absolute maximum of 400 V. The
HPIB connector is found on the back left side of the scope.
Revised: Sept. 2009, J. Kowalski
Page 2 of 25
University of Saskatchewan
Electrical Engineering Laboratory Equipment Manual
The display of this scope conveys much information. At the top left side of the
screen you will find the channels that are on, as well as their volts/div setting and
coupling. For instance, 1 2.00V 2 P5.00V means that channel 1 is set to 2 V/div and is
dc coupled. Channel 2 is set to 5 V/div and is ac coupled.
In the top middle of the screen is an arrow and a time. That is the time that
corresponds to the middle of the screen in the current acquisition. Just to the right of it
you will find the current time/div setting. Somewhere along the top display line you will
find an upside down solid triangle. At the bottom of the screen you will find a right-side
up solid triangle immediately beneath it. These triangles denote the t = 0 point of the
acquisition.
In the top right corner of the display you will find information about the trigger
source, mode, and slope. Lastly, either RUN or STOP will be displayed to the right of
the triggering information, indicating whether the scope is actively acquiring data or has
stopped.
Along the right edge of the display you will see a channel number along with a
ground circuit symbol with an arrow pointing to the left. That indicates the ground (0 V)
position for that channel. If the ground position is off screen, then the channel number
and an arrow will be displayed at either the top or bottom of the screen to show where
the ground level is.
Channel Menus and Vertical Controls
Pressing either channel menu (1 or 2) brings up a list of items adjacent to the six
softkeys at the bottom of the display. These menu items are as follows:
• Channel off/on
• Coupling dc/ac/ground
• Bandwidth limit off/on
• Invert off/on
• Vernier off/on
• Probe 1/10/100
If you select ground coupling for a channel, that internally connects the input to
ground. If the bandwidth limitation is turned on, the channel is low-pass filtered with a
cutoff of 20 MHz. Invert does as you expect – inverts the waveform. When the Vernier
is turned on, the volts/div for that channel changes in fine steps. When it is off, it
changes in coarse steps. Normally the Vernier is left off.
The volts/div for each channel are adjusted using the large
Volts/Div adjust knobs. Turn them counterclockwise to increase the
volts/div; turn them clockwise to decrease it. The position knobs
control the vertical position of the waveforms on the screen by moving
the ground position of each waveform up or down.
Revised: Sept. 2009, J. Kowalski
Page 3 of 25
University of Saskatchewan
Electrical Engineering Laboratory Equipment Manual
Math (±) Menu
The math menu key brings up only three choices. All three are
self-explanatory:
• Off
• Channel 1 + Channel 2
• Channel 1 – Channel 2
Timebase / Horizontal Controls
The delay knob adjusts the horizontal position of the display
left or right by moving the t = 0 point. If the delay is adjusted, then
the pair of solid triangles at the top and bottom of the display
(mentioned previously) will move accordingly. The display point
will retain a pair of open triangles to mark its position. The display
point may be set to either one graticule in from the left side of the
display or to the center of the display.
The time/div (or timebase) is adjusted by the large Time/Div knob.
counterclockwise to increase the timebase, clockwise to decrease it.
Turn it
Pressing the Main/Delayed menu button will bring up the following items:
• Horizontal mode: main / delayed / XY
• Vernier off/on
• Time reference position left/center
The Main horizontal mode is the standard volts vs. time oscilloscope display
mode. The Delayed mode splits the screen into two; in the top portion are the original
waveform(s), and the bottom holds a time-zoomed version of that waveform(s). The
Time/Div and Delay knobs control the window size and position of the zoomed portion.
The XY mode is very useful and is something with which you will become very
familiar in the labs. Technically, the XY mode should be named YX mode, since the Y
signal is plotted as a function of the X signal. However, the standard among scopes is
to name these modes XY, so we must stick with that same standard. The X (horizontal)
signal is connected to channel 1 and the Y (vertical) signal to channel 2. The X and Y
are also printed beside the channel 1 and 2 inputs on the front panel should you forget
what gets connected where. While still in the Main display mode, adjust the vertical
controls of each signal so that they are as large as possible without going off screen,
and also ensure that they are each centered vertically in the display. Make sure that
each channel’s coupling and probe are also properly set. The time/div should be
adjusted so that at least one complete period is displayed horizontally.
Select the XY mode to obtain a plot of signal Y vs. signal X. This display can be
moved horizontally and vertically on the screen by using the channel 1 (X position) and
Revised: Sept. 2009, J. Kowalski
Page 4 of 25
University of Saskatchewan
Electrical Engineering Laboratory Equipment Manual
channel 2 (Y position) controls. The volts/div settings for each channel found in the
upper left corner of the display tell you the voltage scale readings in the X (channel 1)
and Y (channel 2) directions. To return to the standard volts vs. time display mode,
select the Main softkey in the Main/Delayed menu.
When on, the Vernier control acts like a fine adjust for the time/div knob.
Normally this control is left off. The time reference position control is self-explanatory.
Trigger Controls
The Source menu button brings up the following items:
• Channel 1
• Channel 2
• External Trigger (Ext)
• Line
The choices are self explanatory, except perhaps for “Line”. Line is
the supply (line) voltage. If Ext is selected, a signal must be
connected to the Ext Trigger input on the front panel of the scope. The trigger source
channel does not have to be on.
The trigger level control knob sets the trigger threshold voltage level for the
selected trigger source. When it is rotated, a solid horizontal line will briefly appear on
the display to graphically depict what voltage the trigger level is presently set to. The
trigger level in volts will be simultaneously displayed momentarily in the bottom left
corner of the screen; it will also show both the trigger source as well.
The Mode menu button brings up the following items:
• Auto Level
• Auto
• Normal
• Single
• TV
Auto level is the default triggering mode. It sets the trigger point to the 50%
amplitude point on the selected trigger source waveform. If there is no waveform
present, a baseline is displayed. Auto is a trigger mode that allows you to set the trigger
threshold manually, but, like the auto level mode, it will display a baseline if the trigger
conditions are not met.
The normal trigger mode will display a signal only if a valid trigger signal exists
that satisfies all of the trigger conditions. If the trigger conditions are not met, the
display will not be updated.
The single trigger mode (single shot) triggers only once if the trigger conditions
are met. Once triggered, the oscilloscope automatically goes into the stop mode and
Revised: Sept. 2009, J. Kowalski
Page 5 of 25
University of Saskatchewan
Electrical Engineering Laboratory Equipment Manual
must be rearmed before it will reacquire data. The run button must be pressed to rearm
the scope.
The holdoff knob is a very important control, as was stated earlier for the HP
54501A. When it is rotated, the trigger holdoff time is momentarily displayed at the
bottom left corner of the screen. Again, a general rule of thumb is to set the holdoff time
to be a little less than one period of the waveform you are examining if the scope is
having difficulty triggering.
The Slope / Coupling menu button brings up the following items:
• Slope rising/falling
• Coupling ac/dc
• Reject off/lf/hf (low frequency/high frequency)
• Noise reject off/on
The slope rise/fall item selects whether the scope should trigger off of a rising or
a falling edge that passes through the selected trigger threshold voltage on the trigger
source channel. The coupling selection allows you to choose whether the selected
input signal should be ac or dc coupled before it is passed to the trigger circuitry.
The reject/noise reject options are present to aid in triggering when examining
noisy waveforms. The LF reject option high pass filters the trigger signal with a cutoff
frequency of 50 kHz. The HF reject option will low pass filter the trigger signal, again
with a cutoff of 50 kHz. The Noise reject option simply decreases the trigger sensitivity
to help reduce the occurrence of false triggers caused by noise.
Display, Measurements and Printing
The Display menu button brings up the following items:
• Display Mode normal / peak detect / average
• Grid off/on
These items are self-explanatory, except perhaps for the peak
detect mode. This is a specialized display mode that is useful in
identifying glitches in the waveform(s) you are examining. These signal extremes are
identified and saved if the time/div is set longer than 50 µs/div. At lower time/div
settings, this display mode is disabled.
When the average display mode is selected, a new softkey selection to choose
the number of waveforms to average is displayed. The choices are 8/64/256.
The Print / Utility menu button brings up the following items:
• Print Screen
• HP-IB Menu
• Clear Menu
• Self Test Menu
Revised: Sept. 2009, J. Kowalski
Page 6 of 25
University of Saskatchewan
Electrical Engineering Laboratory Equipment Manual
•
Self Calibration Menu
The only options you should be concerned with are print screen and the HP-IB
menu. Print screen is self-explanatory. You must connect a printer to the scope via the
HPIB connector on the rear of the scope, and the printer must be on and online. The
entire display will be printed when the print screen button is pressed.
Pressing the HP-IB Menu softkey will bring up another menu with the following
items:
•
•
•
•
•
Connect to computer / HP print / HP plot
Factors off/on
Resolution low/high
Address
Previous menu
Obviously you would select connect to HP print if the scope was connected to a
printer. If you connect it to a computer, then you would select computer. The
instrument’s address is displayed above the address softkey. Pressing that softkey
increments the address by 1. Possible addresses are 0 – 30.
When factors are on, the oscilloscope will also print extra information regarding
the waveforms underneath the screen plot. Normally factors is left off. The resolution
should be set low to function properly with the printers available in the labs.
A variety of automatic voltage and time measurements are available through the
Voltage and Time measurement menu buttons. Pressing the Voltage menu button
brings up the following options:
• Source for the measurement: channel 1 or 2
• Vp-p, Vavg, Vrms, Vmax, Vmin, Vtop, and Vbase; the first three
are available on the first “page” of the menu while the
last four are available by hitting the “Next Menu” softkey
• Clear Measurement
• Show Measurement off/on
The Clear Measurement option will erase any selected measurements. The
Show Measurement option displays cursors on the screen when on. For example, if the
measurement Vp-p is selected, two horizontal cursors that are “locked” to the topmost
and bottommost parts of the selected waveform will be displayed on the screen. The
location of these cursors varies with the selected measurement.
Pressing the Time menu button brings up the following options:
• Source for the measurement: channel 1 or 2
• Frequency, Period, Duty Cycle, + Width, - Width, Risetime and Falltime;
as with the voltage measurements, the first 3 are found on the first page of
the menu, with the rest on the following page
• Clear Measurement
Revised: Sept. 2009, J. Kowalski
Page 7 of 25
University of Saskatchewan
Electrical Engineering Laboratory Equipment Manual
•
Show Measurement off/on
If you ever need to perform voltage or time measurements
other than the automatic ones listed above, there are a set of voltage
and time cursors available when the Cursors menu button is pressed.
It will bring up the following items:
• Source for the cursors: channel 1 or 2
• Active cursor: V1, V2, t1, t2
• Clear Cursors
When a particular cursor is selected by an active cursor softkey, it may be moved
by using the unmarked knob underneath the Cursors menu button. Cursors should be
placed on the scope trace at the centre of the trace thickness. Its present value
(location) in volts or seconds is displayed underneath the waveform display area of the
screen as well as the present value of the other voltage or time cursor. The difference
between the two cursors in volts or seconds is also displayed. In the case of the time
cursors, 1/difference is also displayed.
Tektronix TDS210 60 MHz Digital Real-Time Oscilloscope
•
•
•
•
•
•
60 MHz Bandwidth
1 GSample/s 8 bit A/D with 2500 point record length for each channel
2 Channel input and display
Vertical sensitivity range 2 mV/div – 5 V/div
Horizontal sensitivity range 5 ns/div – 5 sec/div
Built-in FFT (Fast Fourier Transform) capability for spectrum analysis
The TDS210 is the least expensive member of the Tektronix family of
oscilloscopes. Its size is small, but it has very powerful performance. Each input
Revised: Sept. 2009, J. Kowalski
Page 8 of 25
University of Saskatchewan
Electrical Engineering Laboratory Equipment Manual
channel has an input impedance of 1 M# in parallel with a capacitance of $ 20 pF.
Each input may tolerate an absolute maximum of 300 Vrms.
Like the HP 54600A/601A, the TDS210’s display conveys a lot of information. In
the top left corner of the display is the Tek logo. To the right of that you will find a
picture of a square pulse. This gives a graphical cue to the scope’s acquisition mode.
Each mode has its own unique picture of a pulse. Continuing to move to the right you
will find a status indicator. If the scope is in the run mode, a square with an “R” inside of
it will be displayed. Beside that is a status word relating to the trigger status of the
scope. Usually “Ready” or “Auto” will be displayed here. If the scope is stopped, a solid
octagon (stop sign) along with “Stop” will be displayed. The next bit of information that
you find along the top of the display is the middle graticule time readout. It displays the
time to which the middle graticule corresponds. The t = 0 position is indicated by the
upside down solid arrow at the top of the display.
At the bottom left corner of the display is a readout of the status of the input
channels. It indicates what channel(s) are on, and what their volts/div settings are. To
the right of this information you will find the main time/div setting, preceded by an M.
Finally, in the bottom right corner is information regarding the trigger source, trigger
slope, and trigger level.
At the left side of the display you will see the channel number (1 or 2) and an
arrow pointing to the right. This indicates the ground (0 V) position for that channel. At
the right side of the display you will see another arrow pointing to the left. This arrow
graphically indicates the current trigger level.
Channel Menus and Vertical Controls
Pressing either channel menu (1 or 2) brings up a list of items adjacent to the five
softkeys at the right of the display. These menu items are as
follows:
• Coupling dc/ac/ground
• Bandwidth limit off (60 MHz) / on (20 MHz)
• Volts/div coarse/fine
• Probe 1X/10X/100X/1000X
• Invert off/on
The volts/div for each channel are adjusted by using the large VOLTS/DIV adjust
knobs. The vertical position of the waveforms on the screen are adjusted with the small
position knobs.
To turn a channel on/off, simply repeatedly press its channel menu button.
Timebase / Horizontal Controls
Revised: Sept. 2009, J. Kowalski
Page 9 of 25
University of Saskatchewan
Electrical Engineering Laboratory Equipment Manual
The horizontal position knob adjusts the
horizontal position of the display left or right by
moving the t = 0 point. The upside down arrow
at the top of the display indicates the t = 0
position and will move left or right as the
horizontal position knob is turned. The large
SEC/DIV knob adjusts the timebase of the
scope.
The horizontal menu button brings up the following items:
• Main / Window Zone / Window
• Trigger knob level / holdoff
The “Main” horizontal mode is the standard volts vs. time oscilloscope display
mode. When the “Window Zone” mode is selected, two vertical cursors are displayed
on the screen. They define a window that you can use to zoom in on a feature of the
waveform(s) being examined. You control the position and size of the window with the
horizontal position and time/div knobs. Once you have set the window to your liking,
select the “Window” mode to display only the data within the window on the full screen.
Beneath the display, the window’s time/div is displayed, preceded by a W. To return to
the normal display, select the “Main” mode once again.
The last menu item switches the
functionality of the trigger level/holdoff knob. It
may be switched to control either the trigger
level or the trigger holdoff. Normally this
should be left set to level.
Trigger Controls
As just explained above, the trigger level/holdoff knob controls either the trigger
level (threshold) or trigger holdoff time, depending on its setting in the horizontal menu.
Pressing the trigger menu button brings up the
following items:
• Edge/Video
• Slope rising/falling
• Source channel 1/2, external,
external/5, AC line
• Mode auto/normal/single
• Coupling ac/dc/noise reject/HF
reject/LF reject
For normal operation, leave the scope in Edge trigger format. Most items are
self-explanatory, or are similar to trigger options of the HP scopes, which have already
been explained.
Revised: Sept. 2009, J. Kowalski
Page 10 of 25
University of Saskatchewan
Electrical Engineering Laboratory Equipment Manual
As with the other scopes, a channel does not have to be on in order to be a valid
trigger source. When the trigger source is set to “Ext”, a valid trigger signal must be
connected to the EXT TRIG input on the scope.
The ac/dc coupling option determines whether the trigger signal is ac or dc
coupled to the trigger circuitry. The noise reject option decreases the sensitivity of the
trigger circuitry to help avoid false triggers on noisy waveforms. HF reject low-pass
filters the trigger signal with a cutoff frequency of 80 kHz. LF reject high-pass filters the
trigger signal with a cutoff of 300 kHz.
The button marked SET LEVEL TO
50% sets the trigger level to the vertical
midpoint between the peaks of the trigger
signal. FORCE TRIGGER starts an acquisition
even if a valid trigger signal has not been
detected. TRIGGER VIEW displays the trigger
waveform as long as the button is depressed.
Acquisition and Display Menus
The Acquire and Display menus control how waveforms are displayed by the
scope. Pressing the Acquire menu button brings up the following items:
• Sample
• Peak detect
• Average
• Number to average: 4/16/64/128
The Sample mode is the standard display format, and the scope should normally
be left in this mode. The Peak detect mode is useful for examining waveforms that
have glitches present. These narrow glitches will be captured and displayed in this
mode. The average mode averages a set number of waveforms before updating the
display. The number to average is selected via the softkey directly under the average
mode softkey.
The Display menu key will bring up the following items:
• Display type: vectors/dots
• Persistence off – infinite
• Display format: YT / XY
• Contrast increase/decrease
The display may be set to either the acquired samples themselves (dots) or to
automatically interpolate/fill the space between the acquired samples (vectors).
Normally the display type is left set to vectors. The screen persistence (how long an
acquired point is displayed) may be set anywhere from off (minimum persistence) to
infinite. Several times are selectable in-between these two extremes.
Revised: Sept. 2009, J. Kowalski
Page 11 of 25
University of Saskatchewan
Electrical Engineering Laboratory Equipment Manual
The display format is normally left set to YT; this is the normal volts vs. time
display of the scope. When you wish to display one waveform vs. another, set the
format to XY. When in the XY mode, channel 1 is the X (horizontal) waveform, and
channel 2 is the Y (vertical) waveform. While in this display mode, the channel 1
volts/div and position knobs control the horizontal scale and position, while the channel
2 volts/div and position knobs control the vertical scale and position.
The contrast softkeys change the display contrast of the scope.
Measurements and Cursors
A number of automated measurements are possible when the measure menu
button is pressed:
• Source/Type
• Any four of the following
measurements: frequency, period, mean (average), pk-pk, cyc rms (true
rms computed over one cycle), rise time, fall time, positive width, negative
width, or none
The four measurement readout windows adjacent to the bottom four softkeys list
the channel being measured (CH1 / CH2), the specific measurement (as listed above),
and the measured quantity. The top softkey selects between the source channel
selection mode or the measurement type selection mode. When Source is selected, the
source channels in the measurement windows become highlighted. Pressing one of the
bottom four softkeys will toggle the selected source channel, but will not change the
measurement type. When Type is selected, the measurement type will be changed by
the bottom four softkeys, but not the source channel.
A set of voltage or time cursors is available by pressing the Cursor menu button.
The following items then appear:
• Cursor type: off/voltage/time
• Source CH1 / CH2 / MATH / Ref
A / Ref B
The only deficiency that this scope has
is its cursors. Unfortunately, only the voltage
or time cursors can be displayed, but not both
at once. This may be an issue, depending on the lab you are performing. The menu
choices available here are self-explanatory. To move the cursors, use the channel 1 &
2 vertical position controls. When either the voltage or time cursors are active, the
position of each cursor as well as the difference between them (in either volts or
seconds) will be displayed at the right side of the display. In the case of the time
cursors, 1/difference will also be displayed.
Printing
Revised: Sept. 2009, J. Kowalski
Page 12 of 25
University of Saskatchewan
Electrical Engineering Laboratory Equipment Manual
Unlike the HP oscilloscopes, the TDS210 is capable of printing to many different
types of printers with its three different hardware interfaces. To print whatever is
displayed on the screen, you simply press
the HARDCOPY button. However, you
must make sure that the scope is set up
properly to use the selected printer.
The necessary information is found under the Options softkey menu displayed
after pressing the UTILITY menu button.
Three options are then available:
• Hard Copy Setup
• RS232 Setup
• GPIB Setup
Under the Hard Copy Setup menu, you may select the orientation of the printout
(portrait/landscape), the printer format, and the port. Normally you would leave the
orientation set to portrait. If you have connected one of the HP ThinkJet printers, then
the format should be set to ThinkJet. If you have connected the printer to the GPIB
port, then the port should set to GPIB. A few of the HP ThinkJet printers have a
centronics interface; you should set the port to centronics if you use one of these
printers. There are also a few Epson-style dot matrix printers available. The format
should be set to Epson and the port set to centronics in the event that you use one of
these printers.
You can print to the HP ThinkJet printers with the GPIB interface using the
TDS210 scopes, but they take a very long time to print a waveform. If you choose a
printer with a centronics interface, then printing time will decrease dramatically.
Stopping the display from acquiring new wave forms, ( push Run/STOP ), will decrease
printing time.
Under the GPIB setup softkey lies another menu where you can choose the
GPIB address of the scope and the bus connection mode. Two choices are available:
off-bus and talk-listen. Leave it set to talk-listen at all times.
The RS232 setup softkey reveals another set of options. Leave all fields set to
their default values (press the “Set to defaults” softkey); these default values are
sufficient for your needs.
Math Menu
Pressing the math menu button will automatically switch the scope to the math
function currently selected. There are three major functions: addition, subtraction, and
FFT (fast fourier transform or spectrum analysis). Depending upon
which function is active, a different set of softkey choices will be
available. However, the mathematical operation selection softkey is
Revised: Sept. 2009, J. Kowalski
Page 13 of 25
University of Saskatchewan
Electrical Engineering Laboratory Equipment Manual
the first available choice for all three. In the case of addition, no further choices are
available—only CH1 + CH2. For subtraction, there are two choices, CH1 – CH2 or CH2
– CH1. To turn the math function off, simply press the math menu button again.
Only the basic instructions regarding the FFT will be presented here. For more
information, consult the TDS200-Series Extension Modules manual.
The fast fourier transform is a mathematical function that takes a set of discrete
numbers as its input. In this case, those numbers are the discrete sampled points of the
input waveform. The FFT requires that the number of samples it receives be a power of
2. The oscilloscope captures 2500 points per waveform, but only the middle 2048 are
used to perform the FFT.
Before you perform an FFT on a waveform, be sure that it is vertically centered in
the display and is as large as possible without clipping (or going off-screen). Also make
sure that several cycles of the waveform are displayed. Now turn on the FFT by
pressing the Math menu button, and selecting the FFT operation. You may select the
channel on which to perform the FFT (CH1 or CH2), the window type to apply to the
data, and the FFT zoom level.
There are three window types that you may choose: Rectangular, Hanning, and
Flattop. Without delving into the underlying theory, the following table summarizes the
characteristics of each window type:
Window
Hanning
Measure
Periodic waveforms
Flattop
Periodic waveforms
Rectangular
Pulses or transients
Characteristics
Better frequency, poorer magnitude accuracy
than Flattop
Better magnitude, poorer frequency accuracy
than Hanning
Special purpose window for waveforms that do
not have discontinuities (same as no window)
The FFT zoom level (X1 / X2 / X5 / X10) changes the horizontal magnification of
the FFT display.
The FFT display is calibrated in dBV (decibels referenced to one volt rms). The
level of a signal in dBV is given by the following formula:
Signal Level (dBV) = 20 log (Vrms/1 V)
Where Vrms is the rms voltage of the signal.
The oscilloscope display changes slightly when the FFT function is active. At the
top of the screen is a readout that displays the frequency corresponding to the middle
graticule. The upside-down arrow at the top of the screen indicates the position of this
frequency. The horizontal position knob moves the display left or right, and the
Revised: Sept. 2009, J. Kowalski
Page 14 of 25
University of Saskatchewan
Electrical Engineering Laboratory Equipment Manual
corresponding middle graticule frequency at the top of the screen will change
accordingly. At the bottom of the screen near the middle is the frequency/div setting of
the display. Next to that, in parenthesis, is the current sampling rate used in computing
the FFT.
At the bottom left of the screen is the vertical scale in dB/div. The volts/div knob
of the source channel for the FFT now controls the vertical dB/div setting. The choices
are 1, 2, 5, 10 and 20 dB/div. The vertical position knob of the source channel for the
FFT controls the vertical position of the display.
The cursors may be used to determine signal levels and frequencies of the FFT
spectrum. Ensure that the source for the cursors is set to MATH. Two types are then
available: magnitude and frequency. As with the voltage and time cursors, the
positions of the two cursors are displayed (in dB and Hz), as well as the difference
between the two. Again, as with the voltage and time cursors, their positions are
controlled by the two vertical position knobs for each channel. Don’t be fooled by the
readout for the magnitude cursors: the scope tells you the position of each cursor in dB,
but it’s really dBV, so keep that in mind. To convert signal levels in dBV to rms volts,
Signal Level (Vrms) = 10(Signal level (dBV)/20)
Tektronix TDS 3012B Oscilloscope
FFT Math Function
This function converts an oscilloscope time-domain waveform into its frequency
spectrum. Waveforms with a D.C. component may cause errors in FFT magnitudes.
Push the Save/Recall button, Recall Factory Setup button and the Confirm
button. Connect the source to the scope and display the time-domain waveform. The
acquisition mode should be set to sample and the horizontal resolution should be set to
normal. These are found in the Acquire menu. The Acquire menu also displays the
sample rate. Push the CH 1 and menu buttons. AC coupling is preferred. The
bandwidth can be set to 20 MHz. This filters the source signal, limiting frequencies
below the nyquist frequency. Full band width is 150 MHz. Use the fine scale button so
the waveform uses approx. 95% of the vertical scale. The horizontal scale knob should
be set to display a minimum of five periods. This controls the sampling frequency and
the frequency resolution. The more cycles displayed increases the frequency resolution
and decreases the sampling rate. This is the trade off. The nyquist frequency is half the
sampling frequency. Aliasing may occur if the sampling rate is low. Push the math and
FFT buttons for the frequency spectrum. The rectangular window is the only nonwindowing function. Non-windowing is used for transients. Periodic waveforms require
windowing. The magnification button is used along with the horizontal scale and
position knobs. This is used to magnify and position the FFT spectrum. Magnification
is about the center of the display. The entire waveform record is used to calculate the
Revised: Sept. 2009, J. Kowalski
Page 15 of 25
University of Saskatchewan
Electrical Engineering Laboratory Equipment Manual
FFT spectrum. Magnification increases display resolution only. The FFT spectrum is not
recalculated. Recall the factory setup before a new FFT spectrum is calculated.
Examples:
1GS/s = sample rate for display
Nyquist = 1GHz / 2 = 500 MHz BW
500 MHz / 10 div = 50 MHz / div
freq. resolution = 50 MHz / 50 = 1 MHz.
50 MS/s = sample rate for display.
Nyquist = 50 MHz / 2 = 25 MHz BW
25 MHz / 10 div = 2.5 MHz / div
freq. resolution = 2.5 MHz / 50 = 50 kHz
If I want a 100 KHz BW which is 10 KHz / div.
100 KHZ (nyquist) X 2 = 200 KHz sample rate
nearest higher sample rate 250 KS/s
Nyquist = 250 KHz / 2 = 125 KHz BW
125 MHz / 10 div = 12.5 KHz / div
freq. resolution = 12.5 kHz / 50 = 250 Hz.
Agilent 54621D Mixed – Signal Oscilloscope
The 54621D is a combination oscilloscope and logic analyzer. The digital section
on the front panel is the logic analyzer part of the unit. The analog section on the front
panel is the oscilloscope part of the unit. The oscilloscope section is labeled analog and
refers to the type of input signal. This is actually a digital oscilloscope with a cathode ray
tube display. The oscilloscope has a band width of 60 MHz and a maximum sampling
speed of 200 M Sa/s ( 200 Mega samples/second or a sampling frequency of 200 MHz).
Sampling Speeds: 200 M Sa/s – 1 channel or 1 pod.
100 M Sa/s – 2 channels or 2 pods or 1 channel and 1 pod.
Measurements should be done with unused channels and pods turned off. The pods are
used with the logic analyzer part of the unit.
Deep memory oscilloscopes can capture a long time event at a high sampling
rate. This allows a user to see fast details in a long event.
Memory Depth: 2 MB for each analog channel.
4 MB for a single analog channel in single mode.
4 MB for each digital channel using 2 pods.
8 MB for each digital channel using 1 pod.
Revised: Sept. 2009, J. Kowalski
Page 16 of 25
University of Saskatchewan
Electrical Engineering Laboratory Equipment Manual
The memory is divided in half in the run mode. This allows an acquisition of a record
and a processing of the previous record. This results in a fast display update.
The introduction part of the Digitizing Oscilloscopes and the Logic Analyzers in
the Equipment Manual should be reviewed for basic theory operation. The controls for
the 54621D are similar to the HP 54601 oscilloscope and HP 54620A logic analyzer.
Refer to these sections in the Equipment Manual for an explanation of the controls. An
explanation of controls in this section is a supplement to the previous sections
mentioned.
This unit, along with other scopes and analyzers, should be reset to factory
default settings before using. Press the Save/Recall button and then the Default Setup
button to reset. This unit, along with other scopes and analyzers, has an Auto-Scale
button. Auto-Scale automatically configures the scope to display the signals at its
inputs. Students that use this function will not learn the basic controls and how to
display signals. The auto scale function can be misleading when displaying a signal. In
order to learn the operation of equipment, avoid the Auto-Scale button. These units
also do automatic measurements. Manual cursor measurements are more accurate
then automatic measurements. Use the cursor measurements for accurate
measurements and as a learning tool. Measurements should be taken at the center of
the trace width.
Quick Help > Press and hold down the button which help information is required for.
> Hold the button down to read.
> Release the button to return to the previous scope state.
Trigger Mode
Normal Mode > Only Triggers when conditions are met ( transition or/and a logic level).
Auto Mode > Forces a trigger when conditions are not met.
Auto level
> Works with Edge trigger (analog or external).
> First it tries a normal trigger.
> If no normal trigger is found, then it searches for a transition signal and
sets the trigger level at 50% of the magnitude.
> If there is no signal transition, then it does an auto trigger and forces a
trigger.
In Auto or Normal mode, a trigger will not be recognized until the pre-trigger buffer is
full. At slow sweep speeds (ms/div), the trigger may not be found. Use Normal mode
and wait for the trigger indicator to flash before causing the trigger condition in the
circuit.
HF Reject is a 50 kHz input low pass filter to the trigger circuit. Noise Rej
increases the trigger hysteresis band, thus reducing noise triggering. This also reduces
trigger sensitivity. The signal may have to be increased.
Revised: Sept. 2009, J. Kowalski
Page 17 of 25
University of Saskatchewan
Electrical Engineering Laboratory Equipment Manual
Holdoff keeps a trigger from occurring until the amount of time set has passed
since the last trigger. Used, on a repeating pattern of a waveform, to trigger on the
same edge of the pattern.
Edge triggers on a falling or rising transition. Pulse Width triggers after a time
set pulse width has occurred. Pattern trigger is a logical AND of the channels. Channels
can be specified high, low, or don’t care (X). A rising or falling edge can be set for only
one channel. A trigger will occur when the specified conditions for all the channels is
true.
Acquire Waveform
In Peak Detection mode signals longer then 5 nS will be displayed at any
time/div speed. This mode can be used at time/div speeds slower then 1 mS/div. It has
no effect at higher speeds as the scope will display 5 nS peaks in normal acquisition
mode. Digital channels always have peak detection on.
In Realtime mode the waveform produced is from samples during one trigger
event. A reconstructive filter is used to fill in, the waveform displayed, when less than
1000 samples are available in the time span of the display. At sweep speeds of 200
nS/div and faster, less then 1000 samples are available on each trigger. Realtime mode
is only necessary at these sweep speeds. Realtime is used to capture infrequent
events or a changing waveform. The waveform displayed, with Realtime off, is
constructed from multiple triggers.
Averaging reduces noise. The scope responds slowly, to changes, with
averaging on. Turn averaging off when adjusting the scope or changing signals. High
Resolution mode ( averages = 1) is used when the sampling rate is faster then the rate
at which the samples are being stored. Samples are averaged together for each display
point with this mode. The slower the time/div speed the greater the samples averaged.
Bit resolution will be increased at slower sweep speeds with High Resolution.
Single acquisition stores at least twice the number of samples then the Run
mode. Higher sampling rates occur at slower sweep speeds due to a larger memory
available in Single mode.
Horizontal
Measurements and functions are performed on display data. The resolution of
measurements and functions are affected by the resolution of the display. Time/div and
volts/div affect the resolution of the display. Always use the max. volts/div and sweep
speed (time/div) that fits on the display.
The Delayed sweep window is used to expand the waveform ( zoom ). The
Delayed window shows a portion of the main sweep. The display is divided in two,
Revised: Sept. 2009, J. Kowalski
Page 18 of 25
University of Saskatchewan
Electrical Engineering Laboratory Equipment Manual
showing the main and expanded portion. Peak Detection acquisition mode provides
more detail when expanding the waveform.
The XY mode changes the scope from voltage versus time to voltage (y, Ch2)
versus voltage (x, Ch1).
Printing the Display
The 54621D mixed signal scope can not print to the Think Jet printers or
Scopecam. The display can be saved to the front 3.5” floppy drive. The floppies are
available from the Technicians in 2C94.
Push Utility and then the Print Confg soft key.
Push soft key Print to: Disk.
Push soft key Format BMP image.
Soft key Factors: set to off.
The scope is now set to print to disk.
Push the hard key Quick Print to save to disk. Load the file from the floppy into
a computer. Delete your files from the floppy before returning it to 2C94.
Agilent MSO6014A Mixed Signal Oscilloscope
The 6014A is a combination oscilloscope and logic analyzer. The digital section
on the front panel is the logic analyzer part of the unit. The analog section on the front
panel is the oscilloscope part of the unit. The oscilloscope section is labeled analog and
refers to the type of input signal. The oscilloscope has a band width of 100 MHz and a
maximum sampling speed of 2 G Sa/s ( 2 Giga samples/second or a sampling
frequency of 2 GHz).
The introduction part of the Digitizing Oscilloscopes and the Logic Analyzers in
the Equipment Manual should be reviewed for basic theory operation. The controls for
the 6014A are similar to the HP 54601 oscilloscope and HP 54620A logic analyzer.
Refer to these sections in the Equipment Manual for an explanation of the operation and
the controls. This section is a supplement to the previous sections mentioned.
This unit, along with other scopes and analyzers, should be reset to factory default
settings before using. Press the Save/Recall button and then the Default Setup button
to reset. This unit, along with other scopes and analyzers, has an Auto-Scale button.
Auto-Scale automatically configures the scope to display the signals at its inputs.
Students that use this function will not learn the basic controls and how to display
signals. The auto scale function can be misleading when displaying a signal. In order to
learn the operation of equipment, avoid the Auto-Scale button. These units also do
Revised: Sept. 2009, J. Kowalski
Page 19 of 25
University of Saskatchewan
Electrical Engineering Laboratory Equipment Manual
automatic measurements. Manual cursor measurements are more accurate then
automatic measurements. Use the cursor measurements for accurate measurements
and as a learning tool. Measurements should be taken at the center of the trace width.
This scope will recognize the 10:1 probes and adjust the probe setting.
BW Limit is located in the analog channel menu. This limits the bandwidth of the
scope to 20 MHz. This is used to filter out high frequency noise, provided the signal is
composed of low frequency components. This is a very low bandwidth and will distort
waveforms, made up of frequencies components above 20 MHz. It is best to leave BW
Limit off in most situations.
Analog channel menu > probe > skew. Skew is used to remove delays in
probe cables between any two channels. This can occur with time intervals in the nS
range. Attach both probes to the same point and adjust the skew between channels.
Quick Help > Press and hold down the button which help information is required for.
> Hold the button down to read.
> Release the button to return to the previous scope state.
Main / Delayed menu
Main is the normal viewing mode for the display. Delayed mode expands the
main view. In Delayed mode the top half of the display shows the main sweep and the
bottom half shows the delayed sweep. The delayed sweep is a magnified portion of the
main sweep. The magnified portion is adjustable using the Horizontal controls.
Single and Run Control
The continuous Run mode uses half the memory to acquire data and the other
half is used to process the previous acquisition.
Single acquisition mode uses twice the memory as the Run acquisition mode.
The increase in memory allows for a high sampling rate at slower sweep speeds.
Single acquisition will acquire data with the longest record. So use the Single
acquisition mode for maximum sampling rate and memory depth. Set the trigger mode
to Normal and the trigger level high enough so the desired event will trigger the
acquisition and not a low level event. The scope will otherwise immediately trigger.
Revised: Sept. 2009, J. Kowalski
Page 20 of 25
University of Saskatchewan
Electrical Engineering Laboratory Equipment Manual
Acquire Modes
Normal > Best for most waveforms. No averaging. Default setting.
> At slow speeds extra samples are discarded.
Peak Detect > Best for capturing narrow pulses.
> At slow speeds extra samples are kept to capture narrow pulses.
> Displays pulses as narrow as 500 pS.
High Resolution > At slow speeds extra samples are averaged to produce a point.
> Limits the scopes real – time bandwidth (acts as a low – pass filter).
Average > Averages acquisitions to reduces noise.
> Bandwidth and rise time are not reduced.
At slow sweep speeds, the sampling rate decreases due to an increase in
acquisition time. Sampling is faster then what is required to fill the memory. Push the
Main / Delayed key to display the sampling rate.
Display key > Infinite Persist. The display is updated with new acquisitions and
old acquisitions are displayed in gray. Persistence is limited to the display area and not
memory. The Intensity knob allows a view of old acquisitions. This is useful in viewing
glitches. The Intensity knob has no effect on digital channels.
Acquire key > Realtime. Default setting. The display waveform is from the
current acquisition only. Not available in Average Acquire mode. When less then 1000
samples are available to display, a reconstruction filter is used to fill in the display.
Trigger
Normal Mode > Only Triggers when conditions are met ( transition or/and a logic level).
Auto Mode > Triggers when conditions are met or forces a trigger when conditions
are not met.
In Auto or Normal mode, a trigger will not be recognized until the pre-trigger buffer is
full. At slow sweep speeds (ms/div), the trigger may not be found. Use Normal mode
and wait for the trigger indicator to flash before causing the trigger condition in the
circuit.
HF Reject is a 50 kHz input low pass filter to the trigger circuit. Noise Rej
increases the trigger hysteresis band, thus reducing noise triggering. This also reduces
trigger sensitivity. The signal may have to be increased.
Holdoff keeps a trigger from occurring until the amount of time set has passed
since the last trigger. Used, on a repeating pattern of a waveform, to trigger on the
same edge of the pattern.
Revised: Sept. 2009, J. Kowalski
Page 21 of 25
University of Saskatchewan
Electrical Engineering Laboratory Equipment Manual
Edge triggers on a falling or rising transition. Pulse Width triggers after a time
set pulse width has occurred. Pattern trigger is a logical AND of the channels. Channels
can be specified high, low, or don’t care (X). A rising or falling edge can be set for only
one channel. A trigger will occur when the specified conditions for all the channels is
true. There are many types of triggers, for specialized waveforms, in the More hard key
category. Consult the User’s manual, available from the technicians, for the many types
of triggers.
Logic Analyzer ( Digital Channels )
The Logic Analyzer cable connects to the rear panel. Be Careful not to physically
Stress the cable. Route the cable around the side of the scope leaving plenty of slack at
the rear of the scope. Turn off the analog channels not in use. Push the D15 Thru D0
key. Turn off the digital channels not used. Controls for the digital channels are the soft
keys below the display, three keys to the right of the display and the Trigger keys. The
Thresholds soft key is used to set the digital channel threshold.
Printing the Display
The display can be printed to a USB printer ( not available ) or to a USB mass
storage device. The USB storage device is available from the technicians in 2C94.
Insert the USB storage device into the front connector.
Push the Save/Recall hard key and then the Save soft key.
Set the Format soft key to: Print to Bmp (8-bit).
The Save To and File Name soft keys may be used, but it is not necessary.
The scope will assign incremented file names automatically.
Push the Settings soft key and select Invert Graticule Colors.
The Press to Save soft key maybe used or push the ^ (arrow) soft key till the
Quick Print soft key appears and select it. This enables the Quick Print hard key,
allowing storage to the USB storage device without accessing the soft keys every time
you save.
Push the hard key Quick Print to save to the USB device. Load the file from the
USB device into a computer. Delete your files from the USB device before returning it to
2C94.
Revised: Sept. 2009, J. Kowalski
Page 22 of 25
University of Saskatchewan
Electrical Engineering Laboratory Equipment Manual
Agilent DSO3102A Oscilloscope
The introduction part of the Digitizing Oscilloscopes in the Equipment Manual
should be reviewed for basic theory operation. The controls for the 3102A are similar to
the HP 54601 oscilloscope. Refer to this section in the Equipment Manual for an
explanation of the operation and the controls. This section is a supplement to the
previous section mentioned.
This unit, along with other scopes and analyzers, should be reset to factory
default settings before using. Press the Save/Recall button and then toggle the
Storage button till setups, then press the Default Setup button to reset. This unit
defaults to 10X probe. Probe setting is located in the analog channel menu (1 and 2
button).
The screen displayed menu appears when a hard key is pressed and will
disappear 20 seconds ( default ) after use. Do not change this time because it is hard to
set with the display disappearing fast.
This unit, along with other scopes and analyzers, has an Auto-Scale button.
Auto-Scale automatically configures the scope to display the signals at its inputs.
Students that use this function will not learn the basic controls and how to display
signals. The auto scale function can be misleading when displaying a signal. In order to
learn the operation of equipment, avoid the Auto-Scale button. These units also do
automatic measurements ( Measure button). Manual Cursor measurements are more
accurate then automatic measurements. Use the Cursor measurements for accurate
measurements and as a learning tool. Measurements should be taken at the center of
the trace width.
BW Limit is located in the analog channel menu (1 and 2 button). This limits the
bandwidth of the scope to 20 MHz. This is used to filter out high frequency noise,
provided the signal is composed of low frequency components. This is a very low
bandwidth and will distort waveforms, made up of frequencies components above 20
MHz. It is best to leave BW Limit off in most situations.
Acquisition Modes
The Average acquisition mode will reduce the random noise of the waveform.
The average of 2 to 256 acquisitions is displayed.
The Peak Detect mode will capture the maximum and minimum levels of the
acquisitions.
The Normal acquisition mode will capture a waveform when a trigger occurs.
Revised: Sept. 2009, J. Kowalski
Page 23 of 25
University of Saskatchewan
Electrical Engineering Laboratory Equipment Manual
Sampling Modes
The Real Time sampling mode is used for single shot and pulse waveforms. This
mode can be used for most signals. The Equ-Time mode is used for repetitive high
frequency waveforms.
Trigger
Edge triggers on a falling or rising transition. Pulse Width triggers after a time
set pulse width has occurred. Video trigger is used for video signals.
Printing the Display
The display can be printed to a USB printer ( not available ) or to a USB mass
storage device. The USB storage device is available from the technicians in 2C94. The
mass storage device is connected to the USB host port on the USB module at the rear.
The mass storage has to be connected to appear in the Save/Recall menu.
Display > ! > Screen > Inverted
Save/Recall
Storage > USB
File Type > Bit map
Bmp Format > 8 or 24 bit
Save
The problem with this method is the black screen is saved and not the inverted
white screen. Use the Scope Connect Software to print the screen.
3000 Series Scope Connect Software
This software interfaces the scope to a computer. The GUI displays the scope
screen and controls. The scope controls can be adjusted form the GUI. Connect a cable
from the USB – B port on the back of the scope to the USB –A port on the front of the
PC.
Start / programs / Electrical Engineering / Lab Equipment / Agilent DSO3000 Scope.
Click on the Connect to Oscilloscope icon in the tool bar. Click on the Show
Virtual Panel button in the DSO Controller window. The scope can be adjusted from
the Virtual Panel or DSO Controller window. Push the Disconnect icon on the tool
bar to disconnect the scope from the PC. Push the Force button on the front of the
scope to acquire manual control of the scope.
Revised: Sept. 2009, J. Kowalski
Page 24 of 25
University of Saskatchewan
Electrical Engineering Laboratory Equipment Manual
Print the Display using Scope Connect
The software must be controlling the scope. Using the Waveform window, push
the Refresh button and uncheck the color box for the display. Using the Waveform
window, push the Print button or the Export button for the output.
Revised: Sept. 2009, J. Kowalski
Page 25 of 25