1
List of Figures
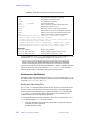
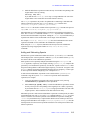
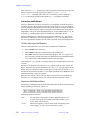
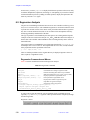
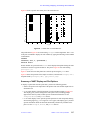
Figure 87. Stacked Plot of a VAST Data Set ..............................................................................
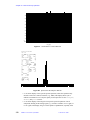
Figure 88. Spectrum of the Sample in Well F6 ...........................................................................
Figure 89. CombiPlate Started by combishow From vnmr ........................................................
Figure 90. CombiPlate Display - Binary Display For Each Region ...........................................
Figure 91. CombiPlate Save File Window ..................................................................................
Figure 92. CombiPlate Column and Row Input Screen ..............................................................
Figure 93. CombiPlate Field Box ...............................................................................................
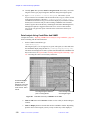
Figure 94. CombiPlate Window for VAST Data Analysis .........................................................
Figure 95. Connection Between the Rheodyne Injector Valve and Transfer Tube .....................
Figure 96. VAST Air Connections ..............................................................................................
Figure 97. VAST Signal Cable Connections ...............................................................................
Figure 98. Microflow Probe and Transfer TubeVolumes ...........................................................
Figure 99. Injecting Solution into a Microflow Probe ................................................................
Figure 100. Microflow Probe Flow Cell .....................................................................................
Figure 101. Finding the Optimum Sample Volume ....................................................................
Figure 102. Sample Definition Window, Expanded View ..........................................................
Figure 103. Rack Definition Window .........................................................................................
Figure 104. Main Control Window .............................................................................................
Figure 105. Calibrations Window ...............................................................................................
Figure 106. Gradient Shimming Pulse Sequence .......................................................................
Figure 107. Mapping the z1 Shim ..............................................................................................
Figure 108. Shimmap Plot ..........................................................................................................
Figure 109. Curve Fit Plot ..........................................................................................................
Figure 110. Display of Shim Adjustments for Each Iteration ....................................................
Figure 111. LC-NMR Block Diagram ........................................................................................
Figure 112. LC-NMR Spare Pane ...............................................................................................
Figure 113. lc1d Sequence Pane .................................................................................................
Figure 114. LC-NMR Pane .........................................................................................................
Figure 115. LC-NMR Pane Solvent Suppression Choices .........................................................
Figure 116. lc1d Acq & Obs Pane ..............................................................................................
Figure 117. lc1d Sequence Pane and Frequency Suppression Options ......................................
Figure 118. Process LC-NMR Button in LCNMR/STARS Pane ...............................................
Figure 119. Communication Window - Uploading .lcd File ...................................................
Figure 120. Stop-flow Chromatographic and NMR Data ...........................................................
Figure 121. LC-NMR Sample Entry Form Window ..................................................................
Figure 122. STAR Configuration Window .................................................................................
Figure 123. STAR System Control Window ...............................................................................
Figure 124. STAR Pump Method Window .................................................................................
Figure 125. Detector Method Windows ......................................................................................
Figure 126. Isocratic Run of the Three Benzoates with the 9050 UV-Vis Detector ...................
Figure 127. STAR Sequence List Window .................................................................................
Figure 128. LC-NMR 2000 Main Monitor Window ..................................................................
Figure 129. LC-NMR 2000 Main Monitor Window File Menu .................................................
Figure 130. LC-NMR 2000 Main Monitor Window Edit Menu ................................................
Figure 131. LC-NMR 2000 Main Monitor Window Setup Menu ..............................................
Figure 132. LC-NMR 2000 Satellite Window for System Configuration ..................................
01-999161-00 B0801
VNMR 6.1C User Guide: Liquids NMR
328
328
330
331
332
333
333
334
339
341
342
343
344
346
350
354
358
358
359
377
378
379
382
382
400
401
403
403
404
404
405
411
417
426
431
438
439
440
441
443
444
448
449
450
450
453
21