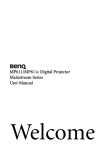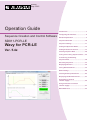
1
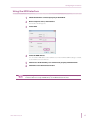
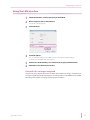
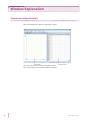
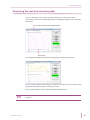
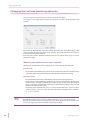
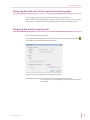
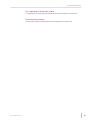
IX000691 Sep. 2012 Operation Guide Introduction ..............................................3 Sequence Creation and Control Software SD011-PCR-LE Wavy for PCR-LE Ver. 5.4x Configuring the Interface.........................4 Window Explanation ................................8 Sequence Overview ................................10 Sequence Settings ..................................11 Setting the Operation Mode ..................15 Setting Protection Functions .................17 Creating Sequence Data.........................20 Saving and Loading Sequence Data......26 Transferring and Reading Sequence Data ........................................30 Executing Sequences..............................32 Displaying Monitors ...............................34 Saving Monitored Data ..........................38 Other Settings .........................................40 Creating Arbitrary Waveforms ..............46 Displaying the Waveform View .............53 Using Wavy to Control a Power Supply........................................54 Using Commands to Control a Power Supply........................................57 Menu Reference ......................................58 About This Guide This guide is a PDF version of the SD011-PCR-LE Wavy for PCR-LE help file. Copyrights The contents of this guide may not be reproduced, in whole or in part, without the prior consent of the copyright holder. The contents of this guide are subject to change without notice. Copyright 2012© Kikusui Electronics Corporation 2 SD011-PCR-LE Ver.5.4x Introduction Sequence Creation and Control Software SD011-PCR-LE Wavy for PCR-LE is used to create and execute sequences for Kikusui PCR-LE Series AC power supplies. This operation guide explains how to use Sequence Creation and Control Software SD011-PCR-LE Wavy for PCR-LE to control PCR-LE series AC power supplies. Product versions that this guide covers This operation guide applies to version 5.4x of SD011-PCR-LE Wavy for PCR-LE. To check the version, on the Help menu, click About Wavy. Who should read this guide? This operation guide is intended for users who will use SD011-PCR-LE Wavy for PCR-LE to control PCR-LE series AC power supplies and instructors of such users. Explanations are given under the presumption that the reader has knowledge of the electrical aspects of AC power supplies. Related manuals For details on the PCR-LE Series AC power supply, see the PCR-LE Series User’s Manual. For details on the communication interface of the PCR-LE Series AC power supply (including communication error codes), see the PCR-LE Communication Interface Manual. Trademarks Microsoft and Windows are trademarks of Microsoft Corporation in the United States and/or other countries. All other company and product names used in this guide are trademarks or registered trademarks of their respective owners. Notations used in this guide • In this guide, Sequence Creation and Control Software SD011-PCR-LE Wavy for PCR-LE is referred to as “Wavy for PCR-LE” or “Wavy.” • In this guide, the PCR-LE Series AC Power Supply is referred to as the “PCR-LE Series” or “PCR-LE.” • The term “PC” is used to refer generally to both personal computers and workstations. • The following markings are used in this guide. Indicates a potentially hazardous situation which, if ignored, may result in damage to the product or other property. Indicates information that you should know. SD011-PCR-LE Ver.5.4x 3 Configuring the Interface Before using Wavy, configure the interface. Using the RS232C interface 4 1 2 Check that the PC is connected properly to the PCR-LE. 3 Click RS232C. 4 5 6 7 Select the COM port. On the Sequence menu, click Interface. The Interface window appears. Select the baudrate. Click Test to check that Wavy can communicate properly with the PCR-LE. Click OK to close the Interface window. SD011-PCR-LE Ver.5.4x Configuring the Interface Using the GPIB interface 1 2 Check that the PC is connected properly to the PCR-LE. 3 Select GPIB. 4 Select the GPIB address. 5 6 Click Test to check that Wavy can communicate properly with the PCR-LE. On the Sequence menu, click Interface. The Interface window appears. You can view the GPIB address on the COM-I/F screen in the PCR-LE’s CONFIG settings. For details, see the PCR-LE Series user’s manual. Click OK to close the Interface window. If you are using Windows 7 or Windows Vista, you need to install the latest GPIB driver. For details on how to obtain and set up the GPIB driver, see the GPIB instruction manual. SD011-PCR-LE Ver.5.4x 5 Configuring the Interface Using the USB interface 1 2 Check that the PC is connected properly to the PCR-LE. 3 Select USB. 4 Set the serial number. 5 Click Test to check that Wavy can communicate properly with the PCR-LE. On the Sequence menu, click Interface. The Interface window appears. You can check the serial number on the rear panel of the PCR-LE. If communication fails, check whether the PC has recognized the PCR-LE. In Control Panel, click “System and Security” and then Device Manager under System. Check that “USB Test and Measurement Device” is displayed. If the device is not recognized properly, you need to set up the PCR-LE interface again. For details, see the PCR-LE Communication Interface Manual. 6 Click OK to close the Interface window. If the PCR-LE is no longer recognized If the PC enters sleep mode, it may stop recognizing the PCR-LE. If this happens, disconnect the USB cable, and connect it again. 6 SD011-PCR-LE Ver.5.4x Configuring the Interface Using the LAN interface 1 2 Check that the PC is connected properly to the PCR-LE. 3 Select Ethernet. 4 Set the IP address. 5 6 Click Test to check that Wavy can communicate properly with the PCR-LE. On the Sequence menu, click Interface. The Interface window appears. You can view the IP address on the COM-I/F screen in the PCR-LE’s CONFIG settings. For details, see the PCR-LE Series user’s manual. Click OK to close the Interface window. If the PCR-LE is no longer recognized If you are not using a fixed IP address, the IP address of the PCR-LE may change, causing the PC to no longer recognize the PCR-LE. If this happens, check the IP address on the COM-I/F screen in CONFIG settings on the PCR-LE, and change to the appropriate IP address. SD011-PCR-LE Ver.5.4x 7 Window Explanation Sequence setup windows When you start Wavy, the sequence setup windows appear. You can use your mouse to set steps in the Graph window. You can enter values to set steps in the Worksheet window. 8 SD011-PCR-LE Ver.5.4x Window Explanation Sequence execution window When you execute a sequence, the Run window appears. You can also display the real-time monitor graph. Select the tabs to switch between the setting graph and the monitor graph. You can also display the setting graph and the monitor graph in a single window. For single-phase, three-wire output and three-phase output, the Setting/Monitor Graph tab does not appear. SD011-PCR-LE Ver.5.4x 9 Sequence Overview You can use the sequence feature to automatically execute the steps that you have set in advance. By setting one step at a time, you can execute a variety of waveform simulations. Step 1 100 seconds Ramp Step 2 150 seconds Step Step 3 80 seconds Ramp Time A sequence is a collection of steps. When you execute a sequence, the software executes the steps in order starting with the first step. A single execution of a sequence is complete after the sequence’s last step is finished. The maximum number of steps that you can create is 600. You can also repeat a sequence the specified number of times. Flow of sequence execution 1 2 3 4 Set the operation mode of the sequence. Create sequence data. Transfer the sequence data to the device. Run the sequence. If you need to create arbitrary waveforms, create them before creating sequence data. 10 SD011-PCR-LE Ver.5.4x Sequence Settings Risk of malfunction. This application software does not check the validity of values (it does not check whether values exceed the limits of the device) while it executes sequences. Do not specify voltages or currents that exceed the specifications of the AC power supply. Sequence settings Set conditions that apply to all steps. Operation mode • Time Setting Set the unit of time to milliseconds, seconds, minutes, or hours. • Output Voltage Mode Select AC voltage, DC voltage, or AC+DC voltage. • Output Voltage Range Set the voltage range that is used when the output is turned on to “L” or “H.” The output voltage setting ranges for the L range and H range are shown below. AC mode DC mode and AC+DC mode L range 0 V to 152.5 V -215.5 V to 215.5 V H range 0 V to 305.0 V -431.0 V to 431.0 V • Frequency Set the default frequency and default transition. You can set the frequency when the output voltage mode is set to AC or AC+DC. Protection functions Configure the protection settings. Repeat count Set how many times to repeat the sequence. Set this when you transfer the sequence data. SD011-PCR-LE Ver.5.4x 11 Sequence Settings Step settings Set one condition for each step. One step corresponds to one operation in the executed waveform. The settings vary depending on the output voltage mode and the number of phase outputs. Settings for single-phase, two-wire Setting Output voltage mode AC DC AC+DC AC voltage setting Yes — Yes DC voltage setting — Yes Yes Time interval Yes Yes Yes AC voltage transition Yes — Yes DC voltage transition — Yes Yes Starting phase angle control Yes — Yes Starting phase angle setting Yes — Yes Ending phase angle control Yes — Yes Ending phase angle setting Yes — Yes Phase priority Yes — Yes Frequency Yes — Yes Frequency transition Yes — Yes Trigger OUT Yes Yes Yes Trigger IN Yes Yes Yes Output Yes Yes Yes Waveform number selection Yes — Yes Status signal output Yes Yes Yes Settings for single-phase, three-wire Setting 12 Output voltage mode AC DC AC+DC AC voltage setting (U and V phases) Yes — — DC voltage setting — Yes — Time interval Yes Yes — AC voltage transition Yes — — DC voltage transition — Yes — Starting phase angle control Yes — — Starting phase angle setting Yes — — Ending phase angle control Yes — — Ending phase angle setting Yes — — Phase priority Yes — — UV phase Yes — — SD011-PCR-LE Ver.5.4x Sequence Settings Setting Output voltage mode AC DC AC+DC UV phase angle Yes — — Frequency Yes — — Frequency transition Yes — — Trigger OUT Yes Yes — Trigger IN Yes Yes — Output Yes Yes — Waveform number selection Yes — — Status signal output Yes Yes — Settings for three-phase Setting Output voltage mode AC DC AC+DC AC voltage setting (U, V, and W phases) Yes — — DC voltage setting — — — Time interval Yes — — AC voltage transition Yes — — DC voltage transition — — — Starting phase angle control Yes — — Starting phase angle setting Yes — — Ending phase angle control Yes — — Ending phase angle setting Yes — — Phase priority Yes — — UV phase Yes — — UV phase angle Yes — — UW phase Yes — — UW phase angle Yes — — Frequency Yes — — Frequency transition Yes — — Trigger OUT Yes — — Trigger IN Yes — — Output Yes — — Waveform number selection Yes — — Status signal output Yes — — Time[s] represents the cumulative time from step 1. You cannot set this value. • AC voltage or DC voltage setting Set the voltage. The AC voltage setting range is 0.0 V to 305.0 V. The DC voltage setting range is -431.0 V to 431.0 V. • Time interval Set the step execution time. SD011-PCR-LE Ver.5.4x 13 Sequence Settings • AC voltage or DC voltage transition (step or ramp) Set the step transition. Example Voltage: 10 V Transition: Step Example Voltage: 10 V Transition: Ramp 10 V 10 V 1 step 1 step 10 V 1 step When there are few step intervals, the ramp lines are not smooth. • Starting phase angle control Set the starting phase angle to FREE or FIXED. • Starting phase angle If you want to set the starting phase angle to FIXED, set the angle (0 deg to 359 deg). • Ending phase angle control Set the ending phase angle to FREE or FIXED. • Ending phase angle If you want to set the ending phase angle to FIXED, set the angle (0 deg to 359 deg). • Phase priority • Set the phase priority of the step in which you want to perform a sudden phase change to ON. Then, set the starting and ending phase angles of the previous step. UV phase and UW phase • Turn UV phase and UW phase on or off. UV phase angle and UW phase angle To turn on the UV phase and UW phase, set the angle (0 deg to 359 deg). • Frequency Set the step’s frequency (1.00 Hz to 999.9 Hz). • Frequency transition Set the frequency transition to ramp or step. • Trigger OUT and trigger IN Set the trigger signal output (trigger OUT) and trigger wait state (trigger IN) to ON or OFF. • Output Set the output to ON or OFF. • Waveform number Set the waveform bank number that you want to use (0 to 63). To output an arbitrary waveform, set the waveform bank number that you specified when you transferred the arbitrary waveform data. • Status signal output Set the status signal output to ON or OFF. To set steps, you can use your mouse or enter values. 14 SD011-PCR-LE Ver.5.4x Setting the Operation Mode Set the sequence conditions (wiring method, unit of time, output voltage mode, output voltage range, and frequency). 1 On the Sequence menu, click Sequence Mode. Or, click 2 Select the wiring method. 3 Set the unit of time. 4 SD011-PCR-LE Ver.5.4x on the toolbar. The Mode window appears. You can select 1phase 2wire, 1phase 3wire, or 3phase. You can set the step interval unit to milliseconds, seconds, minutes, or hours. Unit Interval setting range ms (milliseconds) 0.1 ms to 10000.0 ms s (seconds) 0.001 s to 1000.000 s min (minutes) 0.1 min to 1000.0 min h (hours) 0.1 h to 1000.0 h Set the output voltage mode for the sequence. The available options vary depending on the wiring method. For single-phase, two-wire, select AC voltage, DC voltage, or AC+DC voltage. For single-phase, three-wire, select AC voltage or DC voltage. For three-phase, this is fixed to AC voltage. If you specify AC+DC voltage, you can set the default DC voltage to use when you are creating sequence data. In the Default DC Voltage box, enter a value (-431.0 V to 431.0 V). There are three significant decimal places (x.xxx). The actual number of significant decimal places varies depending on the PCR-LE that the PC is connected to. 15 Setting the Operation Mode 5 Set the output voltage range for the sequence. 6 Set the frequency (1.00 Hz to 999.9 Hz) and frequency transition. 7 Click OK to close the Mode window. Select L or H. Set the default frequency and transition to use when you are creating sequence data. Enter the value (1.00 Hz to 999.9 Hz) in the Default Frequency box. Select Step or Ramp from the Default Transition list. You can set the frequency when the output voltage mode is set to AC or AC+DC. 16 SD011-PCR-LE Ver.5.4x Setting Protection Functions Set protection functions and current limits. Protection functions Protection functions are implemented on the PCR-LE. You can set overvoltage protection (OVP), undervoltage protection (UVP), and the detection time of internal semiconductor protection (OCP). Current limits Current limiting features, which limit the current flowing through the load, are implemented on the PCR-LE. You can set the current limit (upper limit of output current), positive peak current limit, negative peak current limit, and trip (operation carried out when the current limit is exceeded). Setting power supply protection functions 1 On the Sequence menu, click Protection Setup. 2 Select the mode that you want to set protection and current limits for. The Protection Setup window appears. Select AC, DC, or AC+DC. Be sure to select the sequence’s output voltage mode before setting the protection function items. To set protection functions, the PCR-LE output must be turned off. SD011-PCR-LE Ver.5.4x 17 Setting Protection Functions 3 Enter values in the protection function items. Item Unit Description OVP V Enter the output overvoltage protection (OVP) value. Range: 0.0 V to 335.5 V (AC mode) -474.1 V to 474.1 V (AC+DC or DC mode) UVP V Enter the under overvoltage protection (UVP) value. Range: 0.0 V to 335.5 V (AC mode) -474.1 V to 474.1 V (AC+DC or DC mode) Detection time of OCP activation s Set the detection time for activating the internal semiconductor protection (OCP). Enter 1, 2, or 3 (in seconds). You can set this value only in AC mode. 4 Click Set. 5 Click OK to close the Protection Setup window. The values are sent to the PCR-LE, and the settings are updated. Querying the PCR-LE settings Click Read to read the protection settings that are currently set on the connected PCR-LE. Setting the power supply current limits 1 18 On the Sequence menu, click Protection Setup. The Protection Setup window appears. SD011-PCR-LE Ver.5.4x Setting Protection Functions 2 Select the mode that you want to set protection and current limits for. Select AC, DC, or AC+DC. Be sure to select the sequence’s output voltage mode before setting the current limit items. The current limit setting range varies depending on the sequence’s output voltage mode. To set current limits, the PCR-LE output must be turned off. 3 Enter values in the current limit items. The setting range of each item varies depending on the PCR-LE model that you are using and the output mode. Current limit Positive peak current limit1 Negative peak current limit1 AC 2 DC and AC+DC2 PCR500LE 0.05 A to 5.50 A 0.35 A to 3.85 A 0.50 A to 22.00 A -0.50 A to -22.00 A PCR1000LE 1.00 A to 11.00 A 0.70 A to 7.70 A 1.00 A to 44.00 A -1.00 A to -44.00 A PCR2000LE 2.00 A to 22.00 A 1.40 A to 15.40 A 2.00 A to 88.00 A -2.00 A to -88.00 A PCR3000LE 3.00 A to 33.00 A 2.10 A to 23.10 A 3.00 A to 132.00 A -3.00 A to -132.00 A PCR4000LE 4.00 A to 44.00 A 2.80 A to 30.80 A 4.00 A to 176.00 A -4.00 A to -176.00 A PCR6000LE 6.00 A to 66.00 A 4.20 A to 46.20 A 6.00 A to 264.00 A -6.00 A to -264.00 A PCR9000LE 9.00 A to 99.00 A 6.30 A to 69.30 A 9.00 A to 396.00 A -9.00 A to -396.00 A 1 2 4 Applies to all output modes. The output mode. You can set the output mode in the sequence’s mode window. For the procedure, see Setting the Operation Mode.” To set the trip feature, select the Trip check box. In AC mode, select the Trip check box, enter a value between 0 s and 10 s, and click Set. Trip (the action that is performed when any of the current limits is exceeded) When the trip feature is enabled, the output will be turned off if a current exceeding any of the current limits is detected. In AC mode, you can set the amount of time (0 s to 10 s) that elapses after any of the current limits is exceeded until the output is turned off. Enter the value in the box below the Trip check box, and click Set. In DC or AC+DC mode, the output is turned off 1 second after any of the current limits is exceeded. There may be a delay of approximately 0.1 seconds depending on the current measurement response speed. 5 SD011-PCR-LE Ver.5.4x Click OK to close the Protection Setup window. 19 Creating Sequence Data To create sequence data, create and edit steps in the Graph or Worksheet window. • Creating and editing steps by using the mouse (Graph window) • Creating and editing steps by entering values (Worksheet window) If you need to create arbitrary waveforms, create them before creating sequence data. For the procedure, see “Creating Arbitrary Waveforms.” Creating and editing steps by using the mouse This section will explain how to create a step in the Graph window. 20 1 Move the mouse pointer over the Y axis. 2 Drag the pointer to the time and the voltage that you want to set. The pointer becomes a crosshair, and a voltage is displayed. The setting is confirmed, and the step settings are entered in the first row of the worksheet. To set the setting graph scale, see “Changing the setting graph scale.” You can set the step interval unit. This completes the creation of step 1. SD011-PCR-LE Ver.5.4x Creating Sequence Data 3 If you want to continue creating steps, move the mouse pointer over the end point of the step that you have just created. When the pointer becomes a crosshair, drag the mouse pointer to the point that corresponds to the time and the voltage that you want to set. The setting is confirmed, and the step settings are entered in the first blank row of the worksheet. Repeat this procedure until you have set all the steps. • For AC mode of single-phase, three-wire and of three-phase, you need to create steps of each phase one step at a time. You cannot consecutively enter steps for a single phase. • You can change the graph scale. For the procedure, see “Changing the setting graph scale.” Changing the setting graph scale You can change the Graph window’s X-axis and Y-axis scales. On the Graph menu, click Scale. Or, click on the toolbar. The Scale window appears. You can also right-click in the Graph window, and click Scale to display the Scale window. If you select the Maximum Time, Maximum Value, or Minimum Value check box, the auto scale feature will be enabled. This feature automatically updates the scale values to the appropriate values when you enter values to set a step or when you open a saved file. If the auto scale feature is disabled, settings that are outside of the range are not displayed on the graph. If you are using the mouse to set steps, the scale will not be updated automatically even if the auto scale feature is enabled. To update the scale, on the Graph menu, click Update Auto Scale. SD011-PCR-LE Ver.5.4x 21 Creating Sequence Data Using the mouse to edit steps Changing the set voltage 22 1 Double-click the step that you want to edit. 2 Move the mouse pointer over the black square. 3 Drag the pointer up or down to the value that you want to change to. A black square is displayed at the step’s end point, and you can edit the step. The pointer changes to a double arrow. The setting changes accordingly. SD011-PCR-LE Ver.5.4x Creating Sequence Data Changing the interval (step execution time) 1 Double-click the vertical line (the step-division line) at the end point of the step that you want to edit. A black square is displayed at the top of the step-division line, and you can edit the step. 2 Move the pointer over the black square. 3 Drag the pointer left or right to the value that you want to change to. The pointer changes to a double arrow. The setting changes accordingly. Changing an AC voltage or DC voltage transition (step or ramp) 1 Double-click the step that you want to change. 2 Right-click to display a shortcut menu. Click Transition and then Ramp or Step. A black square is displayed at the step’s end point, and you can edit the step. The transition of the selected step changes accordingly. Deleting a step SD011-PCR-LE Ver.5.4x 1 Double-click the step that you want to delete. 2 Right-click to display a shortcut menu. Click Delete. A black square is displayed at the step’s end point, and you can edit the step. The step is deleted. 23 Creating Sequence Data Creating and editing steps by entering values This section will explain how to create a step in the Worksheet window. The first row of the worksheet is step 1. Time[s] represents the cumulative time from step 1. It is automatically calculated, so you cannot change it. To edit the voltage, frequency, interval, starting phase angle, or ending phase angle, click the relevant cell, and enter a value. To edit the transition, trigger IN, trigger OUT, output, waveform, frequency transition, starting phase angle control, ending phase angle control, phase priority, or status signal output, doubleclick the relevant cell. Or click the cell, and press Enter. The default transition and frequency transition values are “Step.” The default output value is “on.” The default trigger IN, trigger OUT, phase priority, UV phase, UW phase and status signal output values are “off.” The default waveform number, starting phase angle, ending phase angle, UV phase angle, and UW phase angle is “0.” The default starting phase control and ending phase control values are “FREE.” Values that have been entered in cells cannot be deleted. To delete them, delete the entire step. You can cancel the entering or editing of a cell’s value by pressing Esc. Enter step data in order, starting from step 1. • Step 1 (first row in the worksheet) is fixed to step transition. It cannot be changed to ramp. • The standard waveform is sinusoid (waveform bank number 0). • To set an arbitrary waveform, you need to create and save the arbitrary waveform in advance and transfer the data to a waveform bank number other than zero. For the procedure to create, save, and transfer arbitrary waveforms, see Creating Arbitrary Waveforms.” 24 SD011-PCR-LE Ver.5.4x Creating Sequence Data Copying and deleting steps You can use the Worksheet window to delete and copy steps that you have created. Right-click in the Worksheet window and then click Undo to undo the last step edit. Copying and inserting a step 1 Click a cell in the step that you want to copy. 2 On the Worksheet menu, click Copy. Or, right-click, and then click Copy. 3 Click a cell in an existing step to specify the copy destination. 4 On the Worksheet menu, click Paste. Or, right-click, and then click Paste. You can click any cell in the step. The step is copied. The copied step is inserted before the selected step. The copied step is inserted before the selected step, and the total number of steps increases by 1. Deleting a step 1 Click a cell in the step that you want to delete. 2 On the Worksheet menu, click Delete. Or, right-click, and then click Delete. You can click any cell in the step. The selected step is deleted. When you delete a step, the contents of the step are copied to the clipboard. Therefore, if you insert a step immediately after deleting a step, the deleted step will be inserted. Keyboard shortcuts You can use keyboard shortcuts to copy and delete steps. In the worksheet, you can press C or Ctrl+C on the keyboard to copy the selected step. Press V or Ctrl+V to insert the copied step. Press Delete to delete the selected step. Press Z or Ctrl+Z to undo the last edit. For all of these operations, a confirmation dialog box is displayed before the operation is actually carried out. SD011-PCR-LE Ver.5.4x 25 Saving and Loading Sequence Data After you have created a sequence, save the sequence data to a file. Saving sequence data The first time that you save a file, on the File menu, click Save As. Specify the file name. To overwrite a file that you have already saved, on the File menu, click Save. Or, click toolbar. The file name extension is “.wvy.” on the Viewing saved data You can use Notepad to view saved sequence data. By default, data is saved as tab-separated values. You can switch from tab separation to comma separation. The first row contains the sequence conditions. Column 1 Voltage mode AC: AC voltage mode, DC: DC voltage mode, ACDC: AC+DC voltage mode Column 2 Time unit ms: milliseconds, s: seconds, min: minutes, h: hours Column 3 Arbitrary waveform availability 0: arbitrary waveform not available, 1: arbitrary waveform available Column 4 Voltage range 0: L range, 1: H range Column 5 Wiring method 0: 1P2W, 1: 1P3W, 2: 3P Row two and all subsequent rows contain the step data conditions. The conditions vary depending on the output voltage mode. AC voltage mode (1P2W) 26 Column 1 AC voltage Unit: V Column 2 Time interval The unit is shown in row 1. Column 3 AC voltage transition 0: step, 1: ramp Column 4 Frequency Unit: Hz Column 5 Frequency transition 0: step, 1: ramp Column 6 Trigger OUT 0: off, 1: on Column 7 Trigger IN 0: off, 1: on Column 8 Output 0: off, 1: on Column 9 Arbitrary waveform number 0 to 63 Column 10 Arbitrary waveform file name Column 11 Starting phase angle control 0: off, 1: on Column 12 Starting phase angle Unit: degrees SD011-PCR-LE Ver.5.4x Saving and Loading Sequence Data Column 13 Ending phase angle control 0: off, 1: on Column 14 Ending phase angle Unit: degrees Column 15 Phase priority 0: off, 1: on Column 16 Status signal output 0: off, 1: on AC voltage mode (1P3W) Column 1 AC voltage (U phase) Unit: V Column 2 AC voltage (V phase) Unit: V Column 3 Time interval The unit is shown in row 1. Column 4 AC voltage transition 0: step, 1: ramp Column 5 Frequency Unit: Hz Column 6 Frequency transition 0: step, 1: ramp Column 7 Trigger OUT 0: off, 1: on Column 8 Trigger IN 0: off, 1: on Column 9 Output 0: off, 1: on Column 10 Arbitrary waveform number 0 to 63 Column 11 Arbitrary waveform file name (U phase) Column 12 Arbitrary waveform file name (V phase) Column 13 Starting phase angle control 0: off, 1: on Column 14 Starting phase angle Unit: degrees Column 15 Ending phase angle control 0: off, 1: on Column 16 Ending phase angle Unit: degrees Column 17 Phase priority 0: off, 1: on Column 18 UV phase 0: off, 1: on Column 19 UV phase angle Unit: degrees Column 20 Status signal output 0: off, 1: on AC voltage mode (3P) SD011-PCR-LE Ver.5.4x Column 1 AC voltage (U phase) Unit: V Column 2 AC voltage (V phase) Unit: V Column 3 AC voltage (W phase) Unit: V Column 4 Time interval The unit is shown in row 1. Column 5 AC voltage transition 0: step, 1: ramp Column 6 Frequency Unit: Hz Column 7 Frequency transition 0: step, 1: ramp Column 8 Trigger OUT 0: off, 1: on Column 9 Trigger IN 0: off, 1: on Column 10 Output 0: off, 1: on Column 11 Arbitrary waveform number 0 to 63 Column 12 Arbitrary waveform file name (U phase) Column 13 Arbitrary waveform file name (V phase) Column 14 Arbitrary waveform file name (W phase) Column 15 Starting phase angle control 0: off, 1: on 27 Saving and Loading Sequence Data Column 16 Starting phase angle Unit: degrees Column 17 Ending phase angle control 0: off, 1: on Column 18 Ending phase angle Unit: degrees Column 19 Phase priority 0: off, 1: on Column 20 UV phase 0: off, 1: on Column 21 UV phase angle Unit: degrees Column 22 UW phase 0: off, 1: on Column 23 UW phase angle Unit: degrees Column 24 Status signal output 0: off, 1: on AC+DC voltage mode (1P2W) 28 Column 1 AC voltage Unit: V Column 2 Time interval The unit is shown in row 1. Column 3 AC voltage transition 0: step, 1: ramp Column 4 Frequency Unit: Hz Column 5 Frequency transition 0: step, 1: ramp Column 6 Trigger OUT 0: off, 1: on Column 7 Trigger IN 0: off, 1: on Column 8 Output 0: off, 1: on Column 9 DC voltage value Unit: V Column 10 DC voltage transition 0: step, 1: ramp Column 11 Arbitrary waveform number 0 to 63 Column 12 Arbitrary waveform file name Column 13 Starting phase angle control 0: off, 1: on Column 14 Starting phase angle Unit: degrees Column 15 Ending phase angle control 0: off, 1: on Column 16 Ending phase angle Unit: degrees Column 17 Phase priority 0: off, 1: on Column 18 Status signal output 0: off, 1: on SD011-PCR-LE Ver.5.4x Saving and Loading Sequence Data DC voltage mode (1P2W and 1P3W) Column 1 DC voltage value Unit: V Column 2 Time interval The unit is shown in row 1. Column 3 DC voltage transition 0: step, 1: ramp Column 4 Trigger OUT 0: off, 1: on Column 5 Trigger IN 0: off, 1: on Column 6 Output 0: off, 1: on Column 7 Status signal output 0: off, 1: on Loading saved data On the File menu, click Open. Or, click on the toolbar. If you assign an arbitrary waveform to a sequence, check that the arbitrary waveform data file (.arb) and the sequence data file (.wvy) are saved in the specified location on your PC. When Wavy recalls the sequence data, if the arbitrary waveform data file is not in the specified location, Wavy may assign an unintended waveform. SD011-PCR-LE Ver.5.4x 29 Transferring and Reading Sequence Data To execute a sequence, either transfer the sequence data that you created to the PCR-LE or read the sequence data set in the PCR-LE into Wavy. Transferring a sequence 1 On the Sequence menu, click Transfer. Or, click 2 Set the sequence repeat count (between 1 and 99999). 3 Select or clear the Write Wave check box. 4 Under Write, click Run. on the toolbar. The Transfer window appears. 99999 represents infinity. If you select the check box, arbitrary waveform data will also be transferred. The sequence data is written to the PCR-LE. If arbitrary waveform data has been created, the data is transferred first. • For the procedure to display the waveform view, see Displaying the Waveform View.” • Up to 63 arbitrary waveforms can be transferred. • If the number of steps is large, transferring may take a while. 30 SD011-PCR-LE Ver.5.4x Transferring and Reading Sequence Data Reading a sequence 1 On the Sequence menu, click Transfer. Or, click 2 If the sequence step that you want to read contains waveform data, select the Read Wave check box. on the toolbar. The Transfer window appears. The waveform data will also be read. 3 SD011-PCR-LE Ver.5.4x Under Read, click Run. 31 Executing Sequences After you have finished creating and transferring the sequence, execute it. 1 On the Sequence menu, click Run. Or, click 2 Click Run. on the toolbar. The Run window appears. The figure below shows an example for a three-phase output. The sequence starts. To abort a sequence that is running, click Stop. The green line represents the approximate position of execution. For sequences that have a large number of repetitions or those that take a long time to run, the position indicated by the green line may appear offset from the actual position. During test execution, the menus and the toolbar are disabled. In addition, the execution window cannot be resized. You can change the size of the Run window when a sequence is not running. If you select the “Output OFF when End/Stop” check box, the output is turned off when the sequence finishes executing, when the sequence is aborted, or when a protection function is activated. 32 SD011-PCR-LE Ver.5.4x Executing Sequences If you do not select this check box, you need to manually turn off the output. To turn off the output, click OFF under “Output OFF when End/Stop.” When a sequence is running, OFF is disabled. If you want to accurately control the time when the output is turned off, add a last step for turning off the output. Information displayed during execution Range Displays the range. Mode Displays the mode (sequence operation condition). Count Displays the present iteration. Elapsed Time Displays the elapsed time since the sequence execution started Measured values Displays the items (current, voltage, and power) that are selected in the Monitor selection. Displaying output values in the Run window Status indicators The sequence run window shows one of the following status indicators. Standing by. The sequence is running. The sequence is paused. The sequence is complete. The Stop button has been clicked. A communication error has occurred. Check the interface settings. A protection function (UVP, OVP, OCP, or OHP) has been activated. (UVP example) If you run a long sequence, the data displayed on the real-time monitor graph increases. You can reduce the load on your PC by setting the maximum number of data entries. Setting this number will not affect the monitored data that is saved. SD011-PCR-LE Ver.5.4x 33 Displaying Monitors You can display monitored values and monitor graphs in the sequence run window. To change the items to display, on the Sequence menu, click Monitoring Setup. Or, click the toolbar. The Monitoring Setup window appears. on Displaying output values in the Run window Select the Current, Voltage, and Power check boxes to display the output values in the Run window. 34 SD011-PCR-LE Ver.5.4x Displaying Monitors Displaying the real-time monitor graph Select the “Display the monitor graph” check box to display the real-time monitor graph. If you select this check box, the Monitor Graph tab and Setting/Monitor Graph tab are added to the Run window. The Setting/Monitor Graph tab displays the setting graph and real-time monitor graph. You can set which graphs (current, voltage, and power) are displayed on the real-time monitor graph by clicking Monitoring Setup on the Sequence menu. Move your mouse pointer over the graph to display the monitored values. For single-phase, three-wire output and three-phase output, the Setting/Monitor Graph tab does not appear. SD011-PCR-LE Ver.5.4x 35 Displaying Monitors Changing the real-time monitor graph scale You can change the X-axis and Y-axis scales of the real-time monitor graph. To change the scales, right-click the real-time monitor graph, and click Scale to display the Scale window. If you select the Max time, Max current, Max voltage, Max power, Min current, Min voltage, or Min power check box, the auto scale feature will be activated. This feature updates the scale values in accordance with the monitored values. If the auto scale feature is disabled, monitored values that are outside of the range are not displayed on the graph. When the auto maximum time scale is enabled When the auto maximum time scale is enabled, you can select roll mode or normal mode. Roll mode The minimum and maximum times of the X-axis are scrolled at the same time. The display range is defined by subtracting the minimum time setting from the maximum time setting. Normal mode The minimum time is fixed. The maximum time is updated to the appropriate value. If you select the “Scrolling within the specified range” check box, the graph is scrolled when the monitored values exceed the maximum time of the X axis. The amount of time that the graph will be scrolled by is determined by subtracting the minimum time setting and the set scroll time from the maximum time setting. For example, if the minimum time is set to 0 seconds, the maximum time is set to 23 seconds, and the scroll time is set to 10 seconds, the amount of time that the graph will be scrolled by is 23 - 0 - 10 = 13 seconds. For single-phase, three-wire output and three-phase output, if you select normal mode, the “Scrolling within the specified range” check box is always selected (you cannot clear the check box). The range of scroll time that you can specify is 4 s to 3600 s for single-phase, two-wire output and 4 s to 600 s for single-phase, three-wire output and three-phase output. 36 SD011-PCR-LE Ver.5.4x Displaying Monitors Changing the time unit of the real-time monitor graph You can change the time-axis unit (s or h:min:s) of the real-time monitor graph. Right-click the real-time monitor graph to display a menu. To set the unit to seconds, click X-axis Unit and then “s.” To set the unit to hours:minutes:seconds, click X-axis Unit and then “h:min:s.” Changing the monitoring interval You can change the monitoring interval. To change the monitoring interval, on the Sequence menu, click Monitoring Setup. Or, click on the toolbar. The Monitoring Setup window appears. Under Select Items to be Monitored, set the Monitoring Interval. Monitoring interval range: 200 ms to 600000 ms for single-phase, two-wire output 500 ms to 600000 ms for single-phase, three-wire output and threephase output SD011-PCR-LE Ver.5.4x 37 Saving Monitored Data You can save monitored data as a text file. To save monitored data, on the Sequence menu, click Monitoring Setup. Or, click bar. The Monitoring Setup window appears. on the tool- Under Save File, click Yes. Then, select the save destination. The file name will be a concatenation of the output voltage mode and the execution start date and time followed by the extension. You can change the file name extension (the default is .txt). You can set the unit of the elapsed time that is output to the file. The accuracy of the elapsed time varies depending on the PC environment that you are using. [s]: Seconds [h:min:s]: Hours, minutes, seconds If the “Data right before run” check box is selected, the monitored values before sequence execution (monitored values at time 0 s) will be written at the beginning of the saved data. If you select the “Data Immediately after End/Stop” check box, the monitored values when the sequence is completed or aborted will be written at the end of the saved data. Viewing saved data You can use Notepad to view saved monitored data. By default, data is saved as tab-separated values. You can switch from tab separation to comma separation. 38 SD011-PCR-LE Ver.5.4x Saving Monitored Data For single-phase, three-wire output For single-phase, three-wire output, monitored data for the U and V phases is saved to a file. For three-phase output For three-phase output, monitored data for the U, V and W phases is saved to a file. SD011-PCR-LE Ver.5.4x 39 Other Settings Setting the mouse resolution used to set steps Always using the step transition mode when using the mouse to set steps Setting the maximum data size Changing the graph properties Changing the file format of sequence setup data Changing the file format of monitored data Changing the window design Changing the display format of the Graph and Worksheet windows Changing the folder that arbitrary waveforms are saved in Setting the mouse resolution used to set steps You can set the mouse resolution used to set steps in the Graph window. Setting the time interval resolution Right-click in the Graph window, click “Resolution of time period” and then the resolution that you want to use (Default, 1st digit of integer, 1st digit of decimal place, or 2nd digit of decimal place). Setting the value resolution Right-click in the Graph window, click “Resolution of setting value” and then the resolution that you want to use (Default, 1st digit of integer, 1st digit of decimal place, 2nd digit of decimal place, or 3rd digit of decimal place). Always using the step transition mode when using the mouse to set steps You can set the transition mode that is used when you are using the mouse to set steps in the Graph window to “Step.” Right-click in the Graph window, and then click “Draw sequence by step.” 40 SD011-PCR-LE Ver.5.4x Other Settings Setting the maximum data size If you run a long sequence, the data displayed on the real-time monitor graph increases. This will increase the load on the PC, which may cause errors. You can reduce the load on your PC by setting the maximum number of data entries. Setting this number will not affect the monitored data that is saved. Right-click the real-time monitor graph, and click Max Data Count to display the Maximum number of data window. Enter the value (10000 to 1000000; the default value is 100000). If the number of monitored data entries exceeds the set value, monitored data is deleted starting with the oldest entry. One monitored data entry uses approximately 200 bytes. When you run a long sequence, we recommend that you use Task Manager to check the amount of physical memory being used. Changing the graph properties You can change various settings for the setting graph and the real-time monitor graph. Setting the items to display (current, voltage, and power) on the monitor graph You can set which items are displayed on the real-time monitor graph. Right-click the monitor graph, click Line Display, and then select the items that you want to display (Current, Voltage, and Power). Showing and hiding the step-division lines • Graph window On the Graph menu, click Vertical Axis. Or, click step-division lines. on the toolbar. This will show or hide the You can also right-click in the Graph window, and click Vertical Axis. • Setting graph of the Run window Right-click the setting graph, and click Vertical Axis to show or hide step-division lines. Changing the X-axis and Y-axis scales You can show and hide X-axis and Y-axis scales. You can also change the type of scale lines (solid or dotted) and the number of scale lines (grid). Showing and hiding scales • Graph window On the Graph menu, click X-axis Scale Lines or Y-axis Scale Lines to show or hide scales. Rightclick the graph, and then click X-axis Scale Lines or Y-axis Scale Lines show or hide scales. • Run window Right-click the graph, and then click X-axis Scale Lines or Y-axis Scale Lines to show or hide scales. SD011-PCR-LE Ver.5.4x 41 Other Settings Selecting dotted lines or solid lines and setting the grid • Graph window Click on the toolbar to display the Scale window. Change the number of scale lines to change the grid. Select the Dot check boxes to display scales using dotted lines. • Run window Right-click the graph, and then click “Number of scale lines” to display the Scale lines window. Change the number of scale lines to change the grid. Select the Dot check boxes to display scales using dotted lines. Using the mouse pointer to set the Y-axis value Move your mouse pointer over the real-time monitor graph to display the monitored values. If you move the pointer over the X axis, the X-axis value is displayed. If you move the pointer over the Y axis, the Y-axis value is displayed. To change the value (current, voltage, or power) to display on the Y-axis, right-click the monitor graph, and click Y-Axis Value and then Voltage, Current, or Power. 42 SD011-PCR-LE Ver.5.4x Other Settings Changing the graph color You can change the colors of the setting graph and the real-time monitor graph. To change the graph color, on the Graph menu, click Color. Or, right-click the graph of the sequence setting or Run window, and click Color. The ways you can change the colors vary depending on the item that you want to change. Graph menu1 Sequence setting Run window Run window Setting graph3 Monitor graph4 graph2 Background Background color Yes Yes Yes Yes Line Setting line Yes Yes Yes — Line to Draw Line to draw when a setYes ting is made Yes — — Vertical Axis Step-division lines Yes Yes Yes — X/Y-axis X axis and Y axis Yes Yes Yes Yes XY-axes scale lines Grid lines Yes Yes Yes Yes Line to Run Line that indicates the — position being executed — Yes — Current line Output current line — — — Yes Voltage line Output voltage line — — — Yes Power line Output power line — — — Yes 1On the Graph menu, click Color. 2Right-click in the graph window of the sequence setting window, and click Color. 3Right-click the setting graph of the Run window, and click Color. 4Right-click the monitor graph of the Run window, and click Color. SD011-PCR-LE Ver.5.4x 43 Other Settings Changing the file format of sequence setup data You can change the file format of sequence setup data. On the Sequence menu, click Environment Settings to display the Environment Setup window. Under Sequence Data File Format (*.wvy), click Tab Separation or Comma Separation. The default is tab separation. Changing the file format of monitored data You can change the file format of monitored data. On the Sequence menu, click Environment Settings to display the Environment Setup window. Under Monitor Output Data File Format, click Tab Separation or Comma Separation. The default is tab separation. You can also select the file name extension (set File Extension to txt, csv, or log). Additionally, you can enter the extension. 44 SD011-PCR-LE Ver.5.4x Other Settings Changing the window design You can change the Wavy window design. On the Sequence menu, click Environment Settings to display the Environment Setup window. Under “Appearance (activated when Wavy is restarted),” click New menu style or Classic menu style. This setting will take effect when you restart Wavy. Changing the display format of the Graph and Worksheet windows On the Window menu, click Cascade, Tile Horizontally, or Tile Vertically to change the way that setup windows are displayed. Changing the folder that arbitrary waveforms are saved in You can change where the arbitrary waveform data files are saved. The waveforms that you create and edit in the arbitrary waveform window will be saved in this folder. SD011-PCR-LE Ver.5.4x 45 Creating Arbitrary Waveforms You can create and edit arbitrary waveforms in the Arbitrary Waveform window. You can also create arbitrary waveforms by importing text data of measurements taken on instruments such as oscilloscopes and data loggers. Creating a new arbitrary waveform 46 1 On the Sequence menu, click Arbitrary Waveform. 2 Select the arbitrary waveform type. 3 For a square, triangular, or trapezoidal waveform, set the duty ratio. For a peak-clipped waveform, set the crest factor. For a harmonic waveform, set the level, phase, and harmonic order. If you select Arbitrary, enter data directly. The Arbitrary Waveform window appears. There are seven types that you can choose from. Selecting Arbitrary enables you to directly edit arbitrary waveform data. If you select any other type, you cannot edit data directly. • Sine • Square • Triangular • Trapezoidal • Peak-clipped • Harmonics • Arbitrary Arbitrary waveform data is 14 bits high (-8192 to 8191) and 10 bits wide (0 to 1023). Double-click the waveform to select the corresponding data value in the sheet. SD011-PCR-LE Ver.5.4x Creating Arbitrary Waveforms Square Enter the duty ratio, and click Update or press Enter. You cannot directly edit the waveform data. Duty ratio range: 0.1 to 99.9 Triangular Enter the duty ratio, and click Update or press Enter. You cannot directly edit the waveform data. Duty ratio range: 0.0 to 100 SD011-PCR-LE Ver.5.4x 47 Creating Arbitrary Waveforms Trapezoidal Enter the duty ratio, and click Update or press Enter. You cannot directly edit the waveform data. Duty ratio range: 0.0 to 100 Peak-clipped Enter the crest factor, and click Update or press Enter. You cannot directly edit the waveform data. Crest factor range: 48 0.1 to 100.0 SD011-PCR-LE Ver.5.4x Creating Arbitrary Waveforms Harmonics Enter the level and phase in each harmonic order, and click Update or press Enter. You cannot directly edit the waveform data. Level range: 0.00 % to 100.00 % (in 0.01 % steps) Phase range: 0.0 ° to 359.9 ° Harmonic order range: 1st to 50th Arbitrary Change the cell values in the data sheet to edit the Arbitrary Waveform window. Right-click a cell, and select Copy, Paste, or Series Paste to copy or paste data. To paste to consecutive cells, select the cells, right-click, and select Series Paste. The value of the first selected cell will be pasted to the other selected cells. SD011-PCR-LE Ver.5.4x 49 Creating Arbitrary Waveforms 4 To check what the RMS and peak values will be when the PCR-LE outputs the set voltage using the arbitrary waveform data that you created or edited, enter a value in the Set box under RMS, Peak Conversion, and click Update. The RMS and peak values are automatically calculated. 5 To save the data that you have created or edited, click Save. 6 To transfer the saved arbitrary waveform data to a waveform bank, set WB No. (1 to 63) and Phase, and click Write. The extension for arbitrary waveform data files is .arb. The arbitrary waveform data will be transferred to the waveform bank. 7 Click Close. • The maximum number of arbitrary waveforms that can be registered in the PCR-LE is 63. • To transfer arbitrary waveform data to a waveform bank, you need to save the data to a file first. The Wave Bank items are unavailable until you save the data. • Arbitrary waveforms are generated by a special waveform output feature of the PCR-LE. For details, see the PCR-LE Series user’s manual. Editing an existing arbitrary waveform 1 On the Sequence menu, click Arbitrary Waveform. 2 Click Open, and select an arbitrary waveform data file (.arb). 3 Edit the settings, and click Save. 4 To transfer the data to a waveform bank, set WB No. (1 to 63) and Phase (for single-phase, three-wire and for three-phase), and click Write. The Arbitrary Waveform window appears. The data of the selected file appears. The edited data is saved to the file. The arbitrary waveform data will be transferred to the waveform bank. 5 50 Click Close. SD011-PCR-LE Ver.5.4x Creating Arbitrary Waveforms Creating arbitrary waveform data using data from an oscilloscope or other instrument You can create arbitrary waveform data by importing measurement data files of other instruments such as oscilloscopes and data loggers. Wavy can import data files in text format. The maximum number of data values that can be imported is 10000. 1 On the Sequence menu, click Arbitrary Waveform. 2 3 Under Waveforms type, select Arbitrary, and then click Read. 4 Set the minimum and maximum values for the X axis and Y axis, and then click Update or press Enter. The Arbitrary Waveform window appears. Select a data file in text format. The Text Data Conversion window appears. The graph display range will change. 5 SD011-PCR-LE Ver.5.4x Set the start and end positions to specify the range to convert. You can also drag the start and end position lines. When you drag a line, the corresponding data entry in the data sheet is highlighted. You can also set the start and end positions in the following manner. • While holding down the Shift key, double-click the waveform. (The start position line moves to the point you double-clicked.) • While holding down the Ctrl key, double-click the waveform. (The end position line moves to the point you double-clicked.) If you double-click the following locations, the corresponding data on the sheet will be highlighted. • The start or end position label or the start or end position line on the graph • Any specific point on the waveform 51 Creating Arbitrary Waveforms You can right-click the waveform and change the colors of the start and end position lines. 52 6 Click Convert. 7 Click OK. 8 9 Check the minimum and maximum Y-axis values. A confirmation dialog box appears. The data will be converted. X values will be converted into 1024 values. Click Return. The Arbitrary Waveform window appears. The Arbitrary Waveform window shows the converted data. SD011-PCR-LE Ver.5.4x Displaying the Waveform View You can create and edit sequence data while checking arbitrary waveform graphs in the Waveform View. To display the Waveform View window, on the View menu, click Waveform View. Image Select a waveform number to display an image of the corresponding waveform. List (list of waveform banks) Use this tab to read and write waveforms. • When Wavy starts, all waveform names are “SineWave.” • Click Read to read the waveform data from the PCR-LE. The data is automatically saved to files (.arb). File names are automatically assigned on the basis of wiring methods and waveform bank numbers. For example, the file name “WaveIP2W_U_01.arb” indicates that the wiring method is single-phase, two-wire (1P2W) and that the waveform bank number is 01. The files are saved to the “Arbitrary Waveform Folder” that is specified in the Environment Setup window. A file with the same name is overwritten. SD011-PCR-LE Ver.5.4x 53 Using Wavy to Control a Power Supply You can use Wavy to remotely control a PCR-LE. On the Tool menu, click Direct Control to display the Remote Control Panel window. Single-phase, two-wire Single-phase, three-wire 54 SD011-PCR-LE Ver.5.4x Using Wavy to Control a Power Supply Three-phase You can control the output voltage mode, output voltage range, AC voltage settings, DC voltage settings, frequency settings, waveform bank, output on and off phases, output voltage measurement, output current measurement, peak current hold, peak current clear, and voltage, current, and power monitors. Set all the maximums and minimums to values that are within the specifications of the PCR-LE that the software is connected to. Output voltage mode Set the output voltage mode. Select AC voltage, DC voltage, or AC+DC voltage. Setting the AC voltage, DC voltage, and frequency Enter values for the AC voltage, DC voltage, and frequency, and then click Set. The settings are transmitted to the PCR-LE. For single-phase, two-wire, you can also enter step values in the Step boxes and then use the up and down arrow buttons to change the voltage, current, and frequency. For single-phase, three-wire and for three-phase, if you want to set all phases to the same voltage at once, select the “All Phase setting” check box. You can set the frequency when the output voltage mode is set to AC or AC+DC. Output voltage measurement and output current measurement Select how to display the voltage and current monitored values. Select RMS, Peak, or Average. You can select Average only in DC mode. Output voltage range (L or H) Set the voltage range that is used when the output is turned on. Select L or H. SD011-PCR-LE Ver.5.4x 55 Using Wavy to Control a Power Supply Wave bank Set a waveform that is registered in a waveform bank. Select a number from the WB No. list (0 to 63), check the waveform name that appears, and click Set. The settings are transmitted to the PCR-LE. You can select the waveform bank only in AC and AC+DC modes. Note that the wave bank needs to be synchronized beforehand between the PCR-LE and Wavy. To synchronize the wave bank, click Read button on the List tab in the Waveform View window. Turning the output on and off Click ON to turn the output on. Click OFF to turn the output off. The current state of the PCR-LE is displayed. Output on and off phases Set the on and off phase angles of the AC output. Select the “Output on phase” and “Output off phase” check boxes, enter the phase angles (0 deg to 359 deg), and then press Set. The settings are transmitted to the PCR-LE. You can select the phases only in AC and AC+DC modes. Monitor Click Run to start monitoring. Click Stop to stop monitoring. The time that has elapsed since monitoring began is displayed. You can set the monitor interval when monitoring is not running. Select the Save File check box to save monitored output values to a file. Click Folder to select the save destination and the unit of the elapsed time that is output to the file. The accuracy of the elapsed time varies depending on the PC environment that you are using. [s]: Seconds [h:min:s]: Hours, minutes, seconds The file name will be a concatenation of the operation mode and the execution start date and time followed by the extension. You can change the extension (the default is .txt). If the output voltage mode is AC or AC+DC, you can select the Power Factor check box to display the power factor. Holding the peak current If you set the output current measurement to peak, the peak current can be held. Enter the hold time, and then click Set. The settings are transmitted to the PCR-LE. You can enter a value between 0 s and 10 s or infinity. To specify infinity, enter a value greater than 10. Clearing the peak current To clear the peak current, click Clear under “Clears the peak current.” Phase setting Select U-V phase difference and U-W phase difference (3P only), enter phase angles (0 to 359 °), and click Set. The settings are transmitted to the PCR-LE. RMS conversion Based on the phase voltage, phase angle, and arbitrary waveform data, the converted RMS voltage between phases are displayed. If you change the phase voltage or phase angle settings or change the waveform bank, the display will change. 56 SD011-PCR-LE Ver.5.4x Using Commands to Control a Power Supply You can transmit PCR-LE commands from Wavy to control a PCR-LE. On the Tool menu, click Command Control to display the Command Control window. Enter a command, and then click Run. The result will be displayed. The command transmission log (only the commands that were successfully transmitted and received) is recorded in the list box. Click Clear to delete this log. For details on commands, see the PCR-LE Communication Interface Manual. SD011-PCR-LE Ver.5.4x 57 Menu Reference File New1 Creates a new file. Open1 Open an existing file. Save1 Overwrites the file that you are working on. Save As Saves the file that you are working on with a new name. Close Closes the file that you are working on. Recent files Open a recent file. Send Sends or distributes the file that you are working on in an email. Exit Exits the Wavy application and asks if you want to save any unsaved changes to a file. View Toolbar Shows and hides the toolbar. Status Bar Shows and hides the status bar. Save Position Selects whether to save the window position and size. Previous File Selects whether to load the last file that was used when the software starts. Waveform View Shows the waveform view. Graph Transition Ramp Changes the selected line to a ramp transition. Step Changes the selected line to a step transition. Delete Deletes the selected line. Vertical Axis Shows and hides the vertical axis. X-axis Scale Lines1 Shows and hides the X-axis grid lines. Y-axis Scale Lines1 Shows and hides the Y-axis grid lines. Scale1 Changes the X-axis and Y-axis scale lines. 1 Color Background Change the background color of the graph. Line Change the step line color. Line to Draw Change the line color that is used when you use the mouse to draw lines. Vertical Axis Change the vertical-axis color. X/Y-axis Change the X-axis and Y-axis colors. XY-axes scale lines Change the colors of the X-axis and Y-axis grid lines. Resolution of time Default period 1st digit of integer Sets the time resolution of drawn lines. 1st digit of decimal place 2nd digit of decimal place 58 SD011-PCR-LE Ver.5.4x Menu Reference Resolution of setting value Default Sets the voltage resolution of drawn lines. 1st digit of integer 1st digit of decimal place 2nd digit of decimal place 3rd digit of decimal place Draw sequence by step Sets the lines to draw to step transition. Copy Copies the graph screen to the clipboard. Update Auto Scale Applies auto scaling to the graph screen. Worksheet Select All Undo 1 Selects all cells. Undoes the previous operation. Delete1 Deletes step data. Copy1 Copies step data. Paste1 Inserts the copied step data. Sequence Transfer Read and write sequence data. Run1 Run the sequence. Sequence Mode1 Set the operation mode of the sequence. Monitoring Setup1 Configure monitor settings used during sequence execution. Protection Setup Set OVP, OCP, UVP, and UCP. Arbitrary Waveform Create and edit arbitrary waveforms. Interface Set the conditions that are used to connect to the device. Environment Settings Set the text file format. Tool Direct Control Control the connected device directly. Command Control Enter commands to control the connected device. Window Cascade Displays cascaded windows. Tile Horizontally Displays horizontally tiled windows. Tile Vertically Displays vertically tiled windows. Arrange Icons Arranges icons at the bottom of the window. Help Help Topics Opens the help file. About Wavy1 Displays the program information, version, and copyright. 1 SD011-PCR-LE Ver.5.4x There is also a toolbar button for this command. 59