1
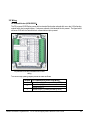
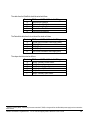
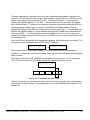
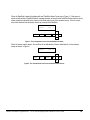
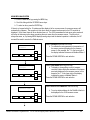
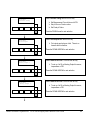
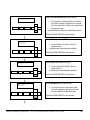
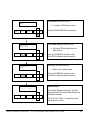
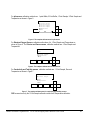
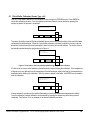
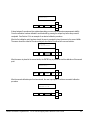
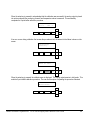
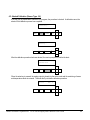
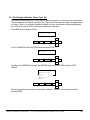
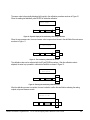
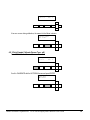
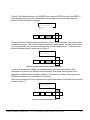
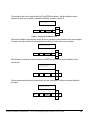
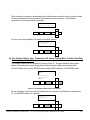
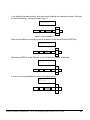
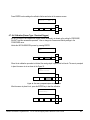
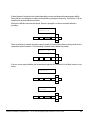
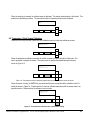
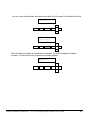
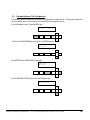
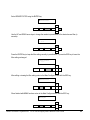
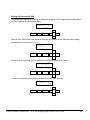
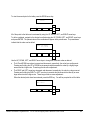
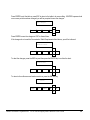
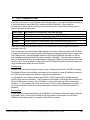
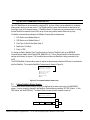
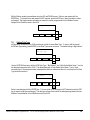
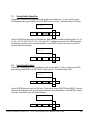
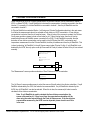
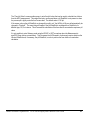
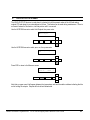
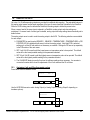
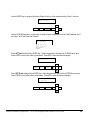
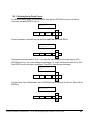
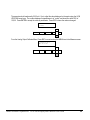
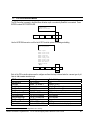
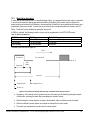
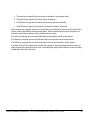
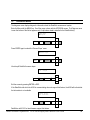
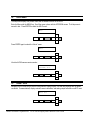
The sensor value is dynamically displayed at this point in the calibration procedure as shown in Figure 10.
When the reading has stabilized, press ENTER to initiate the calibration.
991.3 µS/cm
Sensor ready?
▲
MENU
ESC
ENTER
◄
►
▼
Figure 10: Dynamic display of the conductivity value during calibration.
When the user presses enter, the current sensor value is captured and shown in the edit field of the next screen
as shown in Figure 11.
1-Point Sample?
(
991.3) µS/cm
▲
MENU
ESC
ENTER
◄
►
▼
Figure 11: The conductivity calibration edit screen.
The calibration value can be adjusted with the UP and DOWN arrow keys. After the calibration value is
adjusted, the enter key is pressed to calibrate the DataStick as shown in Figure 12.
1-Point Sample?
( 1000) µS/cm
▲
MENU
ESC
ENTER
◄
►
▼
Figure 12: Entering the conductivity calibration value.
After the calibration process is complete, the user is asked to confirm the result before releasing the analog
outputs, relays and measure screen.
1-Point Sample
Confirm cal OK?
▲
MENU
ESC
ENTER
◄
►
▼
Thermo Scientific AquaSensors™ AV38 Local Display and Controller User Guide
35