1
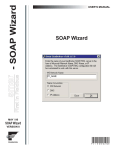
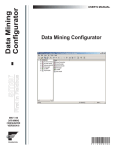
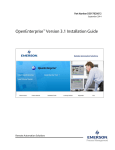
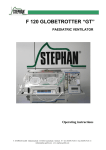
USER’S MANUAL
MAY / 06
VERSION 8
FOUNDATION
P V I E WU D C M E
www.smar.com
Specifications and information are subject to change without notice.
Up-to-date address information is available on our website.
web: www.smar.com/contactus.asp
Unified Data Configurator
TABLE OF CONTENTS
INTRODUCTION TO VCRWORX DATA REPLAY ..........................................................................5
STARTING THE UNIFIED DATA CONFIGURATOR .....................................................................................................5
TOOLBAR .......................................................................................................................................................................6
MENUS ...........................................................................................................................................................................7
FILE MENU................................................................................................................................................................................... 7
CONNECTING TO CONFIGURATION DATABASES .................................................................................................................. 7
UPDATING CONFIGURATION DATA.......................................................................................................................................... 8
EDIT MENU .................................................................................................................................................................................. 9
RESOLVING DATA SOURCES.................................................................................................................................................. 10
CONFIGURING TRENDWORX LOGGER GROUPS...................................................................................................12
VIEW MENU ............................................................................................................................................................................... 13
SELECTING LANGUAGES ........................................................................................................................................................ 14
TOOLS MENU ............................................................................................................................................................................ 15
APPLICATION OPTIONS ........................................................................................................................................................... 15
UPDATE VCRWORX CONVERSION TABLE ..............................................................................................................16
VCRWORX OPTIONS ..................................................................................................................................................17
HELP MENU ............................................................................................................................................................................... 18
CONFIGURING VCRWORX DATA REPLAY...............................................................................................................18
CONFIGURING VCRWORX DATA USING EXISTING DATABASES .........................................................................18
CONFIGURING VCRWORX DATA USING NEW DATABASES .................................................................................21
ADDING TAGS FROM A GRAPHWORX DISPLAY .....................................................................................................23
CONFIGURING ALARM TAGS AND TREND PENS ...................................................................................................26
ALARMS TAB ............................................................................................................................................................................. 27
TRENDS TAB ............................................................................................................................................................................. 28
VCRWORX DATA REPLAY..........................................................................................................................................29
III
Unified Data Configurator
IV
Unified Data Configurator
INTRODUCTION TO VCRWORX DATA
REPLAY
VCRWorX is a powerful tool in ProcessView that enables the replay and reanimation of graphical,
historical and alarm data. Features of VCRWorX replay include:
•
Replay of OPC data.
•
Reanimation of graphics.
•
Re-plotting of trends.
•
See what the operator saw through replay of graphical displays.
•
VCRWorX Control Panel with customizable skins/layouts.
•
Change the replay speed.
•
Specify time and date ranges for data replay.
•
Search for key events, tags, and expressions.
VCRWorX replays historical data from the active TrendWorX Logger and AlarmWorX Server
configuration databases. The Unified Data Configurator enables you to select existing configuration
databases or create new databases for VCRWorX data replay.
Starting the Unified Data Configurator
To start the Unified Data Configurator:
1.
From the Windows Start menu, select Programs > Smar ProcessView > Tools > Unified
Data Configurator.
2.
This opens the Configurator, as shown in the figure below. The screen consists of a split
window with a tree control view in the left-hand pane and a configuration view in the right-hand
pane and the bottom pane. The Configurator also includes a toolbar and menus with many
command functions.
5
Unified Data Configurator
Configurator Screen
Toolbar
To show or hide the toolbar, select Toolbar from the View menu. The toolbar, shown below,
contains the following command buttons.
Toolbar
6
•
Connect to Configurations: Connects to TrendWorX Logger and AlarmWorX Server
configuration databases.
•
Disconnect: Disconnects from connected AlarmWorX Server and TrendWorX Logger
configuration databases.
•
Refresh: Refreshes the data for the entire Configurator screen.
•
Toggle View: Toggles between the full GraphWorX preview display and the zoomed view.
•
Toggle Highlight: Shows/hides highlight tags within GraphWorX preview displays.
•
Add All Tags: Adds all tags from the previewed GraphWorX display to the configuration.
•
Add Selected Tags: Adds a selected tag from the previewed GraphWorX display to the
configuration.
•
Resolve Data Sources: Resolves aliases in previewed GraphWorX displays.
•
Delete Resolved Tags: Deletes selected resolved aliases.
•
Insert OPC Tags: Opens the Unified Data Browser, which enables you to insert tags into the
configuration.
Introduction to VCRWorX Data Replay
•
Insert Expression: Opens the Expression Editor, which allows you to insert an expression
into the configuration.
•
Delete Selected Tags: Removes currently selected tags from the configuration window.
•
Delete All Tags: Removes all tags from the configuration window.
•
Add New Alarm: Creates a new alarm in the connected AlarmWorX Server configuration
database.
•
Remove Selected Alarms: Removes currently selected alarms from the configuration
window.
•
Remove All Alarms: Deletes all alarms associated with the selected tag.
•
Add New Trend: Creates a new trend in the connected TrendWorX Logger configuration
database.
•
Remove Selected Trends: Removes currently selected trends from the configuration window.
•
Remove All Trends: Deletes all trends associated with the selected tag.
Menus
The menu bar of the Configurator contains the following menus:
•
File
•
Edit
•
View
•
Tools
•
Help
NOTE
You can also access many of the menu commands by right-clicking items in the tree control of
the Configurator and selecting command functions from the pop-up menus.
File Menu
The File menu commands are listed in the table below.
File Menu Commands
COMMAND
Connect to
Configurations
SHORTCUT KEY
CTRL+O
Disconnect
Update
Configurations
Exit
CTRL+S
FUNCTION
Connects to AlarmWorX Server and TrendWorX Logger
configuration databases.
Disconnects from connected AlarmWorX Server and
TrendWorX Logger configuration databases.
Updates connected AlarmWorX Server and TrendWorX
Logger configuration databases with new information
added in the Configurator.
Closes the application.
Connecting to Configuration Databases
To connect to AlarmWorX Server and TrendWorX Logger configuration databases.
1.
Select Connect to Configurations from the File menu, as shown in the figure below.
7
Unified Data Configurator
Connecting to Configuration Databases
2.
If you want to use the currently active configuration databases, click on the Active button for
both the TrendWorX and AlarmWorX configuration databases. Or you can click the … button
to select different databases. Click the Connect button. Or you can click the New button to
create new databases. Also, if you dot not want to use a specific type of configuration
database (i.e. TrendWorX or AlarmWorX, click the None button.
Specifying AlarmWorX and TrendWorX Configuration Databases
Updating Configuration Data
If you make changes (e.g. add or remove tags) to the VCRWorX configuration database, you need
to update the information in the AlarmWorX and TrendWorX configuration databases:
1.
Select Update Configurations from the File menu, as shown in the figure below.
Updating AlarmWorX and TrendWorX Configuration Databases
8
Introduction to VCRWorX Data Replay
2.
Check the Update VCRWorX Conversion Table check box, and then click the Settings
button, as shown in the figure below.
Updating VCRWorX Conversion Table
3.
Choose whether to overwrite the existing VCRWorX conversion table or to create a new one.
Click the OK button.
VCRWorX Conversion Table Options
4.
Click the Update button.
Edit Menu
The Edit menu commands are listed in the table below.
Edit Menu Commands
COMMAND
Add Selected Tags
Add All Tags
Resolve Data
Sources
Delete Resolved
Tags
Insert OPC Tags
SHORTCUT
KEY
FUNCTION
Adds a selected tag from the previewed GraphWorX display to
the configuration.
Adds all tags from the previewed GraphWorX display to the
CTRL+Enter
configuration.
CTRL+R
Resolves aliases in previewed GraphWorX displays.
Deletes selected resolved aliases.
CTRL+W
Opens the Unified Data Browser, which enables you to insert
9
Unified Data Configurator
COMMAND
Insert Expression
SHORTCUT
KEY
CTRL+E
Delete Unused
Tags
Delete Selected
Tags
Delete All Tags
FUNCTION
OPC tags into the configuration. Please refer to the Unified
Data Browser help documentation for more information.
Opens the Expression Editor, which allows you to insert an
expression into the configuration. Please refer to the
Expression Editor help documentation for more information
about creating expressions.
Deletes tags without alarms and trends.
Removes currently selected tags from the configuration
window.
Removes all tags from the configuration window.
CTRL+SHIF Creates a new alarm in the connected AlarmWorX Server
Add Alarm
T+A
configuration database.
Remove Selected
Removes currently selected alarms from the configuration
Alarms
window.
Remove All Alarms
Deletes all alarms associated with the selected tag.
CTRL+SHIF Creates a new trend in the connected TrendWorX Logger
Add Trend
T+T
configuration database.
Allows you to create new TrendWorX logging groups and
database groups for the connected TrendWorX Logger
Logging Groups
CTRL+G
configuration database.
Remove Selected
Removes currently selected trends from the configuration
Trends
window.
Remove All Trends
Deletes all trends associated with the selected tag.
Resolving Data Sources
If a GraphWorX display contains aliases, you can resolve the aliases before they are added to the
VCRWorX configuration:
1.
In the top left pane of the Unified Configurator, select a GraphWorX (.gdf) display file from the
tree control. The GraphWorX display preview is shown in the top middle pane, and all the tags
and aliases contained in the GraphWorX display are shown in the top right pane, as shown in
the figure below. To resolve aliases in the GraphWorX display, right-click on an alias and
select Resolve Data Sources from the pop-up menu, as shown in the figure below.
Resolving Data Sources in a GraphWorX Display
2.
10
The Alias Resolution dialog box opens, as shown in the figure below.
Introduction to VCRWorX Data Replay
Alias Resolution Dialog Box
3.
Clicking the Add Aliases button displays the list of aliases contained in the previewed
GraphWorX display, as shown in the figure below. Select one or more aliases, and then click
OK.
Adding Aliases
4.
The selected alias is added to the Alias Resolution dialog box, as shown in the figure below.
Alias Added to Alias Resolution Dialog Box
11
Unified Data Configurator
5.
To resolve an alias, select the alias and click the Resolve As button. This opens the Resolve
Aliases As dialog box, as shown in the figure below. This dialog box displays strings used to
resolve the alias. To add a string to the list, click the Add button and then enter a new string
name. To add a tag to the list, click the OPC Tags button and select a tag from the Unified
Data Browser. To modify the currently selected string, click the Change button and rename the
string. To delete a string from the list, click the Remove button. Click OK.
Resolving Aliases
6.
In the Alias Resolution dialog box, select the aliases you want resolve, and choose Selected
Items, as shown in the figure below. Or, if you want to resolve all aliases, select All Items.
Then click the Resolve button.
Resolving the Selected Aliases
Configuring TrendWorX Logger Groups
TrendWorX Logger databases are primarily configured through the TrendWorX Logger Configurator.
However, the Unified Data Configurator provides a dialog box that allows you to create new
database groups and logging groups. Selecting Logging Groups from the Edit menu opens the
TrendWorX Groups Properties dialog box, as shown in the figure below. This dialog box displays
the database groups and logging groups in the active TrendWorX Logger configuration.
To create a new database connection, click the New Database Group button, as shown in the
figure below. The database properties are shown in the dialog box.
12
Introduction to VCRWorX Data Replay
Configuring TrendWorX Database Groups
To create a new logging group connection, click the New Logging Group button, as shown in the
figure below. You can specify logging group start and stop conditions.
NOTE
For complete information about configuring TrendWorX Logger configuration databases, please
refer to the TrendWorX Logger Configurator help documentation.
Configuring TrendWorX Logging Groups
View Menu
The View menu commands are listed in the table below.
View Menu Commands
COMMAND SHORTCUT KEY
FUNCTION
Toolbar
Toggles the toolbar.
Status Bar
Toggles the status bar.
Set
Initial CTRL+ALT+I
Sets the currently selected directory as the initial folder. The
13
Unified Data Configurator
COMMAND
Folder
SHORTCUT KEY
F2
F3
F4
F5
FUNCTION
next time you start the Configurator, it will automatically open
to this folder.
Opens the GraphWorX display shown in the preview window.
Toggles between the full GraphWorX preview display and the
zoomed view.
Shows/hides highlight of objects with data sources or tags
inside the GraphWorX display.
Displays all tags in the configuration window.
Displays all alarms in the configuration window.
Displays all trends in the configuration window.
Shows the properties for the selected alarm.
F6
Shows the properties for the selected trend.
CTRL+ALT+U
Opens the Select Language dialog box (see below). Choose
the language you wish to use for your system (Unicode version
only) and click OK. For navigation purposes, use the buttons
and check boxes in the List section.
Open Display CTRL+D
Full View
Show
Selection
Tags
Alarms
Trends
Alarm
Properties
Trend
Properties
Select
Language
Selecting Languages
The Select Language function on the View menu allows you to choose which language to use in
your display. Choosing Select Language from the View menu opens the Select Language dialog
box, shown in the figure below.
NOTE
A language resource .dll is required for language switching.
Select Language Dialog Box
Define the parameters listed in the table below. Then click OK to return to the work area.
Select Language Parameters
PARAMETER
List
14
DESCRIPTION
Lists available languages. Depending on which item you have
selected, the view on the left will change. If English is
checked, the languages will appear as their English name. If
Localized is checked, the languages will appear with the native
country in parentheses (for languages with several dialects
only). When Native is checked, the languages are displayed
the way they would be written in that language.
Introduction to VCRWorX Data Replay
PARAMETER
DESCRIPTION
Installed Locales Only
If this is checked, local languages appear in the box.
Available Language
Translations Only
Checking this box allows you to choose from available
language translations only.
Tools Menu
The Tools menu commands are listed in the table below.
Tools Menu Commands
COMMAND
Options
FUNCTION
Opens the Application Options dialog box, which sets the startup
settings, display preview, and configuration settings.
VCRWorX Conversion
Table
Creates/updates the VCRWorX conversion table.
VCRWorX Options
Opens the VCRWorX Options dialog box, which configures the
settings and application preferences for the VCRWorX Server.
Application Options
Selecting Options from the Tools menu opens the Application Options dialog box, as shown in
the figure below.
Application Options
Startup Settings
When the Connect to last opened databases check box is checked, the next time the Configurator
is opened it will automatically attempt to connect to the previously opened TrendWorX Logger and
AlarmWorX Server configuration databases.
15
Unified Data Configurator
Display Preview
The Initial Folder field specifies a directory as the initial folder for selecting GraphWorX displays, as
shown in the figure below. Click the … button to choose a directory. The next time you start the
Configurator, it will automatically open to this folder.
When a GraphWorX display (.gdf) file is selected from this folder in the Unified Data Configurator, a
preview of the display is shown in the middle pane. Any tags or data items in the display file will be
highlighted so you can easily identify the tags, as shown in the figure below.
Tags Highlighted in GraphWorX Display
You can change the highlight colors for objects with data sources or tags:
•
Line Color: Click on the color box to choose a color for the tag text from the Color Palette.
•
Fill Color: Click on the color box to choose a color for the fill from the Color Palette.
•
Shadow Color: Click on the color box to choose a color for the shadow from the Color Palette.
For previewed GraphWorX displays that contain aliases, checking the Auto-resolve aliases in
previewed display check box automatically resolves all aliases used inside the displays.
Configuration Settings
Checking the Auto-apply configuration changes check box allows changes to the configuration
database to be saved each time you switch dialogs without clicking on the Apply button or being
shown a message asking if you would like to apply changes.
Update VCRWorX Conversion Table
The trend tags that you configure in the Unified Data Configurator are stored in a VCRWorX
Conversion Table file called VCRWorX.vcr, as shown in the figure below. This default active file is
located in the C:\Program Files\Smar\ProcessView\Bin directory.
VCRWorX Conversion Table
This file enables VCRWorX data replay. Whenever you make changes to your tags, you need to
update this file by selecting VCRWorX Conversion Table from the Tools menu. Choose whether to
overwrite the existing VCRWorX conversion table or to create a new one. Click the OK button. Only
one conversion table can be active. To activate the conversion table, check the Set As Active
Table check box.
16
Introduction to VCRWorX Data Replay
Updating the VCRWorX Conversion Table
VCRWorX Options
Selecting VCRWorX Options from the Tools menu opens the VCRWorX Options dialog box,
shown in the figure below, which configures the following settings and application preferences for
the VCRWorX Server:
VCRWorX Options Dialog Box
•
Scan Rate: Specifies a scan rate for the VCRWorX Server database updates.
•
Enable Cache: Allows for caching of data in the VCRWorX Server.
•
Size: Specifies the amount of time (in seconds) to cache data.
•
Block Size: Specifies the length (in seconds) of the block of data to be read from the database
at once.
•
Active Table: The trend tags that you configure in the Unified Data Configurator are stored in
a VCRWorX Conversion Table file called VCRWorX.vcr, This default active file is located in
the C:\Program Files\Smar\ProcessView\Bin directory.
•
Connection to Alarm Logger Database: Displays the connection string to a database with
logged alarms that VCRWorX will use for replaying.
17
Unified Data Configurator
NOTES
Although the AlarmWorX Logger can log data to multiple databases, VCRWorX can only replay
alarms from one database.
VCRWorX alarm replay does not support alarms coming from Oracle databases.
•
Table Name: Specifies a table in the specified database.
•
Select from DSN: Connects to an ODBC data source through the Windows Select Data
Source dialog box.
Help Menu
The Help menu commands are listed in the table below.
COMMAND
Help Topics
SHORTCUT KEY
F1
About Application
FUNCTION
Launches the online Help for the Configurator.
Launches the About Box, which contains
information about the product version number,
copyright, and available disk space. It also contains
contact information.
Configuring VCRWorX Data Replay
VCRWorX Data Replay requires the following basic steps:
•
Step 1: Create a GraphWorX (.gdf) display that includes the tags that you want to log to the
trend logger database or the alarm logger database.
•
Step 2: Configure a VCRWorX data-logging configuration database using the Unified Data
Configurator. Select the GraphWorX display that you created, and add the tags to the
VCRWorX configuration.
•
Step 3: Activate the selected TrendWorX Logger and AlarmWorX Server configuration
databases and configurations.
•
Step 4: Enter the GraphWorX display into runtime mode, and then use the VCRWorX Control
Panel to view the tags in playback mode.
These steps are covered in detail in the sections below.
Configuring VCRWorX Data Using Existing Databases
To set up VCRWorX replay using existing AlarmWorX Server and TrendWorX Logger configuration
databases:
1.
Start the Unified Data Configurator from the Windows Start menu by selecting Programs >
Smar ProcessView > Tools > Unified Data Configurator.
2.
Select Connect to Configurations from the File menu, as shown in the figure below.
Connecting to Configuration Databases
18
Introduction to VCRWorX Data Replay
3.
If you want to use the currently active configuration databases, click on the Active button for
both the TrendWorX and AlarmWorX configuration databases. Or you can click the … buttons
to select different databases. Click the Connect button.
Specifying AlarmWorX and TrendWorX Configuration Databases
4.
The tags for both databases are listed in the bottom left hand pane, as shown in the figure
below. Red dot icons indicate alarm tags, and little squares indicate trend pens. Some tags
may be both alarms and trends.
NOTE
You can add new tags. You can have multiple alarms per tag, and you can have multiple pens
per tag, and within different logging groups.
19
Unified Data Configurator
Tags From Connected Databases
5.
Select Update Configurations from the File menu, as shown in the figure below.
Updating AlarmWorX and TrendWorX Configuration Databases
6.
20
Check the Update VCRWorX Conversion Table check box, and then click the Settings
button, as shown in the figure below.
Introduction to VCRWorX Data Replay
Updating VCRWorX Conversion Table
7.
Choose whether to overwrite the existing VCRWorX conversion table or to create a new one.
Click the OK button.
VCRWorX Conversion Table Options
8.
Click the Update button. Close out of the Unified Data Configurator.
Configuring VCRWorX Data Using New Databases
To set up VCRWorX replay using new AlarmWorX Server and TrendWorX Logger configuration
databases:
1.
Start the Unified Data Configurator from the Windows Start menu by selecting Programs >
Smar ProcessView > Tools > Unified Data Configurator.
2.
Select Connect to Configurations from the File menu, as shown in the figure below.
21
Unified Data Configurator
Connecting to Configuration Databases
3.
Click the New button for the TrendWorX and AlarmWorX configuration databases. Name the
new databases, and then click the Save button. Then click the Connect button.
Specifying AlarmWorX and TrendWorX Configuration Databases
4.
TrendWorX Logger databases are primarily configured through the TrendWorX Logger
Configurator. However, the Unified Data Configurator provides a dialog box that allows you to
create new database groups and logging groups. Select Logging Groups from the Edit menu.
5.
This opens the TrendWorX Groups Properties dialog box. To create a new database
connection, click the New Database Group button, as shown in the figure below. This opens
the Select Data Source dialog box, which allows you to create your database connection.
NOTE
For complete information about configuring TrendWorX Logger configuration databases, please
refer to the TrendWorX Logger Configurator help documentation.
22
Introduction to VCRWorX Data Replay
Configuring TrendWorX Database Groups
6.
To create a new logging group connection, click the New Logging Group button, as shown in
the figure below. You can specify logging group start and stop conditions. Click the Apply
button when you are finished.
Configuring TrendWorX Logging Groups
Adding Tags From a GraphWorX Display
Once you have created your VCRWorX configuration database, the next step is to add tags to the
database for VCRWorX data replay. You can easily do this by selecting tags from your GraphWorX
displays:
1.
In the top left pane of the Unified Configurator, select a GraphWorX (.gdf) display file from the
tree control. The GraphWorX display preview is shown in the top middle pane, and all the tags
contained in the GraphWorX display are shown in the top right pane, as shown in the figure
below.
23
Unified Data Configurator
GraphWorX Tags Displayed in Unified Data Configurator
2.
To add tags from the GraphWorX display to the VCRWorX configuration, right-click a tag and
select Add All Tags from the pop-up menu, as shown in the figure below.
NOTE
You can add tags only when you are connected to databases. Otherwise the Add Selected
Tags and Add All Tags menu commands will be unavailable.
Adding Tags to Configuration
3.
A green arrow appears beside each tag name indicating that the tags have been added to the
VCRWorX configuration database, as shown in the figure below.
All Tags Added to Configuration
4.
24
The tags are listed in the bottom left pane, as shown in the figure below. Red dot icons indicate
alarm tags, and little squares indicate trend pens. Some tags may be both alarms and trends.
If a tag has a question mark icon next to it, you must designate the tag as either an alarm tag
or a trend tag (or both). Right-click on the tag name and select Add Alarm or Add Trend from
the pop-up menu, as shown in the figure below. The tag properties are then displayed in the
Alarms or Trends tabs in the dialog boxes in the lower right pane of the Configurator.
Introduction to VCRWorX Data Replay
NOTE
You can add new tags. You can have multiple alarms per tag, and you can have multiple pens
per tag, and within different logging groups.
Specifying Alarm or Trend Tags
5.
Select Update Configurations from the File menu, as shown in the figure below.
Updating AlarmWorX and TrendWorX Configuration Databases
6.
Check the Update VCRWorX Conversion Table check box, and then click the Settings
button, as shown in the figure below.
25
Unified Data Configurator
Updating VCRWorX Conversion Table
7.
Choose whether to overwrite the existing VCRWorX conversion table or to create a new one.
Click the OK button.
VCRWorX Conversion Table Options
8.
Click the Update button. Close out of the Unified Data Configurator.
9.
Now you must activate the new AlarmWorX Server and TrendWorX Logger configuration
databases as well as the configurations.
NOTE
For complete information about configuring AlarmWorX Server and TrendWorX Logger
configuration databases, please refer to the AlarmWorX Server and TrendWorX Logger
Configurator help documentation.
Configuring Alarm Tags and Trend Pens
All alarm tags and trend pens in the VCRWorX configuration database are configured in the bottom
pane of the Unified Data Configurator, as shown in the figure below. Red dot icons indicate alarm
tags, and little squares indicate trend pens. Some tags may be both alarms and trends. If a tag has
a question mark icon next to it, you must designate the tag as either an alarm tag or a trend tag (or
both). Right-click on the tag name and select Add Alarm or Add Trend from the pop-up menu, as
shown in the figure below. The tag properties are then displayed in the Alarms tab or Trends tab in
the dialog boxes in the lower right pane of the Configurator.
26
Introduction to VCRWorX Data Replay
NOTE
You can add new tags, have multiple alarms per tag, and have multiple pens per tag and within
different logging groups. If you are connected only to a TrendWorX Logger configuration
database but not an AlarmWorX Server configuration database, then the Add Alarm command
on the menu will be unavailable. Similarly, if you are connected only to an AlarmWorX Server
configuration database but not a TrendWorX Logger configuration database, then the Add
Trend command on the menu will be unavailable.
Configuring Alarm Tags and Trend Pens
As you can see in the figure above, right-clicking on a tag allows you to select the following
commands from the pop-up menu:
•
Add Alarm: Adds an alarm to the Alarms tab dialog in the bottom right pane.
•
Add Trend: Adds a trend to the Trends tab dialog in the bottom right pane.
•
Remove All Alarms: Deletes all alarms associated with the selected tag.
•
Remove All Trends: Deletes all trends associated with the selected tag.
•
Insert OPC Tags: Opens the Unified Data Browser, which enables you to insert OPC tags into
the configuration.
•
Insert Expression: Opens the Expression Editor, which allows you to insert an expression
into the configuration.
•
Delete Selected Tags: Removes the selected tags from the configuration.
•
Delete All Tags: Removes all tags from the configuration.
Alarms Tab
The Alarms tab in the bottom right pane of the Unified Data Configurator, shown in the figure below,
displays all alarms contained in the tags selected in the bottom left pane. Here you can see all the
properties for the alarms as configured in the AlarmWorX Server configuration database. If you
make any changes to the alarm tag properties, you need to select Update Configurations from the
File menu to apply the changes to the AlarmWorX Server configuration database.
NOTE
For complete information about alarm tag configuration properties, please refer to the
AlarmWorX Server Configurator help documentation.
27
Unified Data Configurator
Alarms Tab
Trends Tab
The Trends tab in the bottom right pane of the Unified Data Configurator, shown in the figure below,
displays all trends contained in the tags selected in the bottom left pane. Here you can see all the
properties for the trends as configured in the TrendWorX Logger configuration database. If you
make any changes to the trend properties, you need to select Update Configurations from the File
menu to apply the changes to the TrendWorX Logger configuration database.
NOTE
For complete information about trend tag configuration properties, please refer to the TrendWorX
Logger Configurator help documentation.
28
Introduction to VCRWorX Data Replay
Trends Tab
VCRWorX Data Replay
Once you have configured your database connections and tags using the Unified Data Configurator,
you are ready to prepare for VCRWorX data replay:
1.
Start data logging in the AlarmWorX Logger Configurator and the TrendWorX Logger
Configurator. It is recommended that you let the data loggers run for at least 30 minutes so
that you will have adequate data for data logging. To replay VCR data, there should be a
substantial time delay between the current time and the VCRWorX replay time. For example, if
you start data logging at 11 AM, you cannot start replaying data until 11:20 AM. This "safe"
delay time is twice the block size specified in the Unified Data Configurator. The default block
size is 10 minutes. So the safe delay should be at least 20 minutes. This is for shorter logging
rates (logging to disk less than 5 minutes). For longer logging rates (more than 5 minutes) the
safe delay should be twice the block size plus the logging rate. For example, if you are logging
data every 15 minutes, then the safe delay should be at least 20+15 = 35 minutes. For more
information please refer to the AlarmWorX Logger Configurator and TrendWorX Logger
Configurator help documentation.
NOTE
Although the AlarmWorX Logger can log data to multiple databases, VCRWorX can only replay
alarms from one database. The Alarm Snapshots section of the Database Logging tab in the
AlarmWorX Logger Configurator, shown in the figure below, allows you to create a "snapshot"
table that can be used to replay alarm data in VCRWorX. In the Snapshots Period field, specify
how often (in hours) a snapshot table can be created. A snapshot period value of "0" (zero)
means that no snapshot table will be created. For VCRWorX data replay to work with alarms, the
value of the snapshot period must be greater than "0." For more information please refer to the
AlarmWorX Logger Configurator help documentation.
29
Unified Data Configurator
Alarm Snapshots in Alarm Logger Configurator
2.
Start GraphWorX and open the .gdf file that you configured in the Unified Data Configurator.
3.
Start runtime mode in GraphWorX.
4.
Select VCRWorX from the GraphWorX Tools menu, as shown in the figure below.
Launching the VCRWorX Control Panel
5.
This opens the VCRWorX Control Panel, as shown in the figure below.
VCRWorX Control Panel
6.
30
Click on the time field. Enter a date and time from which to begin the data replay. Click OK.
Introduction to VCRWorX Data Replay
Entering a Start Date and Start Time
7.
Press the Play button on the VCRWorX Control Panel, as shown in the figure below.
Starting VCRWorX Replay
8.
The GraphWorX display goes into VCRWorX historical replay mode based on the time and
date you provided. Now you can see the process point values and ActiveX controls update in
the GraphWorX display, and you can see the time/date field of the VCRWorX Control Panel in
replay, or "playback," mode, as shown in the figure below.
NOTE
For more information about the VCRWorX Control Panel, please see the VCRWorX help
documentation.
VCRWorX Control Panel in Replay Mode
31
Unified Data Configurator
32