1
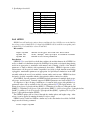
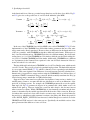
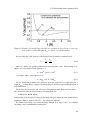
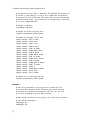
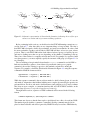
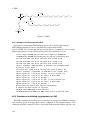
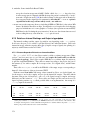
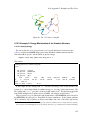
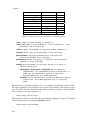
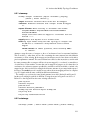
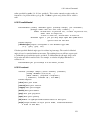
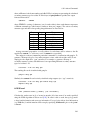
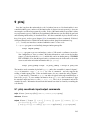
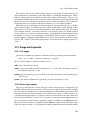
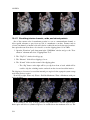
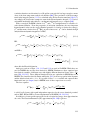
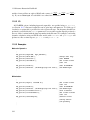
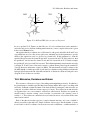
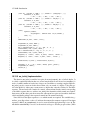
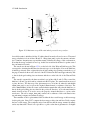
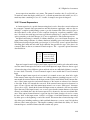
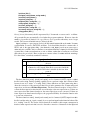
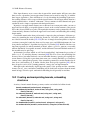
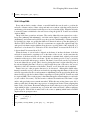
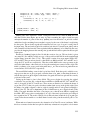
10 PBSA
6. The “Drawing Method” pull down menu will let you choose a different visual representation model.
• To directly visualize potential data, use either “Isosurface” or “Volume Slice”
• VMD can also be used to visualize the corresponding electric field by choosing
“Field Lines”.
Displayed below are Volume Slice representations of electrostatic potential maps generated for
an aquaporin system. Computations were run using the periodic conjugate gradient solver for
a 1 Å grid spacing, and FILLRATIO of 2.0. For the systems using implicit water, the charge
singularity removal methodology was used.
From Left to right: Vacuum, Water only, Water and 20 Å slab-like membrane, Water and 20
Å slab-like membrane with 6 Å cylindrical channel region removed.
Often, the data ranges will not be consistent between potential distributions for different
implicit solvent setups. E.g. the range of the electrostatic values seen for vacuum will likely be
larger than the range for implicit water. The range of values displayed can be set manually to
provide consistent color scaling for comparison.
10.4.5 Adjusting the color scale of the color map
1. Select “Colors...” from the “Graphics” menu in the “VMD Main” window
• This should cause the “Color Controls” window to pop up
2. Select the “Color Scale” tab
• The color scheme can be selected from the “Method” pull down menu
• The “Offset” and “Midpoint” sliders can be used to adjust the scaling of the color
map.
– If singularities are present, it may be difficult to get a good scaling for volume
maps generated with fine grid spacings. In this case, either re-run with singularity removal on, or set the color scale range manually as shown in the next
section.
When singularity removal is not employed, the presence of singularities will cause the range
of the electrostatic potential distribution near the atom centers to be much wider than near the
molecular surface. This typically results in very poor contrast particularly for implicit solvent
since the high dielectric constant in the solvent region will amplify the effect. This can be
compensated for by manually setting the Color Scale Data Range.
320