1
PBMS Dashboard User Feedback Survey
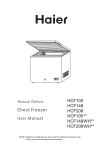
Survey Respondents that have Accessed the PBMS Dashboard
No, I have not accessed the PBMS Dashboard., 11
Yes, I have accessed the PBMS Dashboard at least one time., 26
PBMS Dashboard User Feedback Survey
Survey Respondents that have Accessed the PBMS Dashboard
Comments
•
•
•
•
•
I received an e-‐‑mail saying I was invited, but it was unclear as to what the temporary password was. After a few unsuccessful a<empts, I did not continue any further.
Haven'ʹt been trained or had the chance.
Unable to connect with the dashboard by clicking on the icon; instead must change compatibility mode every time I log in.
It is great. I look forward to additional queries and reports being available on the dashboard.
Have not access due to time constraints. Plan on accessing as soon as time allows.
PBMS Dashboard User Feedback Survey
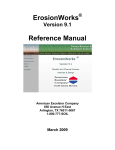
How Frequently Survey Responders have Accessed the Dashboard
&'(")*+,"-./0+1"2+34',5+/3"670+"899+33+5"
:6+";736<'7/5"
%%"
:-;3"1)+"&223**3,"
$$"
01'/"-"835"9(3*"
#"
0123")4"()43"-"()1+7"
0123")4"()43"-"5336"
!"
&'()*+",-.'/"
!"
!"
#"
$!"
$#"
%!"
%#"
PBMS Dashboard User Feedback Survey
How Frequently Survey Responders have Accessed the Dashboard
Comments
• My research unit uses it as well
• As I have access, and prepare our states submissions, I do not access the dashboard often. However I believe that our personnel will love the dashboard.
• I don'ʹt want to infer that there is no interest from our agency by the number of times I'ʹve accessed the site. As our participation increases, I expect more persons within the agency will want to have access to the dashboard.
PBMS Dashboard User Feedback Survey
Reasons Why Survey Responders have not Accessed the Dashboard
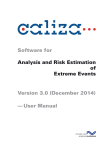
Reasons Why Survey Responders have not Accessed the Dashboard
Other
PBMS Dashboard is a tool for PBMS staff but not other staff.
6
0
PBMS Dashboard reports available are not relevant to our agency.
1
PBMS Dashboard has not been a priority for our agency.
Too difficult to access the PBMS Dashboard.
2
0
Don'ʹt know how to access the PBMS Dashboard.
2
Tried to access, but was not able to connect.
1
0
1
2
3
4
5
6
7
PBMS Dashboard User Feedback Survey
Reasons Why Survey Responders have not Accessed the Dashboard
Comments
•
•
•
•
•
•
•
Time restraints with holiday and then being out of office. Will access as soon as time allows.
I know about the dashboard, but do not know exactly how to access. I probably have instructions somewhere in my email box (also a<ended a meeting where the dashboard was discussed), but am too busy with other things to follow up.
ASCA and its measures are appropriate for prison systems but not a municipal jail system such as ours. Therefore we do not currently participate in reporting or utilize the dashboard.
I'ʹm more IT support of other users, vs. a 'ʹconsumer'ʹ of this data.
We have not started data entry as of yet.
have not accessed the PBMS dashboard as of yet
Haven'ʹt had the need for any comparisons as yet but may in the future, valuable tool to have available
PBMS Dashboard User Feedback Survey
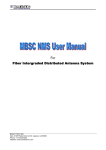
Survey Responders had a Problem Accessing the Dashboard
Yes , 6
N/A -‐‑ Have not accessed the Dashboard, 9
No, 21
PBMS Dashboard User Feedback Survey
Survey Responders had a Problem Accessing the Dashboard
Comments
• I difficulty finding the link the first few times, after which I bookmarked it instead. It would be nice if the PBMS link is displayed on the home page rather than through the commi<ee page.
• Accessing the dashboard on the front end gives me a system error: Invalid session. Please try again.
• The password reset function is located with a dynamic IP and our state spam filter automatically filters the reset email.
• I tried to give a demonstration to the wardens and even though I could get to the internet, I couldn'ʹt get to the actual dashboard because the Oracle software only runs on a modern version of the Internet that my notebook didn'ʹt have.
• It took a few tries, but that was last year. Since I have asked my research staff to look PBMS stuff up
PBMS Dashboard User Feedback Survey
Survey Responders Found the Dashboard Easy to Navigate
N/A -‐‑ Have not accessed the Dashboard, 10
No, 4
Yes, 22
PBMS Dashboard User Feedback Survey
Survey Responders Found the Dashboard Easy to Navigate
Comments
• For the most part, but if you are first using the dashboard, as a state member "ʺorganization"ʺ does not make much sense. The main page is so open, could you put a simple definition of what an "ʺorganization"ʺ and "ʺfacility"ʺ is right there so when you see it in the drop down menu, you know what you are looking at?
• Like anything else, it take a li<le ge<ing used to.
• I am very familiar with OBIEE, however, as we use the same product at NDCS.
• It took a li<le experimentation to figure some things out, but it was not too difficult.
• The dashboards have definitely improved since I last looked at them a couple months ago. Also, I like how there are a serious of graphs within any given data element that allow the data to be examined from multiple perspectives. Although I could understand what I needed to do to interact with the data, there were a number of frustrating points (see #8) that caused me to respond 'ʹno'ʹ to this item.
PBMS Dashboard User Feedback Survey
Survey Responders Suggestions to Improve The PBMS Dashboard
• Just more reports....great content thus far
• Additional reports on fiscal, personnel, and other indicators. Yearly indicators would be a priority for our agency.
• In the Incarcerated by Crime Category report and for most reports, it is impossible to choose a month range, "ʺbetween 1-‐‑4"ʺ month number for example, even though this is offered at the Search menu. The system only produces one month at a time, rather than a range. The range would be really good. Also the maps function wasn'ʹt working because of staff constraints which was disappointing. I would like to see all the indicators that we report on refected in the dashboard in some way.
• My agency has been working with some exciting software to create a number of highly graphical and interactive internal dashboard measures. I would love to discuss and explore with you. I think the graphs and interfaces on your oracle system are not necessarily the easiest to read, understand, and interpret. Bar graphs aren'ʹt always the graphic of choice for this data. In particular, I think your data lends itself to mapping, which could incorporate a drill-‐‑down feature to examine data over time and between states. Also, it is sometimes hard to tell what scale is being used (for example, what is .00002% of escapes??) and sometimes the legends aren'ʹt as clear as they could be.
PBMS Dashboard User Feedback Survey
Survey Responders Found the Reports on the Dashboard Useful
N/A -‐‑ Have not accessed the Dashboard, 11
Yes, 10
No, 2
Some Are, 13
PBMS Dashboard User Feedback Survey
Reports that Responders Find Not Useful to Their Agency
• Haven'ʹt spent much time with the reports. Not sure how they help us with our day-‐‑to-‐‑day work.
• Unsure at this time
• Gender
• The utility of the reports has more to do with their layout and user-‐‑friendliness than anything else.
PBMS Dashboard User Feedback Survey
PBMS Key Indicators or Characteristics that would be
Useful as Dashboard Reports
• Use of Force; Disciplines by Gender; Agency Appropriations; Staffing Drug Tests; Mental Health Assessments / Diagnosis
• It'ʹs too soon in our participation, but I believe you will have requests from our agency in the near future.
• I have no suggestions at this time. I really need to use what is available first before I can comment on what else might be useful.
• Give all members access to all statistical data; percentages and ratios are nice, but actual numerical data is useful for like facility comparisons. Provide query search capabilities by single type (i.e. facility security without having to select a state.
• ICE Detainee numbers, those held after 48 hours, and those released to self under 48 hours
PBMS Dashboard User Feedback Survey
PBMS Key Indicators or Characteristics that would be
Useful as Dashboard Reports
• While I understand that we must be careful not to over-‐‑populate the system to the degree it becomes unuseful, I believe that all of the indicators have importance and should be considered for dashboard reporting features. Currently, our top priority would be indicators relating to PREA (Sexual Violence and Misconduct standards), Substance Abuse standards and Mental Health Services standards. Secondary would be Health Care standards and Justice standards.
• Data in the Health areas. e.g Mental Illness, HIV etc. Data by standard Age groupings: counts by age groupings: (if data is currently being gathered) Data for Length of time Serving
• Additional reports on fiscal, personel, and other indicators. Yearly indicators would be a priority for our agengy.
• It seems that you have targeted some of the most important measures/
characteristics that are being gather via PBMS. I assume you will continue to expand measures, and trust that you have a good sense of what are the most important factors.
PBMS Dashboard User Feedback Survey
Other Survey Respondent Suggestions to Improve the Access to the
PBMS Dashboard or the Information Available on the PBMS Dashboard
• Improve ability to print or export screen shots of charts/data.
• Maybe a tutorial to show how to use it, or a user guide of some sort. A table showing which state has reported which month would be helpful. If you could make the unified states report so that Connecticut could compare themselves to other unified states, that would be helpful too.
• There is a high degree of granularity that I might suggest is not useful. The key indicators and characteristics reported under PBMS seem to be very useful. However, the frequency of monthly reporting is not only a significant burden, but I'ʹm unsure that it lends value to the data as I review the dashboards. It seems that quarterly or annual reporting would be more valuable. For example, it is not very interesting to examine how many escapes Colorado had in comparison to another state in June 2012 (and it is unwieldy to select each month at a time). It would be far more useful to be able to compare Colorado to like states for the entire year of 2012.
PBMS Dashboard User Feedback Survey
Other Survey Respondent Suggestions to Improve the Access to the
PBMS Dashboard or the Information Available on the PBMS Dashboard
• While the user manual is nice, it is a large document. Could you break it up into it'ʹs respective components and place a link on the page for each menu or report item to that specific piece so if you need some assistance it would readily handy on that page rather than having to search through the document for the specific part.
• The charts are not real user friendly/easy to read and understand. There is nothing indicating if it is a rate per population, per 100 or what exactly the charts show.
• I may not be using it correctly, but it appears that many of the reports are not yet populated with data (?)
• Even though my use of the dashboard has been limited up to this point, I am very excited about learning how to use the dashboard for our agency. What I have seen so far is impressive and I look forward to maximizing it'ʹs use in Massachuse<s. Thank you
• Remove manual backend mode script for users or send/provide maintenance /status updates to users to remain compatible.