1
SECTION 4
BREEDER INFO
SECTION 5
BLOOD TYPING
SECTION 6
BY-LAWS
SECTION 7
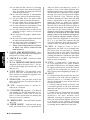
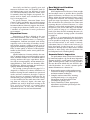
The National Beef Quality Audit identified
excess external fat and excess seam fat as two of
the largest contributors to economic lost opportunity in the beef industry. By industry standards,
most Limousin cattle represent genetics for
high levels of carcass leanness. However, some
Marbling Score (MARB) EPDs
PERFORMANCE
Fat Thickness (FAT) EPDs
SECTION 3
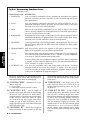
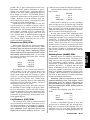
By definition, if sires A and B are mated to
similar groups of cows, the average ribeye area
of calves from sire B are expected to be 1.00
square inch larger than the average of calves
from sire A, at an age constant end point, due to
genes passed on for ribeye area. While larger
ribeye area is generally desired, some marketing
programs may discriminate against carcasses
with ribeyes which are too large.
Recognizing that ribeye area EPDs may not
be available for some young sire prospects, differences in muscularity can be observed visually,
and these differences are at least moderately heritable. Fed cattle with high red meat yield can
successfully be produced by selecting thick, muscular appearing sires.
TRANSFERS
Difference = 1.00 sq.in.
SECTION 2
REA EPD
Bull A
–.40 sq.in.
Bull
B
.60 sq.in.
_______________________
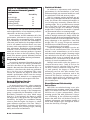
When bred to similar sets of cows, managed
alike and processed at a constant age, offspring
of sire A are expected to produce carcasses which
have .05 inches less outside fat measured at the
12th/13th rib interface as compared to the average for carcasses from offspring of sire B.
As with other carcass traits, depending upon
the targeted market, there is likely danger in
selecting for extreme levels of either low or high
outside fat. It follows that intermediate levels
are likely more optimum in most traditional situations. While cattle that are too fat represent
excessive levels of trim loss, extremely lean cattle
can represent potential for cold induced shortening (causing toughness), fleshing ability problems in the cowherd, and potentially “harder
doing” cattle.
REGISTRATION
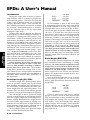
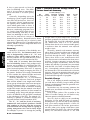
Ribeye area EPDs offer an objective measurement of genetic differences in muscularity. EPDs
for ribeye area are expressed in units of square
inches, with larger values indicating larger
ribeyes and increased expected overall carcass
muscularity and red meat yield. As an example of how to interpret ribeye area EPDs, consider
the following two sires:
FAT EPD
Bull A
.00 in.
Bull B _______________________
.05 in.
Difference
= .05 in.
SECTION 1
Ribeye Area (REA) EPDs
variation exists within the Limousin population.
Consider the fat thickness EPDs for the following two bulls:
INTRODUCTION
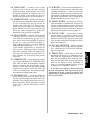
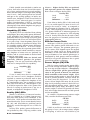
pounds due to genes inherited from their sires.
Remember, EPDs predict differences in performance, not actual weights. Knowing which of
the above two bulls is most appropriate may not
be as simple as it seems. On one hand, bull B is
expected to produce more total pounds of carcass
weight. However, if bull B produces some carcasses which are too heavy, overweight discounts
may work to bull B’s disadvantage.
Optimum carcass weight EPDs for sires will
vary according to a number of factors, such as
characteristics of the cows to which the sires are
mated and the calf growing/finishing management regime. Gaining a feel for optimum carcass weight EPDs will require some trial and
error, and are likely to depend upon the targeted
market. Avoiding extremes in carcass weight
EPD should help to minimize the risk of discounts in traditional markets.
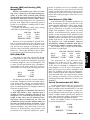
Marbling scores are subjective evaluations of
intramuscular fat in the ribeye. At present, marbling scores are the only easily measured indicator of palatability of beef carcasses. The three
components of palatability include tenderness,
juiciness, and flavor. It appears that the chief
benefit of marbling is that it serves as an insurance policy against overcooking. As well, marbling is the primary determinant of USDA quality grades, which contribute to determination of
the value of beef carcasses in many traditional
fed cattle marketing transactions.
Marbling EPDs are expressed in units of
numeric marbling score, with higher values
indicating genes for greater deposition of
intramuscular fat, or higher expected marbling score and higher USDA quality grade at
a constant age.
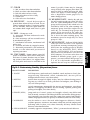
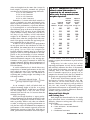
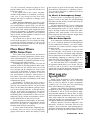
Consider the marbling score EPDs of sires A
and B:
MARB EPD
Bull A
–.15
Bull
B
+.15
_______________________
Difference
= .30
If bred to comparable groups of cows and
processed at a constant age, the average marbling score of carcasses from offspring of sire A is
expected to be .30 score units higher than the
average of carcasses of offspring produced by sire
Performance – D-23