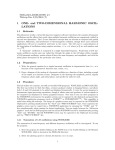
1
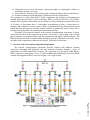
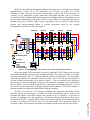
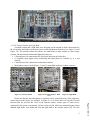
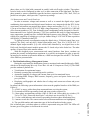
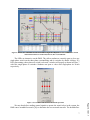
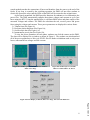
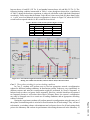
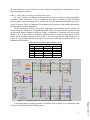
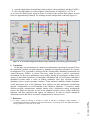
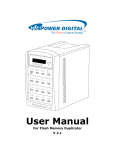
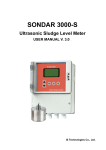
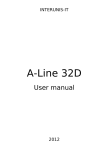
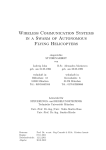
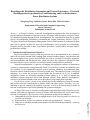
Reconfigurable Distribution Automation and Control Laboratory: A Network
Reconfiguration Experiment for Load Balancing and Loss Reduction in
Power Distribution Systems
Xiaoguang Yang, Valentina Cecchi, Karen Miu, Chika Nwankpa
Department of Electrical and Computer Engineering
Drexel University
Philadelphia, Pennsylvania
Abstract – At Drexel University, a network reconfiguration experiment has been developed to
provide students with hands-on experience on how to balance loads and reduce real power losses
of a distribution system through network reconfiguration. The experiment has been set up within
Drexel’s Reconfigurable Distribution Automation and Control Laboratory (RDAC) [1][2][3].
This paper discusses the Distribution Management System (DMS) module for students to acquire
data, also to operate switches for network reconfiguration, and to perform loss calculations.
Examples will be provided to show experimental procedures, system studies and data analysis
performed by students.
1
Page 10.1061.1
1. Introduction and Educational Objectives
In power distribution systems, loads may increase due to the installation of new customers
and to the electricity demand shifts resulting from seasonal weather changes. Load increases not
only cause higher power system losses but also may lead to overloads in electrical equipment,
such as transformers and distribution lines, which will reduce the equipment’s lifespan. In order
to reduce real power losses and relieve overload, network reconfiguration is performed.
Network reconfiguration is a process of changing the topological structure of distribution
systems by opening and/or closing normally closed (sectionalizing) switches and normally open
(tie) switches. It can considerably improve system operating conditions by transferring loads
from more heavily loaded feeders to less heavily loaded ones. This transfer of loads is called load
balancing. As a result, the real power losses might also be reduced [4] [5] [6]. In addition,
distribution systems are electrically unbalanced across phases (a, b, c), and it is known that
unbalanced systems incur more losses than balanced systems. Hence network reconfiguration
can also be performed to balance load across three phases using single-phase switching.
For the above reasons, electric power utilities plan for the installation of network switches
and perform network reconfiguration to balance loads and reduce losses. Therefore, it is very
important to provide students with practical experience as well as theoretical analysis skills on
network reconfiguration, specifically planning and operation techniques.
At Drexel University, a network reconfiguration experiment has been developed to provide
students with hands-on experience on how to balance loads and reduce real power losses using
network reconfiguration. The objectives of this experiment include for the students to:
1) Understand the need for network reconfiguration for load balancing and loss reduction in
a real-life environment;
2) Experience how to place new switches for network reconfiguration – planning;
3) Study how to schedule network reconfiguration for different loading conditions – planning
and operation;
4) Understand how to select and operate existing three-phase or single-phase switches to
reconfigure network– operation;
5) Gain experience with power flow analysis tools, estimation methods and loss calculations;
6) Evaluate advantages and disadvantages of different network configurations.
The experiment is set up within RDAC which complements the generation and transmission
oriented Interconnected Power System Laboratory (IPSL) at Drexel University [7][8]. RDAC
consists of four modular stations that can be combined to form a distribution system with a total
of 36 buses, 16 three-phase lines, 16 three-phase sectionalizing switches, 16 three-phase tie
switches, and a number of various types of loads. A Distribution Energy Management System
(DMS) has been developed to remotely control switches, to monitor the entire system, and to
automatically acquire data with control and measurement facilities.
This paper will present the details of the network reconfiguration experiment. It begins
with a brief overview of the experiment in Section 2. In Section 3, various parts of the relevant
power hardware are presented along with the measurement and digital control hardware. The
DMS interface between the students and the distribution system is illustrated in Section 4. Then,
an outline of the experiment is addressed in Section 5, followed by conclusions.
2. Overview of the Network Reconfiguration Experiment
The network reconfiguration experiment provides students with hands-on learning
experience concerning load balancing and loss reduction techniques through a series of
experiments on different distribution systems. The experiment was developed within RDAC.
RDAC consists of a three-phase, 4-wire, 43.2 kW reconfigurable distribution system and a DMS.
A single-line diagram of RDAC is shown in Figure 1 for a typical setup.
2
Page 10.1061.2
Figure 1. One-Line Diagram Setup of the Reconfigurable Distribution
Automation and Control Laboratory (RDAC)
RDAC has four identical distribution stations. Each station has (i) a variable wye-grounded
autotransformer (Variac) and a 30A three-phase circuit breaker for safety; (ii) a 9-bus
distribution feeder with four three-phase sectionalizing switches and four three-phase tie
switches; (iii) six multi-phase resistive loads and a three-phase capacitor, and (iv) a Remote
Terminal Unit (RTU) with the DMS for data acquisition and digital control. Each station can run
the experiment independently with groups of three to four students. By interconnecting the four
stations using the tie switches, larger system experiments can be created for senior design
projects and research-oriented studies. A general three-phase setup for the network
reconfiguration experiment is shown in Figure 2.
Figure 2. System Diagram for a Three-Phase Network Reconfiguration Experiment
3
Page 10.1061.3
In the experiment, 208V three-phase ac power is supplied by PECO Energy and fed to the
9-bus radial distribution system through an autotransformer. The radial system has two feeders
with four three-phase lines. To develop different network configurations, four three-phase
sectionalizing switches are embedded along the feeders. There are also four three-phase tie
switches available, though only one is shown in Figure 2. These tie switches can be hardwired
between any two buses excluding the feeder bus. It is noted that each phase of the sectionalizing
and tie switches can be controlled separately for single-phase load balancing studies. At each
bus, various resistive loads and a multi-tap capacitor can be connected. This allows students to
perform network reconfiguration under different loading conditions.
The RTU was built on a PC platform, including data acquisition and digital control
hardware. During the experiment, it controls all of the sectionalizing and tie switches and
measures three-phase and neutral voltages and currents at up to four buses. To provide an
interface for students to run the experiment, a Distribution Energy Management System was
developed on the RTU. Using the DMS, students can remotely operate the sectionalizing and tie
switches to reconfigure the system. They can also obtain RMS values and phase angles of
measured voltages and currents to assist them in estimating system states and real power losses.
3. Hardware Design
The actual hardware setup on one RDAC station is shown in Figure 3. The setup consists of
the following four main parts:
1) A power station providing three-phase 208Vac/120Vdc with a three-phase 1:1
autotransformer;
2) A distribution feeder box enclosing the 9-bus feeder;
3) A transfer station/light bank with four three-phase tie switches and multiple types of loads.
Signal conditioning hardware is also installed under the transfer station in a National
Instruments (NI) SCXI-1001 chassis [9].
4) An RTU station with data acquisition and digital control hardware.
Figure 3. Hardware Setup for the Network Reconfiguration Experiment
The hardware most relevant to the network reconfiguration experiment will now be explained.
3.1. The Power Station and Autotransformer
To perform the experiment, a 10.8 kW power station was built at each station [3]. It
provides 208V three-phase ac power. It can also provide 120V dc power. For safety reasons, the
ac power is fed through a three-phase wye-grounded autotransformer before entering the
distribution feeder box, which is discussed next.
4
Page 10.1061.4
3.2. The Distribution Feeder Box
The experiments are based on a 9-bus distribution feeder with
• 4 three-phase distribution lines modeled using 12 1mH inductors;
• 4 three-phase sectionalizing switches (normally closed) mimicked using 12 digital relays;
• 4 possible three-phase tie switches (normally open) mimicked using 16 digital relays
To realize this, an electrical system was designed and built within a distribution feeder box as
shown in Figure 4. Please note that the tie switches are not embedded in the feeder box. They are
part of the transfer station connected to the feeder box, which will be discussed later.
The feeder is a reconfigurable three-phase system. Unbalanced systems with single-phase
or two-phase sections can be created by opening the relays using the RTU. At each bus along the
feeder, there are also:
• Shunt connections to the transfer station for tie switch and load connections;
• 4 hall-effect devices on all three phases and neutral for current measurements.
Figure 4. 9-Bus Distribution Feeder Box with 20A Fuses for Protection
3.3. The Transfer Station and Light Bank
A transfer station and a light bank were designed and developed to make connections for
the tie switches and loads to non-source buses in the distribution feeder box (see Figure 5.a and
Figure 5.b). The transfer station also allows for connections to other stations to create larger
systems. On each transfer station and light panel, there are:
• 8 floating buses for connections to 8 non-source buses on the feeder box;
• 16 normally open digital relays mimicking four three-phase tie switches (a, b, c and
neutral);
• 6 transfer buses for connections to other three stations;
• Multi-phase resistive loads (Figure 5.c) and 1 controllable multi-tap 3-phase capacitor.
Figure 5.a Transfer Station
Figure 5.b Transfer Station – Back
View
Figure 5.c Light Bank
5
Page 10.1061.5
Please note that the four three-phase tie switches can be connected to any of the eight nonsource buses on the feeder. For example, in Figure 5.a, it is shown that a tie switch is located
between Bus A4 and Bus B4. Also, on the transfer station, various types of loads can be
connected to the system conveniently. All the resistive loads, which are mimicked using carbon
filament light bulbs, were hardwired from the light bank to the transfer station [10]. On each
phase, there are five light bulbs connected in parallel with on/off toggle switches. Three-phase
resistive loads can be configured in either wye or delta connection on the light bank. The threephase manual or remote controllable capacitor has three capacitor banks (15uF, 20uF, 25uF) in
parallel on each phase, which provides 7 capacitor tap settings.
3.4. Measurement and Control Hardware
In order to measure voltages and currents as well as to control the digital relays, signal
conditioning, data acquisition and digital control hardware were integrated with the RTU. In the
experiment, each station can measure three-phase voltages and currents (Va, Vb, Vc, Vn, Ia, Ib, Ic,
In) at up to four buses with NI SCXI-1327 high voltage attenuators [11] and LEM LA- 100P hall
effect current transducers [12]. Four 8-channel signal conditioning boards designed for Drexel’s
Interconnected Power System Laboratory [7][8] were modified and used for signal attenuation,
surge suppression, ground loop flow isolation and high frequency noise filtering. The 32 filtered
signals were sampled at 60 samples per cycle per channel using a NI PCI-6071E data acquisition
card (DAQ) [13] installed in the RTU.
To perform network reconfiguration using the digital relays, 28 digital control lines were
required. The DAQ card only has 8 digital input/output ports. Thus, two NI SCXI-1163 32channel digital output modules [14] were selected and controlled by two digital lines on the
DAQ card. One digital control module operates the 12 closed relays in the feeder box. The other
operates 16 open relays in the transfer station.
With the designed power, measurement and control hardware from above, students can
perform the network reconfiguration experiment in a real-life environment. In order to provide
an interface for students to operate the hardware, a DMS was designed for each RTU. The details
of the DMS are presented now.
6
Page 10.1061.6
4. The Distribution Energy Management System
During the experiment, the distribution system is monitored and controlled through a DMS,
which was developed using Microsoft Visual Basic 6.0 and NI Components Work [15]. The DMS
provides students a platform for:
• Visualization of experimental setups;
• Remotely operating the sectionalizing and tie switches;
• Automatic sampling of voltages and currents from up to four monitored buses;
• Calculating RMS voltages, RMS currents, frequency, power and power factor on a cycle
per cycle basis;
• Displaying oscillographic and tabular data of voltage and current waveforms and power
parameters.
In general, the following system information is shown on the graphical interface of the DMS (see
Figure 6):
1) A 208V ac source with a three-phase autotransformer servicing the system;
2) Green and red LEDs representing closed and open switches respectively
3) 4 three-phase sectionalizing switches (SW1 to SW4) and 4 three-phase tie switches (3-P
Tie1 to 3-P Tie4). Please note that Figure 7 only shows one tie switch (3-P Tie 1);
4) 12 color coded inductors and resistors representing four three-phase distribution lines;
5) 4 sensors at each bus. The sensors on the selected measurement buses are highlighted;
6) The specified number and connection types of the loads hardwired in the system.
Due to limited space, each three-phase tie switch is represented using one LED. The LEDs will
become green if any phase is closed on the tie switch.
Figure 6. Screen shot of the DMS for the Network Reconfiguration Experiment with 2 3-Phase Tie Switch
and 4 Measurements on Feeder Bus, Bus A2, Bus A4, and Bus B4
The LEDs are interactive on the DMS. They allow students to remotely open or close any
single-phase switch on the three-phase sectionalizing and tie switches by double clicking. If a
LED representing a three-phase tie switch is selected, a window will pop up as shown in Figure 7
with four single-phase tie switches. Students can open or close each single-phase tie switch
respectively.
We note that before sending control signals to operate the actual relays in the system, the
DMS runs a breadth-first-search [16] to determine the new network structure. The breadth-first7
Page 10.1061.7
Figure 7. Screen Shot of the GUI for Tie Switch Operation
search method searches the connections of buses and branches from the source to the end of the
feeder. If any loop is created by the switching operation, the DMS will not allow students to
electrically operate the relays and the LEDs on the DMS will be restored to the original states.
As previously mentioned, the DMS provides functions for students to view and analyze the
power flow. The DMS automatically samples three-phase voltages and currents at up to four
buses using the RTU. Using the sampled data, it calculates RMS values and phase angles of the
measured voltages and currents. The DMS also calculates the real, reactive power and power
factor using the voltages and currents. These power parameters are displayed in various forms:
1) Tabular form (See Figure 6);
2) Real time phasor diagrams (See Figure 8.a);
3) Oscilloscopic data (See Figure 8.a);
4) Instantaneous power plot (See Figure 8.b).
To view the power parameters on each phase, students can click the sensors on the DMS.
The data will be displayed in a window as shown in Figure 9. The students can also download
all of the power parameters to Microsoft EXCEL files for further calculations such as real power
losses, unmeasured bus voltages and line currents.
Figure 8.a Oscilloscope View and the Phasor of ThreePhase AC Voltage
Figure 8.b Oscilloscope View and the
Phasor of Three-Phase AC Power
Figure 9. Sensor Display of Bus B4, Phase A Voltage, Line Current and Power
Page 10.1061.8
8
5. Experimental Outline
With the designed hardware and software, a network reconfiguration experiment has been
designed to meet the educational objectives discussed in Section 1. The experiment consists of
pre-laboratory exercises, a laboratory module and at-home evaluations of results for report writeups. Within the laboratory module, three case studies have been developed to address the
different requirements and objectives for network reconfiguration. They provide students with
practical experience on network reconfiguration schemes in various networks and under different
loading conditions:
Case 1: three-phase switching in balanced and unbalanced networks
Case 2: three-phase switching for various loading conditions
Case 3: single-phase switching in unbalanced networks
Through the experiment, students will:
1) Optimize locations of new tie switches for a given system in a pre-laboratory exercise;
2) Examine the scheme obtained in the pre-lab in an actual experimental setup and compare
it with other schemes;
3) Analyze and determine a feasible network configuration scheme for various loading
conditions;
4) Select and operate existing three-phase or single-phase switches to balance loads and
reduce real power losses in different systems;
5) Estimate unknown bus voltages, line currents and real power losses.
In the following subsections, each case will be discussed with graphical examples obtained from
the DMS. For visual ease, all the figures show an enlarged view of the network diagram.
9
Page 10.1061.9
Case 1. Three-phase switching in balanced and unbalanced networks
In distribution systems, most network switches are three-phase switches where all three
phases of the switch are operated at the same time. As such, in Case 1, students will gain
experience with improving load balance across feeders by employing three-phase switching and
evaluating real power losses in at-home exercises for laboratory reports. More specifically,
power distribution planning and operating issues are addressed where new switch installations
and switching operations are determined under different load conditions.
First, students perform switch placement for a system without tie switches in a pre-lab
exercise. They are asked to determine where to install new tie switches in order to perform
network reconfiguration. They must find appropriate placement schemes in order to balance
feeder loads or according to a desirable voltage profile and/or real power losses obtained from
power flow analysis. Then, students will test their selected scheme as well as alternatives in an
actual experimental setup to verify their selection.
Second, students will perform network reconfiguration with three-phase switching of
existing three-phase sectionalizing and tie switches for the following different types of systems:
1) Three-phase balanced network with balanced loads;
2) Three-phase balanced network with unbalanced loads;
3) Multi-phase unbalanced network with 1-phase, 2-phase and 3-phase sections.
In each system, two three-phase tie switches will be placed at fixed locations in the network (see
Figure 6). Students will compare the possible network configurations and test each of them. By
estimating the losses, and looking at the voltage profile, they will then draw a conclusion on
which configuration is the most appropriate.
For demonstration, a sample laboratory procedure is now illustrated for a Type 1 system.
Beginning with the network configuration from Figure 6, two tie switches have been added one
between buses A1 and B3 (3-P Tie 1) and another between buses A4 and B4 (3-P Tie 2). The
following loading condition enumerated in Table 1 exists; though not shown here, visualization
of Table 1 during the hardware experiment is achieved with bulbs on the light bank illuminated
accordingly. Please notice that the bottom Feeder B has 8 times more load per phase than Feeder
A. A new, more load balanced network configuration is shown in Figure 10, where the B2-B3
switch has been opened and the A1-B3 switch has been closed.
Table 1. Resistive Loads for the System in Figures 6 and 10
# of light bulbs per phase on loaded buses
Phase A
Phase B
Phase C
Bus
A4
1
1
1
B2
5
5
5
B3
1
1
1
B4
2
2
2
Figure 10. A Network Reconfiguration Scheme for the 3-Phase Balanced Network with Balanced Loads
Having Two 3-Phase Tie Switches (3-P Tie1 and 3-P Tie2) at Fixed Locations
10
Page 10.1061.10
Case 2. Three-phase switching for various loading conditions
In Case 2, students will perform tests to find an appropriate network reconfiguration
scheme for different loading conditions. In distribution systems, loads may vary significantly in
different seasons and network reconfiguration might be performed by electric companies to
balance loads or reduce real power losses seasonally. However, switches should not be operated
too frequently because it will reduce their effective lifespan. Hence, the system’s configuration
may only be changed once for a certain set of loading conditions and an appropriate switching
scheme is desired.
During the experiment, students will perform network reconfiguration using the same set of
three-phase sectionalizing and tie switches at fixed locations for all load settings. They will need
to determine a switching scheme with minimum total real power losses for all load settings both
prior to the laboratory and evaluate its performance after testing the network in the laboratory. If
the losses from two or more schemes are close, students can analyze the voltage profile to select
the most appropriate scheme.
Case 3. Single-phase switching in unbalanced network
In Case 3, students will balance loads and reduce real power losses by using single-phase
switching. While the practice is not as common as three-phase switching, in some microgrid
power systems such as shipboard power systems, the need for single-phase switching exists for a
variety of reasons. Thus, it is important for students to gain exposure to and consider the benefits
of single-phase switching techniques.
In the experiment, students will operate single-phase sectionalizing and tie switches to
balance loads on each phase in an unbalanced system. They will experience how to balance loads
on individual phases existing on different feeders, in addition to, balancing load across three
phases (a, b, c) on one feeder. An example is shown in Figure 11 where we start with a fixed tie
switch and the loading condition given in Table 2. It can be seen that the loads on phase A at
Feeder A is much larger than those on phase A at Feeder B while loads on phases B and C are
balanced on both feeders.
Table 2. Resistive Loads for an Unbalanced System
# of light bulbs per phase on loaded buses
Phase A
Phase B
Phase C
Bus
A2
4
3
1
A4
2
0
2
B2
1
2
3
B3
0
1
0
B4
1
0
0
Figure 11. An Unbalanced Network with Single Phase Sectionalizing and Tie Switches
11
Page 10.1061.11
Using single-phase switching, students can balance loads on phase A by transferring loads
at bus A4 to Feeder B with the following steps:
i) open the single-phase sectionalizing switch on phase A between BusA2 and BusA3 (SW2);
ii) close the single-phase tie switch on phase A between Bus A3 and Bus B3 ( 3-P Tie 1).
As a result, the loads become equal on phase A at both feeders and the three phases on each
feeder are approximately balanced. The resulting network configuration is shown in Figure 12.
Figure 12. A Network Reconfiguration Scheme for the Unbalanced Network using 1-phase Switching
6. Conclusions
In this paper, the development of a network reconfiguration experiment is presented. From
the experiment, students can gain exposure to planning and operation techniques for network
reconfiguration. The experiment is developed in the reconfigurable distribution automation and
control laboratory (RDAC) at Drexel University which provides a real-life experimental
environment for the power distribution system studies. During the experiment, students create
various (i) three-phase balanced, (iii) three-phase unbalanced and (iii) multi-phase unbalanced
distribution systems under a variety of loading conditions. Thus, they experience realistic
distribution power system operating scenarios. Using analytical methods, students determine
switch placements prior to the laboratory; then, students test their placements and different
network configurations for load balancing in the hardware laboratory. To remotely enable
different network configurations, students interact with a distribution energy management
system. The DMS also provides an easy-to-use graphical interface, power system monitoring
functions, and data acquisition and capture for students to be able to perform subsequent
calculations such as the effects of network configurations on real power loss.
7. References
12
Page 10.1061.12
[1] X. Yang, C. Bruni, D. Cheung, Y. M. Mao, G. Sokol, K. Miu and C. Nwankpa, “Setup of RDAC – a
Reconfigurable Distribution Automation and Control Laboratory,” Proceedings of the 2001 IEEE PES Summer
Meeting, Vancouver, CAN, July 16-21, 2001.
[2] K. Miu, C. Nwankpa, X. Yang, A. Madonna, “Hardware Design and Layout of a Reconfigurable Power
Distribution Automation and Control Laboratory,” Proceedings of the ASEE Annual Conference and
Exposition 2002, Montreal, CAN, June 15-19, 2002.
[3] K. Miu, C. Nwankpa, X. Yang, A. Madonna, “The Development of a Comprehensive Power Distribution
System Curriculum,” Proceedings of the ASEE Annual Conference and Exposition 2003, Nashville, Tennessee,
June 22-25, 2003.
[4] H. D. Chiang and R. Jean-Jumeau, “Optimal Network Reconfigurations in Distribution Systems: Part 1: A New
Formulation and A Solution Methodology,” Proceedings of the 1990 IEEE PES Winter Meeting, Atlanta,
Georgia, February 4-8, 1990.
[5] M. E. Baran and F. F. Wu, “Network Reconfiguration in Distribution Systems for Loss Reduction and Load
Balancing,” Proceedings of the 1988 IEEE PES Summer Meeting, Portland, Oregon, July 24-29, 1988.
[6] M. A. Kashem, V. Ganapathy and G. B. Jasmon, “Network Reconfiguration for Load Balancing in Distribution
Networks,” IEE Proceedings Online No. 19990694.
[7] S. P. Carullo, et al, “Interconnected Power System Laboratory: Fault Analysis Experiment,” IEEE Trans. on
Power Systems, Vol. 11, No. 4, November 1996, pp. 1913-1917.
[8] S. P. Carullo, C. O. Nwankpa, and R. Fischl, “Instrumentation of Drexel University’s Interconnected Power
Systems Laboratory,” Proceeding of the 28th Annual North American Power Symposium, Cambridge MA,
October 1996, pp. 367-376.
[9] National Instruments, SCXI-1001 User Manual, Texas, 1996.
[10] X. Yang, K. Miu and C. Nwankpa, “A Multi-Phase, Radial Power Flow Experiment for Power Distribution
System Studies,” Proceedings of the 2004 IEEE PES, Denver, Colorado, June 6-10, 2004.
[11] National Instruments, SCXI-1327 User Manual, Texas, 1997.
[12] LEM, LA-100P User Manual, 2000.
[13] National Instruments, DAQ-PCI E Series User Manual, Texas, 1997.
[14] National Instruments, DAQ-SCXI-1163 User Manual, Texas, 1997.
[15] National Instruments, NI-DAQ User Manual for PC Compatibles, Texas, 1995.
[16] T. H. Cormen, C. E. Leiserson, R. Rivest, Introduction to Algorithms, McGraw Hill Book Co., New York,
1990.
Page 10.1061.13
13