1
Manual V1.4 ENG
Copyright © 2008-2009 Vladimir Afanasiev E-mail: [email protected] WWW: www.digflow.ru
Page 1
General usage and key construction principles
The temperature analysis system «Digital Flow-2» is designed to measure and monitor air temperature
fluctuations. «Digital Flow-2» system was specifically designed to locate ascending air flows in
aeromodelling sports.
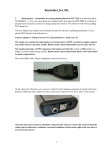
The temperature analysis system «Digital Flow-2» consists of a fast-acting and high-sensitivity
temperature sensor and portable receiver device. The sensor should be positioned on a mast in a remote
location away from the place where an airplane model is being launched, and the receiver device can be
placed in any location convenient for the user.
Measured data is transferred from the sensor to receiver using a digital radiochannel of a fixed frequency.
Each sensor is assigned a unique code for its radiochannel, which allows several sensors to work
simultaneously. The data transfer process implements a noise cancelling algorithm for error detection and
correction1. The three button interface on the receiving device allows users to change the settings and
work-mode of the device.
Transferred data is first processed by the microprocessor in the receiver, and then results are displayed
on its graphical LCD display as a numbers and temperature graph. Ascending air flows can be then
determined by the visual analysis of temperature fluctuations on this graph.
Sensor - technical specifications
Temperature sensor sensitivity
Temperature range
The response time on temperature fluctuations
Number of reads per second
Output power of transmission device
Transmission frequency
Voltage
Current
Size
- 0.01 ºC
- 0 – 61.44 ºC
- t 0.5 – 0.6 Sec 2, t 0.9 – 7 Sec 3
-4
- 6.0 mW
- 433.92 MHz
- 1.6 – 3.3 V (2x ААА – Uptime: 2-3 days)
- 18-40 mA
- 57 x 49 x 24 mm (2.24'' x 1.92'' x 0.94'')
Receiver - technical specifications
LCD graphical display
Temperature unit values on Y axis
Displacement velocity of graph on X axis
Period of time for complete refresh of graph
Maximum operational length
Voltage
Current
Size
1
- dimension 133 x 64 Pixels, monochrome
- 0.16, 0.32 4, 0.64, 1.28, 2.56, 5.12, 10.24 ºC
- 0.2 – 4 Pixels/Sec; step 0.1
- 19.2 – 384 Sec.
- 300 met (328 yd).
- 0.9 – 1.5 V (1x ААА – Uptime: 3-4 days)
- 20-35 mA
- 88 x 57 x 17 mm (3.46'' x 2.24'' x 0.67'')
Implemented in versions of «Digital Flow -2» 2.16 ECC and higher. Warning! Receivers and sensors of version 2.15 (and
lower) are not compatible with receivers and sensors of version 2.16 ECC and higher.
2
Period of time it takes sensor to change its readings by 50% from the difference in current and applied temperature.
3
Period of time it takes sensor to change its readings by 90% from the difference in current and applied temperature.
4
When using the values of 0.16 and 0.32, if T changes by 0.01 ºC, graph size changes by 4 and 2 pixels, respectively.