1
SolarPak User’s Guide
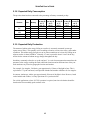
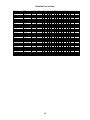
5.3.8 Expected Daily Consumption
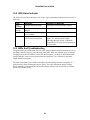
The previous chart has been converted to the percentage of battery consumed per day:
Product
Mode
Battery
MeshGuard
EC
MeshGuard
LEL
Router
EchoView
STD
RTR
STD
RTR
RTR
RTR
PowerPak
PowerPak
PowerPak
PowerPak
PowerPak
PowerPak
% battery
per day at
55° C
(131° F)
0.7%
3.3%
6.7%
7.7%
3.3%
3.3%
% battery % battery % battery % battery
per day at per day at per day at per day at
-20° C
-40° C
20° C
0° C
(68° F)
(32° F)
(-4° F)
(-40° F)
0.2%
2.2%
4.8%
5.0%
2.2%
2.2%
0.3%
2.5%
5.3%
5.6%
2.5%
2.5%
0.7%
3.3%
6.7%
7.7%
3.3%
3.3%
0.9%
10.0%
10.0%
14.3%
10.0%
10.0%
5.3.9 Expected Daily Production
The amount of radiant solar energy falling on a surface is commonly measured in watts per
square meter (W/m2). This quantity varies according to location, season, time of day, and weather
conditions. The radiant energy from the sun at its peak (around noon on a clear day) falling on an
adjacent surface is about 1000W/m2. Naturally, it is not as powerful when it’s lower in the sky,
and in fact the amount of radiant energy changes throughout the day.
Insolation, commonly referred to as “peak sun hour,” is a unit of measurement that normalizes the
amount of solar energy reaching the earth at different locations and at different times of the year.
Peak sun hours vary based on geographic location and weather.
For example, Los Angeles, California, gets approximately 15 hours of daylight in June. This is
equivalent to 7.3 peak sun hours, based upon the latitude and weather conditions for Los Angeles.
In contrast, Anchorage, Alaska, gets approximately 20 hours of daylight in June. However, based
on the latitude and weather, it is only equivalent to 5.6 peak sun hours.
For critical applications, where 24/7/365 operation is required, run time calculations should be
based on the lowest monthly peak sun hour value.
15