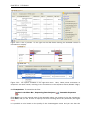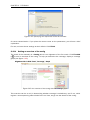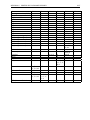
1
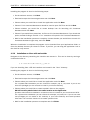
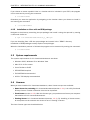
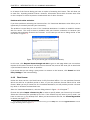
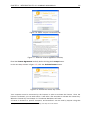
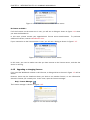
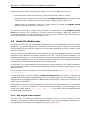
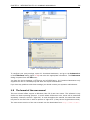
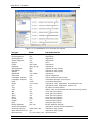
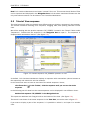
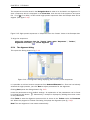
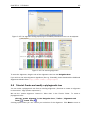
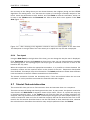
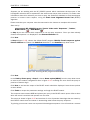
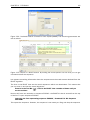
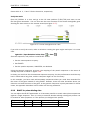
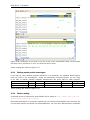
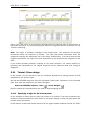
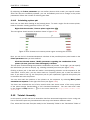
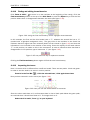
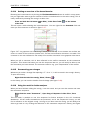
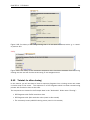
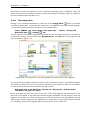
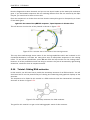
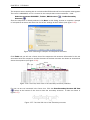
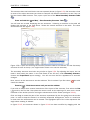
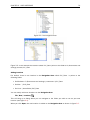
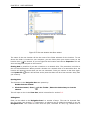
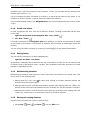
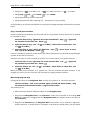
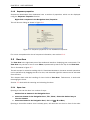
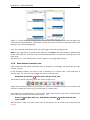
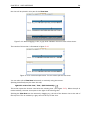
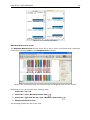
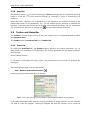
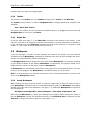
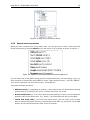
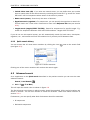
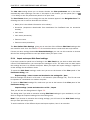
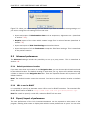
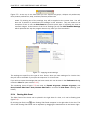
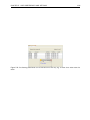
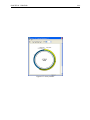
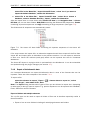
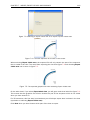
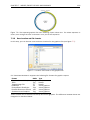
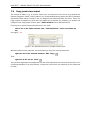
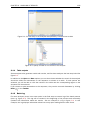
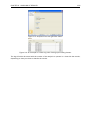
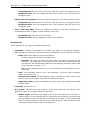
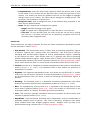
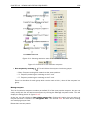
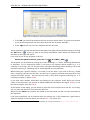
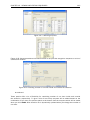
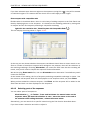
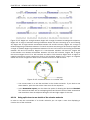
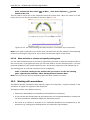
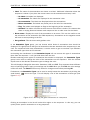
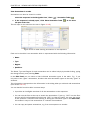
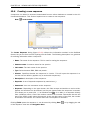
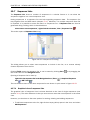
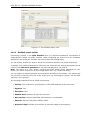
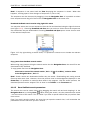
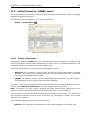
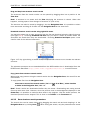
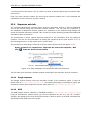
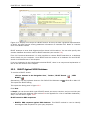
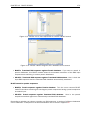
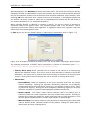
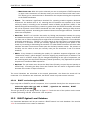
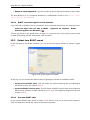
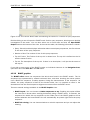
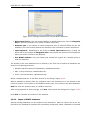
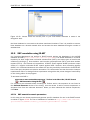
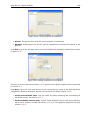
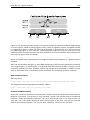
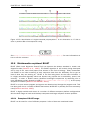
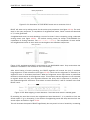
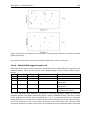
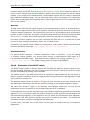
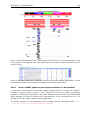
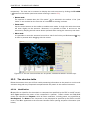
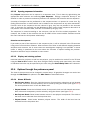
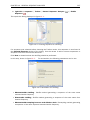
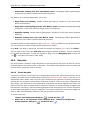
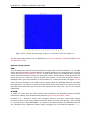
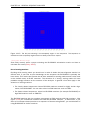
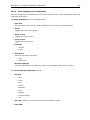
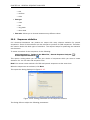
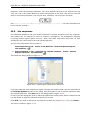
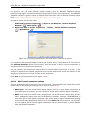
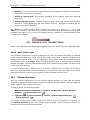
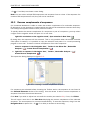
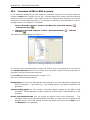
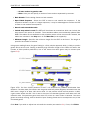
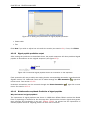
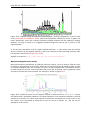
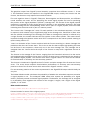
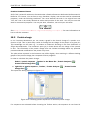
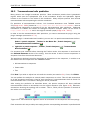
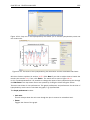
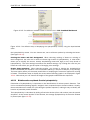
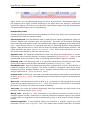
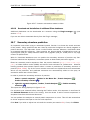
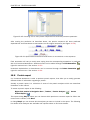
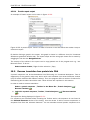
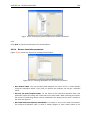
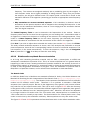
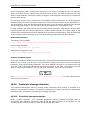
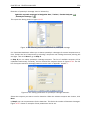
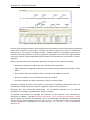
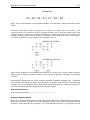
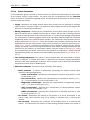
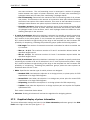
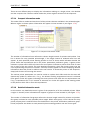
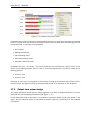
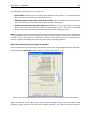
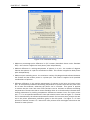
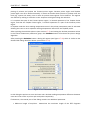
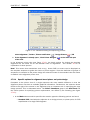
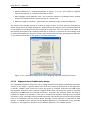
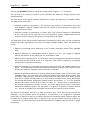
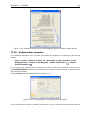
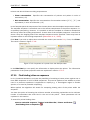
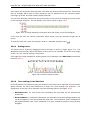
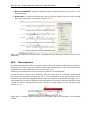
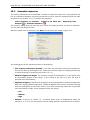
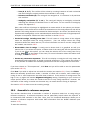
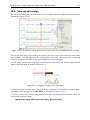
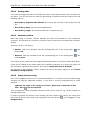
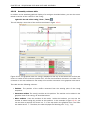
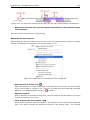
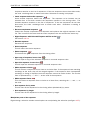
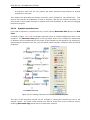
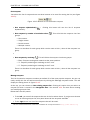
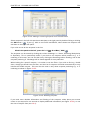
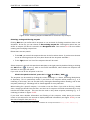
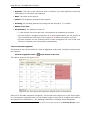
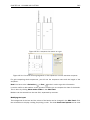
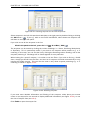
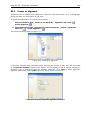
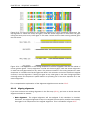
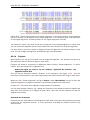
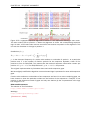
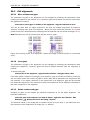
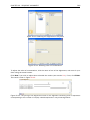
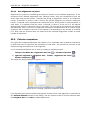
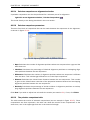
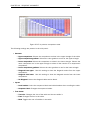
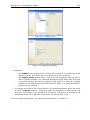
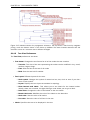
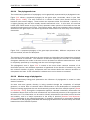
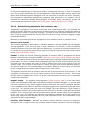
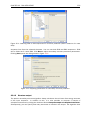
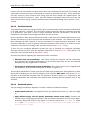
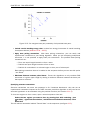
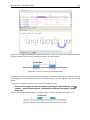
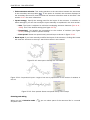
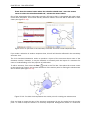
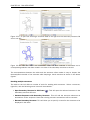
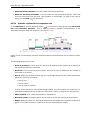
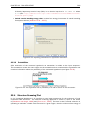
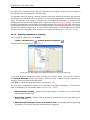
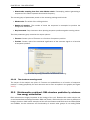
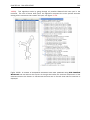
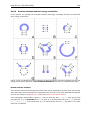
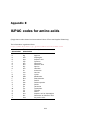
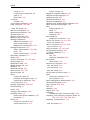
CHAPTER 16. PROTEIN ANALYSES
246
Figure 16.4: Sequence logo of eukaryotic signal peptides, showing conservation of amino acids
in bits [Schneider and Stephens, 1990]. Polar and hydrophobic residues are shown in green and
black, respectively, while blue indicates positively charged residues and red negatively charged
residues. The logo is based on an ungapped sequence alignment fixed at the -1 position of the
signal peptides.
to be the best standalone tool for signal peptide prediction. It was shown that the D-score
which is reported by the SignalP method is the best measure for discriminating secretory from
non-secretory proteins [Klee and Ellis, 2005].
SignalP is located at http://www.cbs.dtu.dk/services/SignalP/
What do the SignalP scores mean?
Many bioinformatics approaches or prediction tools do not give a yes/no answer. Often the user
is facing an interpretation of the output, which can be either numerical or graphical. Why is that?
In clear-cut examples there are no doubt; yes: this is a signal peptide! But, in borderline cases it
is often convenient to have more information than just a yes/no answer. Here a graphical output
can aid to interpret the correct answer. An example is shown in figure 16.5.
Figure 16.5: Graphical output from the SignalP method of Swiss-Prot entry SFMA_ECOLI. Initially
this seemed like a borderline prediction, but closer inspection of the sequence revealed an internal
methionine at position 12, which could indicate a erroneously annotated start of the protein. Later
this protein was re-annotated by Swiss-Prot to start at the M in position 12. See the text for
description of the scores.