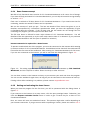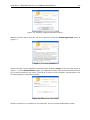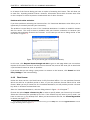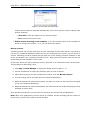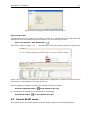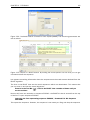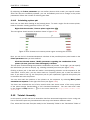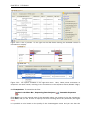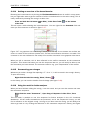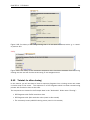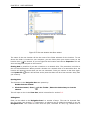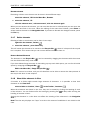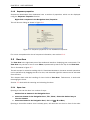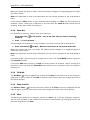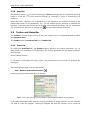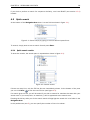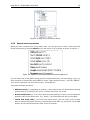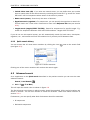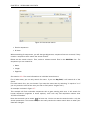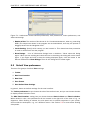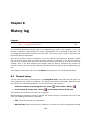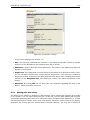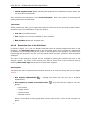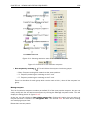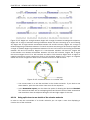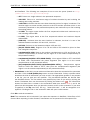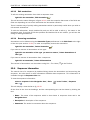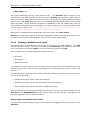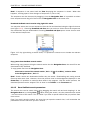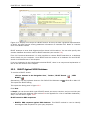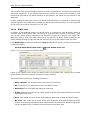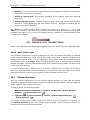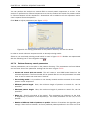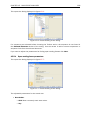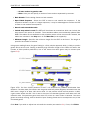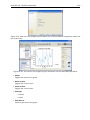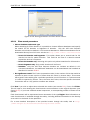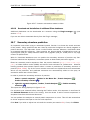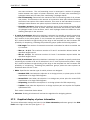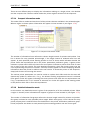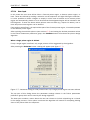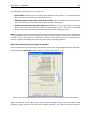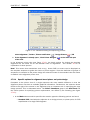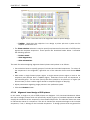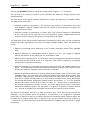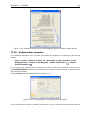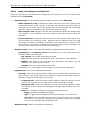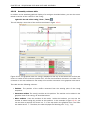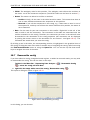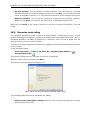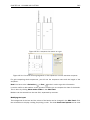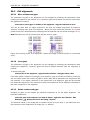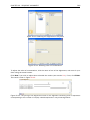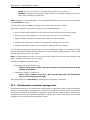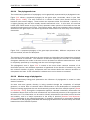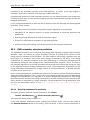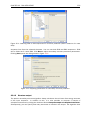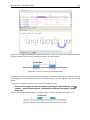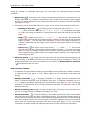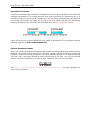
1
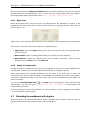
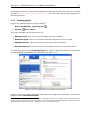
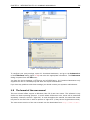
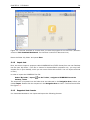
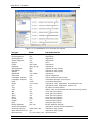
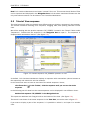
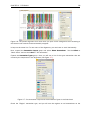
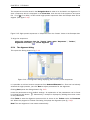
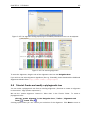
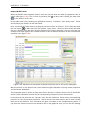
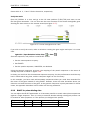
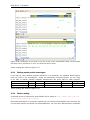
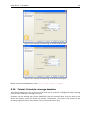
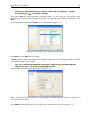
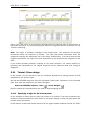
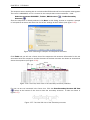
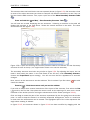
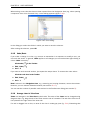
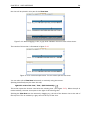
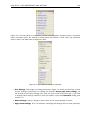
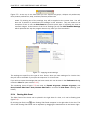
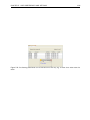
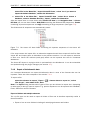
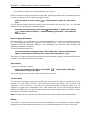
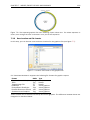
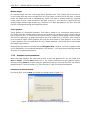
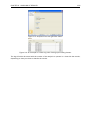
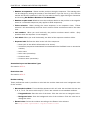
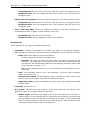
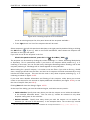
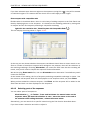
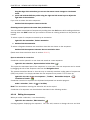
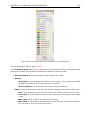
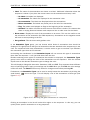
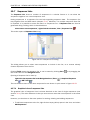
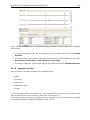
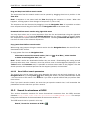
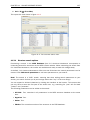
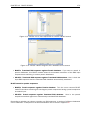
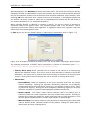
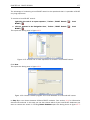
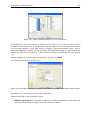
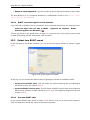
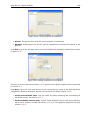
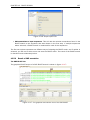
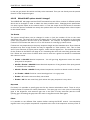
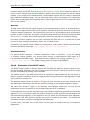
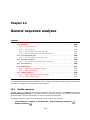
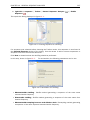
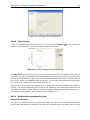
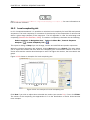
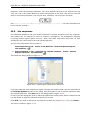
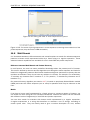
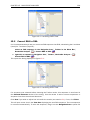
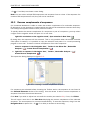
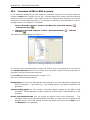
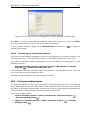
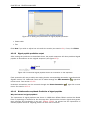
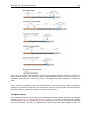
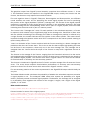
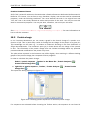
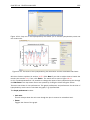
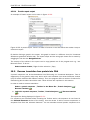
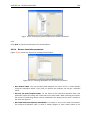
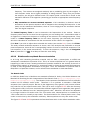
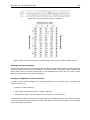
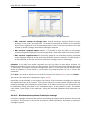
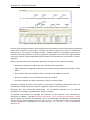
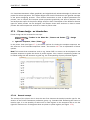
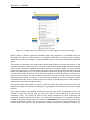
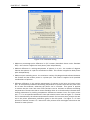
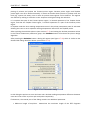
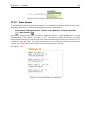
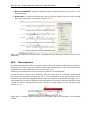
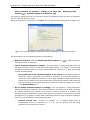
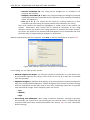
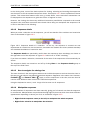
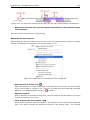
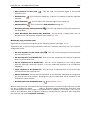
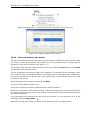
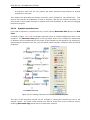
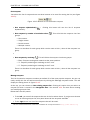
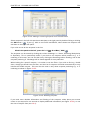
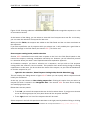
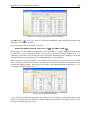
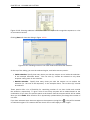
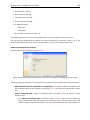
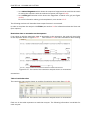
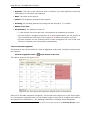
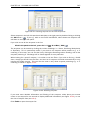
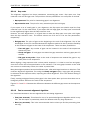
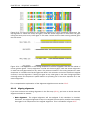
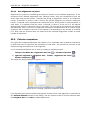
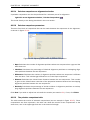
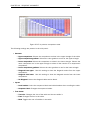
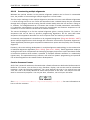
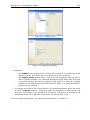
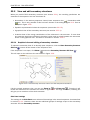
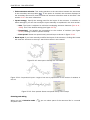
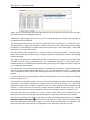
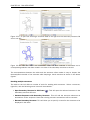
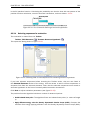
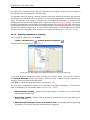
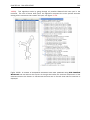
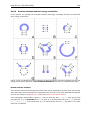
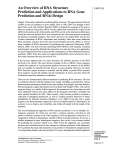
CHAPTER 2. TUTORIALS
47
Figure 2.21: Selecting output for restriction map analysis.
View restriction site
The restriction sites are shown in two views: one view is in a tabular format and the other view
displays the sites as annotations on the sequence. To see both views at once:
View in the menu bar | Split Horizontally (
The result is shown in figure 2.22.
)
The restriction map at the bottom can also be shown as a
Figure 2.22: The result of the restriction map analysis is displayed in a table at the bottom and as
annotations on the sequence in the view at the top.
table of fragments produced by cutting the sequence with the enzymes:
Click the Fragments button (
) at the bottom of the view
In a similar way the fragments can be shown on a virtual gel:
Click the Gel button (
2.8
) at the bottom of the view
Tutorial: BLAST search
This tutorial shows you how to perform a BLAST search using CLC Combined Workbench.