1
Application note
ST40 Micro Toolset user trace support
Introduction
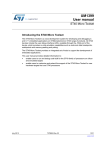
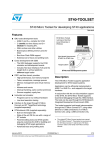
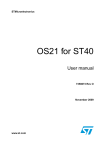
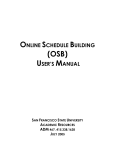
As well as supporting the tracing of OS21 kernel activity and OS21 APIs, the ST40 Micro
Toolset also supports tracing for user defined APIs and activities. These can all be viewed
graphically using STWorkbench. Figure 1 shows an example of a trace in which the mouse
pointer is over a recorded call to a user API called led_on().
Figure 1.
Captured trace displayed graphically in STWorkbench
Support for tracing user defined APIs and activities was first introduced in the ST40 Micro
Toolset R5.0.0. STMicroelectronics recommend that users use the latest STWorkbench
release with the ST40 Micro Toolset.
This application note gives a brief guide to using this facility through a worked example. It
also describes how this feature can be used in STAPI SDK to trace calls to the STAPI SDK
API and events.
April 2010
Doc ID 8254555 Rev A
1/19
www.st.com
Contents
ST40 toolset user trace support
Contents
Introduction . . . . . . . . . . . . . . . . . . . . . . . . . . . . . . . . . . . . . . . . . . . . . . . . . . . . . . . . . 1
1
2
Example of performing a user API trace . . . . . . . . . . . . . . . . . . . . . . . . . 3
1.1
Overview . . . . . . . . . . . . . . . . . . . . . . . . . . . . . . . . . . . . . . . . . . . . . . . . . . 3
1.2
User trace definition file . . . . . . . . . . . . . . . . . . . . . . . . . . . . . . . . . . . . . . . 3
1.3
Compiling the application . . . . . . . . . . . . . . . . . . . . . . . . . . . . . . . . . . . . . . 6
1.4
Linking the application . . . . . . . . . . . . . . . . . . . . . . . . . . . . . . . . . . . . . . . . 7
1.5
Tracing the application . . . . . . . . . . . . . . . . . . . . . . . . . . . . . . . . . . . . . . . . 9
User API trace and events in STAPI SDK . . . . . . . . . . . . . . . . . . . . . . . 12
2.1
Overview . . . . . . . . . . . . . . . . . . . . . . . . . . . . . . . . . . . . . . . . . . . . . . . . . 12
2.2
Installing the patch . . . . . . . . . . . . . . . . . . . . . . . . . . . . . . . . . . . . . . . . . . 12
2.3
Building STAPI SDK for user API trace and events . . . . . . . . . . . . . . . . . 12
2.4
Tracing the STAPI SDK application . . . . . . . . . . . . . . . . . . . . . . . . . . . . . 13
3
References . . . . . . . . . . . . . . . . . . . . . . . . . . . . . . . . . . . . . . . . . . . . . . . . 17
4
Revision history . . . . . . . . . . . . . . . . . . . . . . . . . . . . . . . . . . . . . . . . . . . 18
2/19
Doc ID 8254555 Rev A
ST40 toolset user trace support
Example of performing a user API trace
1
Example of performing a user API trace
1.1
Overview
The following example describes how support for User API trace is set up, and how the
captured trace can be viewed in STWorkbench.
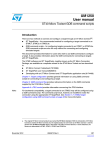
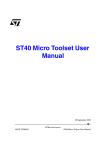
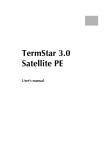
Figure 2 shows the main.c of the LED example in the STWorkbench editor.
Figure 2.
main.c of the LED example
This application note describes how to trace calls to the function led_on(). In addition, the
example shows a call to a function OS21_TRACE_PRINT(), which prints a string into the
trace buffer.
1.2
User trace definition file
To trace an application for OS21 kernel activity, OS21 APIs or both, instrumented versions
of the OS21 libraries must be linked with the application. The same principles are also true
for tracing user defined APIs and activities.
The first step is to write a user trace definition file, specifying the APIs and events to be
traced. The Perl script os21usertrace uses this file to generate all the output files required
to build a version of the application that is instrumented for tracing user APIs.
Doc ID 8254555 Rev A
3/19
Example of performing a user API trace
ST40 toolset user trace support
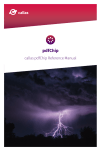
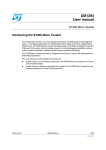
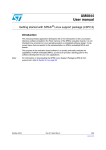
In Figure 3, the trace definition file myapp.def describes the function to trace, led_on().
Figure 3.
Example user trace definition file
The definition of led_on() indicates that the function has a return type of void, and
accepts two parameters, both of which are 32-bit (double word) integers (as indicated by
{int@d}).
Note:
See the “OS21 Trace” chapter in the ST40 Micro Toolset user manual (7379953) for more
information concerning the user trace definition file.
Using this file as input, the Perl script os21usertrace generates the following files:
4/19
●
a control file (for example, myapp.in)
●
a GDB command script file (for example, myapp.cmd) to allow calls to led_on() to be
captured and viewed in STWorkbench’s trace view
●
a linker script file (for example, myapp-wrap.ld) to pull in a instrumented version of
led_on()
●
a source file (for example, myapp-wrap.c) that wraps the function led_on() to
provide the necessary instrumentation
Doc ID 8254555 Rev A
ST40 toolset user trace support
Example of performing a user API trace
Use the following command line to process the example trace definition file myapp.def of
the LED example:
os21usertrace -d myapp.in -g myapp.cmd -l myapp-wrap.ld -s
../myapp-wrap.c ../myapp.def
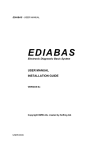
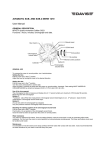
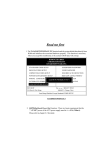
This command line can be invoked directly from a command console, either by a user
supplied makefile or by STWorkbench. If processing the command using STWorkbench,
specify the command as a pre-build step. This is seen in the Project Properties window
(see Figure 4).
Figure 4.
Note:
Project properties window
Windows requires double quotes around the invocation of the os21usertrace tool (as
shown in Figure 4). On Linux, the double quotes are not required.
Doc ID 8254555 Rev A
5/19
Example of performing a user API trace
1.3
ST40 toolset user trace support
Compiling the application
The application can be compiled as normal, with the exception of the generated source file
(myapp-wrap.c), the file that wraps the function led_on() to provide the necessary
instrumentation. This source file must be compiled with the optimization option
-fno-zero-initialized-in-bss, which ensures that control data is initialized at the
point when the application is loaded into memory. This is set up in STWorkbench by
specifying the option in the Properties for this source file, as shown in Figure 5.
Figure 5.
6/19
Source File Properties window
Doc ID 8254555 Rev A
ST40 toolset user trace support
1.4
Example of performing a user API trace
Linking the application
When the application has been compiled, the next step is to link it. The application is linked
in the normal manner; however, to enable the application to be traced, remember to use the
–trace linker option. The user can also use the –trace-api linker option to trace calls to
the OS21 API together with all OS21 kernel activity. To trace the user API led_on(), the
generated linker script file (myapp-wrap.ld) must be specified in order to link in the
instrumented version of led_on(). This is done by adding the option
-Wl,@myapp-wrap.ld to the linker command line. In STWorkbench, this is set up in the
Linker flags field of the Project Properties window, as shown in Figure 6.
Figure 6.
Project Properties window showing the -Wl,@myapp-wrap.ld option
Doc ID 8254555 Rev A
7/19
Example of performing a user API trace
ST40 toolset user trace support
When the build options have been set in STWorkbench, the example can be built. When
building the application in STWorkbench, the operation generates the command lines
shown in Figure 7.
Figure 7.
Console window output when building the example
**** Build of configuration Debug for project led.out ****
make pre-build main-build
"os21usertrace" -d myapp.in -g myapp.cmd -l myapp-wrap.ld -s ../myapp-wrap.c ../myapp.def
' '
'Building file: ../led.c'
'Invoking: ST40 C Compiler'
sh4gcc -D__mb680sti7105__ -O0 -g -Wall -c -fmessage-length=0 -mboard=mb680sti7105
-mruntime=os21 -ml -trace -trace-api -MMD -MP -MF"led.d" -MT"led.d" -o"led.o" "../led.c"
'Finished building: ../led.c'
' '
'Building file: ../main.c'
'Invoking: ST40 C Compiler'
sh4gcc -D__mb680sti7105__ -O0 -g -Wall -c -fmessage-length=0 -mboard=mb680sti7105
-mruntime=os21 -ml -trace -trace-api -MMD -MP -MF"main.d" -MT"main.d" -o"main.o"
"../main.c"
'Finished building: ../main.c'
' '
'Building file: ../myapp-wrap.c'
'Invoking: ST40 C Compiler'
sh4gcc -D__mb680sti7105__ -I. -O0 -fno-zero-initialized-in-bss -g -Wall -c
-fmessage-length=0 -mboard=mb680sti7105 -mruntime=os21 -ml -MMD -MP -MF"myapp-wrap.d"
-MT"myapp-wrap.d" -o"myapp-wrap.o" "../myapp-wrap.c"
../myapp-wrap.c:8:17: warning: led.h: No such file or directory
../myapp-wrap.c: In function 'user_api_set_group_custom_class_enable':
../myapp-wrap.c:38: warning: enumeration value 'user_api_group_custom_class_EOF' not
handled in switch
../myapp-wrap.c: In function 'user_api_set_group_enable':
../myapp-wrap.c:54: warning: enumeration value 'user_api_group_EOF' not handled in switch
'Finished building: ../myapp-wrap.c'
' '
'Building target: led.out'
'Invoking: ST40 C Linker'
sh4gcc -Wl,@myapp-wrap.ld -mboard=mb680sti7105 -mruntime=os21 -ml -trace -trace-api
-o"led.out" ./led.o ./main.o ./myapp-wrap.o
'Finished building target: led.out'
' '
This is the output seen in STWorkbench’s console window. If you are not using
STWorkbench to build the example, then these commands can be entered in a command
console directly or can be used to write a user supplied makefile.
8/19
Doc ID 8254555 Rev A
ST40 toolset user trace support
1.5
Example of performing a user API trace
Tracing the application
When the application has been built, it can then be debugged and traced with the
STWorkbench debugger. When the STWorkbench debugger has been launched, start a
trace on the application by clicking the Start New Analysis icon, found in the Debug
window. This opens the Start System Analysis window (see Figure 8).
Figure 8.
Start System Analysis window
Doc ID 8254555 Rev A
9/19
Example of performing a user API trace
ST40 toolset user trace support
In this window you can select which OS21 kernel activity events and which OS21 APIs to
record. To include user defined API in the trace, the GDB command script file generated by
the Perl script os21usertrace must be loaded. This is done by clicking on the button Load
GDB command script file… and selecting the appropriate file (see Figure 9).
Figure 9.
Select GDB command script file
When the command script has been loaded, select which User API to record. Click on OK to
start tracing the application.
To stop gathering trace data, click on the Stop Analysis button in the Debug window.
STWorkbench immediately displays the recorded trace data in a chart (see Figure 10).
Figure 10. Trace data displayed in a T-chart
Included in the trace records are calls to led_on(), as shown under the mouse pointer in
Figure 10. It is also possible to search for these calls in the accumulated raw data using the
trace search facility. This is selected by clicking on the relevant icon found at the top of the
window. Figure 11 shows example output from trace search.
Figure 11. Search on the gathered trace data for led_on()
10/19
Doc ID 8254555 Rev A
ST40 toolset user trace support
Example of performing a user API trace
Finally, calls to the function OS21_TRACE_PRINT(), which prints a user-defined string into
the trace buffer, are highlighted using a yellow flag. See Figure 12 for an example.
Figure 12. Calls to OS21_TRACE_PRINT() highlighted with a yellow flag
“Switching on LED”
Doc ID 8254555 Rev A
11/19
User API trace and events in STAPI SDK
ST40 toolset user trace support
2
User API trace and events in STAPI SDK
2.1
Overview
An example written by the ST40 Micro Toolset team is available. When applied to STAPI
SDK v0.23 onwards, it provides the OS21_TRACEUSER make variable. When this make
variable is set, it prepares the STAPI SDK application so that a subset of STAPI SDK API
and events can be traced. The framework of this example can be customized by the user to
extend or reduce the number of STAPI SDK API and events that can be traced.
2.2
Installing the example
The example, providing the OS21_TRACEUSER make variable in STAPI SDK, is available on
request by contacting your FAE or ST customer contact.
To apply the example simply unpack it over the top of the STAPI SDK installation. A
readme.txt file is also unpacked at the top directory, and this explains which STAPI SDK
files have been modified and which files have been added.
If the OS21_TRACEUSER make variable is not set, then STAPI SDK can be built and will run
as normal. There are no side-effects to the normal behavior of STAPI SDK after this
example has been applied.
2.3
Building STAPI SDK for user API trace and events
As standard, STAPI SDK already provides the make variables listed in Table 1 to allow the
STAPI SDK application to be profiled using the OS21 Profiler and traced for OS21 events
(task creation, interrupt handler installed, context switch and so forth) and OS21 API calls.
Table 1.
Default Make variables in STAPI SDK
Make variable
Description
OS21_TRACE
Link the application with the -trace option to enable OS21 trace support.
OS21_TRACEAPI
Link the application with the -trace -trace-api
-trace-api-no-time options to initialize OS21 trace support and OS21
API tracing, except for the time functions.
OS21_PROFILER
Link the application with the -profiler option to initialize OS21 profiler
support.
The example extends this list by providing the additional OS21_TRACEUSER make variable.
When building the STAPI SDK application so that a subset of STAPI SDK API and events
can be traced, both the make variables OS21_TRACEUSER and OS21_TRACE must be set.
The make variable OS21_TRACEAPI can be set to also include calls to the OS21 API in the
trace.
Normally the STAPI SDK application is not be prepared for OS21 profiling at the same time
as OS21 tracing, although this is possible.
12/19
Doc ID 8254555 Rev A
ST40 toolset user trace support
User API trace and events in STAPI SDK
Use the following command line to build STAPI SDK to prepare it so that a subset of STAPI
SDK API and events can be traced along with OS21 events and API calls.
make apilib all OS21_TRACE=1 OS21TRACEAPI=1 OS21_TRACEUSER=1
If STAPI SDK is being built in STWorkbench, then enter the following in the Build command
field of the Project Properties window:
apilib all build_start_script_connect_st40 OS21_TRACE=1
OS21TRACEAPI=1 OS21_TRACEUSER=1
Figure 13. Settings in the Project Properties window to build STAPI SDK
2.4
Tracing the STAPI SDK application
When the STAPI SDK application has been built, it can be debugged and traced in the
STWorkbench debugger.
STAPI SDK can launch the STWorkbench debugger using the following command:
gmake debug STWORKBENCH=1
Alternatively, if STAPI SDK has been built in STWorkbench, then the debugger can be
launched when a debug configuration has been created.
Doc ID 8254555 Rev A
13/19
User API trace and events in STAPI SDK
ST40 toolset user trace support
Figure 14 shows a typical Run or Debug configuration for the STAPI SDK application.
Figure 14. Typical Run/Debug configuration for the STAPI SDK Application
14/19
Doc ID 8254555 Rev A
ST40 toolset user trace support
User API trace and events in STAPI SDK
After launching the STWorkbench debugger, start a trace on the application by clicking on
the Start New Analysis icon, found in the Debug window. This opens the Start System
Analysis window, as shown in Figure 15.
Figure 15. Start System Analysis Window
In this window, select which OS21 kernel activity events and which OS21 APIs to record. To
include user defined API in the trace, load the GDB command script file
stapp/userapi.cmd. To do this, click on the button Load GDB command script file… .
When this has been done, select in Available Tracepoints which STAPI SDK API and
events to record. Click on OK to start tracing the application.
To stop gathering trace data, click on the Stop Analysis button of the Debug window. As
soon as tracing stops, STWorkbench displays the recorded trace data in a chart (see
Figure 16).
Doc ID 8254555 Rev A
15/19
User API trace and events in STAPI SDK
ST40 toolset user trace support
Figure 16. A call to STEVT_Notify() is included in the trace
Included in the trace records are calls to the sub-set of STAPI SDK API and events.
16/19
Doc ID 8254555 Rev A
ST40 toolset user trace support
3
References
References
For in depth information on OS21 trace and User API trace features, refer to the “OS21
Trace” chapter of the ST40 Micro Toolset User Manual (7379953). Also refer to
STWorkbench Help for assistance on getting started using these facilities in
STWorkbench.
Doc ID 8254555 Rev A
17/19
Revision history
4
ST40 toolset user trace support
Revision history
Table 2.
18/19
Document revision history
Date
Revision
26-Apr-2010
A
Changes
Initial release.
Doc ID 8254555 Rev A
ST40 toolset user trace support
Please Read Carefully:
Information in this document is provided solely in connection with ST products. STMicroelectronics NV and its subsidiaries (“ST”) reserve the
right to make changes, corrections, modifications or improvements, to this document, and the products and services described herein at any
time, without notice.
All ST products are sold pursuant to ST’s terms and conditions of sale.
Purchasers are solely responsible for the choice, selection and use of the ST products and services described herein, and ST assumes no
liability whatsoever relating to the choice, selection or use of the ST products and services described herein.
No license, express or implied, by estoppel or otherwise, to any intellectual property rights is granted under this document. If any part of this
document refers to any third party products or services it shall not be deemed a license grant by ST for the use of such third party products
or services, or any intellectual property contained therein or considered as a warranty covering the use in any manner whatsoever of such
third party products or services or any intellectual property contained therein.
UNLESS OTHERWISE SET FORTH IN ST’S TERMS AND CONDITIONS OF SALE ST DISCLAIMS ANY EXPRESS OR IMPLIED
WARRANTY WITH RESPECT TO THE USE AND/OR SALE OF ST PRODUCTS INCLUDING WITHOUT LIMITATION IMPLIED
WARRANTIES OF MERCHANTABILITY, FITNESS FOR A PARTICULAR PURPOSE (AND THEIR EQUIVALENTS UNDER THE LAWS
OF ANY JURISDICTION), OR INFRINGEMENT OF ANY PATENT, COPYRIGHT OR OTHER INTELLECTUAL PROPERTY RIGHT.
UNLESS EXPRESSLY APPROVED IN WRITING BY AN AUTHORIZED ST REPRESENTATIVE, ST PRODUCTS ARE NOT
RECOMMENDED, AUTHORIZED OR WARRANTED FOR USE IN MILITARY, AIR CRAFT, SPACE, LIFE SAVING, OR LIFE SUSTAINING
APPLICATIONS, NOR IN PRODUCTS OR SYSTEMS WHERE FAILURE OR MALFUNCTION MAY RESULT IN PERSONAL INJURY,
DEATH, OR SEVERE PROPERTY OR ENVIRONMENTAL DAMAGE. ST PRODUCTS WHICH ARE NOT SPECIFIED AS "AUTOMOTIVE
GRADE" MAY ONLY BE USED IN AUTOMOTIVE APPLICATIONS AT USER’S OWN RISK.
Resale of ST products with provisions different from the statements and/or technical features set forth in this document shall immediately void
any warranty granted by ST for the ST product or service described herein and shall not create or extend in any manner whatsoever, any
liability of ST.
ST and the ST logo are trademarks or registered trademarks of ST in various countries.
Information in this document supersedes and replaces all information previously supplied.
The ST logo is a registered trademark of STMicroelectronics. All other names are the property of their respective owners.
© 2010 STMicroelectronics - All rights reserved
STMicroelectronics group of companies
Australia - Belgium - Brazil - Canada - China - Czech Republic - Finland - France - Germany - Hong Kong - India - Israel - Italy - Japan Malaysia - Malta - Morocco - Philippines - Singapore - Spain - Sweden - Switzerland - United Kingdom - United States of America
www.st.com
Doc ID 8254555 Rev A
19/19