1
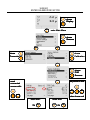
Universal Light Meter ULM-500 User Manual 7.100 / 06.2009 2nd edition (May 2012) Heinz Walz GmbH, 2009 Heinz Walz GmbH Eichenring 6 91090 Effeltrich Germany Tel. +49-(0)9133 / 7765-0 Fax +49-(0)9133 / 5395 E-Mail: [email protected] Internet: www.walz.com ULM-500 ENTER CALIBRATION FACTOR chose Display MENU enter Main Menu chose Sensors MENU MENU chose Connector chose Calibration MENU chose PAR Sensors MENU mark connected sensor with: adjustment with: ESC MENU MENU also chose unit finish with: 3x ESC finish with: SAVE OK 4x ESC CONTENTS 1 Safety Instructions ....................................................................... 1 2 Assembling the ULM-500 ............................................................ 2 2.1 The Keypad............................................................................... 5 3 Input of Calibration Values......................................................... 6 3.1 Order of measuring windows. ................................................... 8 3.1.1 The PAR Window............................................................... 9 3.1.2 The Leaf-Clip Window ....................................................... 9 3.1.3 The Air Sensor Window ................................................... 10 3.1.4 The Chart Window............................................................ 10 3.2 Before the Measurement ......................................................... 12 3.2.1 Changing Calibration Factors ........................................... 14 3.2.2 Measure Settings............................................................... 15 3.2.3 Device Settings ................................................................. 18 3.2.4 Applications ...................................................................... 19 3.2.5 User Applications ............................................................. 21 3.2.6 Info.................................................................................... 22 3.2.7 Memory............................................................................. 22 4 Connection to the Computer ..................................................... 23 5 Operating the ULM-500 via WinControl-3 ............................. 24 5.1 The Initial Tab / Chart Tab ..................................................... 24 5.1.1 Main Menu Bar - Box (1) ................................................. 25 5.1.2 Data Management and Graph Design - Box (2) ............... 26 5.1.3 Sidebar - Box (3)............................................................... 28 5.1.4 Online Values - Box (4).................................................... 30 5.1.5 Triggered Data - Box (5)................................................... 30 5.1.6 Store Data Point - Box (6) ................................................ 30 CONTENTS 5.1.7 Protocols - Box (7)............................................................ 30 5.1.8 Graph, Data and Fluorometer Settings Tabs - Box (8) ..... 31 5.1.9 Axis Control - Box (9) ...................................................... 31 5.1.10 Ordinate Selection and Text Field - Box (10)................... 32 5.1.11 Chart - Selecting Data....................................................... 33 5.2 The Report Tab ....................................................................... 34 5.2.1 Data Management and Graph Design - Box (2) ............... 35 5.2.2 The Report Data Field – Box (11) .................................... 37 5.3 The Memory Tab .................................................................... 37 5.3.1 Box (12) – Memory Operations........................................ 38 5.4 The Settings Tab ..................................................................... 39 5.4.1 Chosen Instrument and Reset button - Box (12)............... 39 5.4.2 Instrument Settings - Box (13).......................................... 40 5.4.3 Instrument Information - Box (14) ................................... 42 5.4.4 System Settings – Box (15)............................................... 43 6 Technical Specifications*........................................................... 45 7 Warranty Conditions ................................................................. 47 SAFETY INSTRUCTIONS 1 Safety Instructions Instructions. Read all the safety instructions and operating instructions thoroughly before using the device for the first time. Keep these safety instructions and operating instructions somewhere safe in case you need to refer to them again in the future. Safety warnings. Pay heed to safety warnings on the device and in the operating instructions. Follow the instructions for operation and use of the device in every respect. Temperature. Do not install the device near any heat sources such as radiators, hot-air dryers, ovens, etc. Do not place naked flame sources, such as lighted candles or Bunsen burners, on or near the device. Moisture. Keep this device out of the rain and away from moisture. Do not expose the apparatus to dripping or splashing and do not place any object filled with liquid, such as drinking vessels, beakers or test tubes, on or close to the device. Never use the device near water, for example near a sink. Solid objects. Take great care to ensure that no sharp objects penetrate inside the device through openings of the casing. Service. Do not open the casing. There are no user serviceable parts inside. Refer all servicing to qualified service personnel. Servicing is required when the apparatus has been damaged in any way, e.g., by exposure to wet conditions, excessive heat, or has been dropped. Power source. Connect the device only to the 5 Volt power source of a USB socket of a computer using the USB cable supplied with the device. Run the USB cable so that no one can step on it and nothing can rest on or against it. Device not in use. If you are not going to use the device for some time, remove the plug from the socket and remover the batteries.. Cleaning. Clean only with dry cloth. 1 THE ULM-500 INSTRUMENT 2 Assembling the ULM-500 The ULM-500 can be connected with sensors via BNC standard connectors (Bayonet Neill-Concelman, PAR #1 and #2) shown in the image below: Fig. 1 configuration of ULM-500 sensor connectors After connecting new sensors to the ULM-500 please do not forget to check the calibration factors needed! (Chapter 2) Two further optional accessories used mainly on Monitoring-PAMs, the leaf-clip holder (e.g. MONITORING-LC JUNIOR-B or MINIPAM-LC 2030-B) and the Air-Sensor (Humidity and Temperature – not available yet) can be connected via the panel plugs 1 and 2 (located inbetween the BNC connectors). Insert batteries like indicated in figure 2. Open the battery compartment by pushing the release of the back cover. 2 THE ULM-500 INSTRUMENT Insert four AAA batteries (1.5 V) with the correct and polarity (marked in the compartment). Fig. 2 Polarity of the batteries Close the battery compartment completely again before using. NiCd or NiMH cells are also possible but can not be charged when inserted. Under extreme low temperature (0°C) 1.5V Li-cells are recommended. When placing the ULM-500 into storage for a longer time, please make sure that no batteries are inserted. 3 THE ULM-500 INSTRUMENT Fig. 3 Connecting sensors to the ULM-500 (here: BNC to PAR #1) To connect a male BNC plug to PAR #1 or #2 push and carefully right-turn the connector as shown in Fig. 3 The connectors used for the panel plugs 1 and 2 need to be screwed to get good contact with the accessory sensors. 4 THE ULM-500 INSTRUMENT 2.1 The Keypad The ULM-500 keypad offers six buttons which from which have more than one function. ON/OFF switches the instrument on or off when held for more than 3 seconds. Additionally the display illumination can be switched on with this button by pressing it shortly while the ULM-500 is already switched on. Illumination will switch off automatically after 40 seconds to save battery power. SAVE freezes the display during a measurement and stores the recent data (HOLD is shown in the lower left display corner). A new line in the report is produced. ESC is normally used to navigate back to the previous menu item when it is pressed once shortly. When being deeper in the settings menu ESC can be held for some seconds to go completely back to the starting window. MENU is used to enter the menu for changing settings. The key is also used as an “enter” button to confirm settings. The arrow indicates that it moves forward in a menu or on a screen. UP/DOWN buttons are used for the navigation inside a menu. They control the cursor position (which is displayed on the screen as inverted field). 5 MENU AND OPERATION 3 Input of Calibration Values After having connected all necessary sensors to the ULM-500 the instrument needs Calibration factors before the first accurate measurement can start. Only leaf-clips that like the JUNIOR-B, 2030-B or 2060-M do not need calibration factors. Nevertheless they might need to be calibrated from time to time as it is necessary for all sensors. Touch the “ON” key and the instrument will wake up with a short beep and show the start screen - similar to the screen shown below. Fig. 4 Starting screen with two PAR sensors and a leaf clip connected. Line 1 and 2 show the chosen sensors connected via BNC. 3 is the perceptual difference between these sensors. 4 and 5 are sensors connected via the panel plugs. 6 is the recent time and date in the instrument The first two lines of the start-screen show the values measured with the sensors connected to PAR #1 and PAR #2 (second line). The “µ” is used instead of the PAR unit µmol/m-2s-1 (via WinControl-3 the shown unit can be exchanged against a W (for Wm-2) in case a pyranometer for the measurement of the solar irradiance is connected to the ULM-500). In the third line “Att” is the attenuation index as perceptual loss of PAR intensity between sensors connected via PAR #1 and PAR #2. The third line also shows the internal temperature of the ULM-500 (this 6 MENU AND OPERATION value may differ from the ambient temperature when the ULM-500 is operated in sunlight). The parameter “Air” in the fifth line of the start screen refers to a humidity sensor that will be available in the near future. The first value shown is the relative humidity calculated from the temperature sensor built in this “air” sensor and the absolute humidity measured (this sensor is connected via panel plug 2 – Fig 1). In the last line the recent time and date used in the instrument is indicated (these values can be set via the ULM-500 or automatically via WinControl-3 software when the ULM-500 is connected). When switching the instrument on for the first time, there is only a standard set of calibration values for typical PAR sensors stored. The sensor names can be defined via WinControl-3 software (chapter 4) and also the most important calibration factors can be entered via WinControl-3 but also the ULM-500 directly (in this case the sensor names can not be changed). . The ULM-500 will remember the last screen used, when it is switched on the next time. There are four more screens available in the ULM-500, each focuses on a different set of parameters, accessories or sensors. By using the “up” or “down” button one can switch from one screen to another beginning with the normal starting screen. After switching off the ULM-500 it will automatically show up with the last measuring window used after switching it on again.. 7 MENU AND OPERATION 3.1 Order of measuring windows. In the image below the order of measuring windows is shown when the “down” arrow button is used. Scrolling through these windows is also possible by using the “up” arrow button to navigate in the opposite direction. 1 2 4 3 5 From here the instrument can be switched off at any time by pressing the “off” button for three seconds (pressing this button once shortly will activate the display illumination for 5 mins). From this measure mode, the menu can be entered by pressing “MENU” on the keypad of the ULM-500. 8 MENU AND OPERATION 3.1.1 The PAR Window The PAR window displays values coming from sensors connected via the BNC connectors to PAR #1 and #2 (see also Fig. 1). In this case it is of great importance that the calibration factors for the sensors are set correctly (please also read chapter 3.2 and 3.2.1). The parameter “Att” in the third line stands for the attenuation index that is calculated as perceptual difference between the both sensors connected to PAR #1 and #2. At the end of the line, the internal temperature of the instrument is shown. Please note that this temperature may differ from the ambient temperature when the ULM-500 is operated e.g. in sunlight. Below date and time stored in the instrument are shown (can be synchronized with the system time of a computer via WinControl-3 software – chapter 5). 3.1.2 The Leaf-Clip Window In case the 2030-B leaf-clip holder or the sensor set 2060-M shall be used for light and temperature measurement with the ULM-500, an optional adapter cable (2030-B/ULM) is necessary. 2030-B and 2060-M carry a thermocouple and a light sensor and are normally used together with the MINI-PAM, PAM-2500 or JUNIOR-PAM. These two parameters are shown in bigger letters in the leaf-clip screen. Additionally also the date and time is displayed. 9 MENU AND OPERATION 3.1.3 The Air Sensor Window The “Air” sensor is not yet available. 3.1.4 The Chart Window In the chart window the recent changes of the incident radiation can be observed (PAR #1 channel). Maximum, minimum and average values (left) are shown in addition to the graphic. This screen is also used for the triggered measurement (chapter 3.2.2). The timeline displayed can be switched from 1.2 to 2.4 seconds in the measure settings “chart” in chapter 3.2.2. Fig. 5 Typical shape of light flashes from different light sources. The right saturating pulse has been recorded from a Diving-PAM which is using a halogen lamp; the left curve is derived from a PAM-2500 working with fast red LEDs. The curves are shown normalized to fit them into the chart screen. The measured amplitude is displayed as value below the chart. When the trigger has been activated the chart runs as long as the trigger level is not yet reached. In case the ULM-500 registers a fast increase of 10 MENU AND OPERATION the radiation the graphic will stop so that the shape of the flash and its values can be evaluated on the display. Also without having the trigger activated the chart can be stopped. Pressing “SAVE” freezes the chart. The chart window now displays the message “HOLD” in the lower left corner. The chart can be released again by pressing “ESC” and the trigger is still activated again (if it has been activated before). The graphic is not saved; a continuous record of the radiation can be achieved when the ULM-500 is used together with the WinControl-3 software. In this case the recording time is not limited. 11 MENU AND OPERATION 3.2 Before the Measurement Please always check the calibration values for the chosen sensors before the measurement Checking the sensor settings for the PAR channels is really easy – starting e.g. with #1 from any of the parameter screens pressing “Menu” will switch one level deeper into the calibration settings. To make the navigation easier, the ULM-500 remembers the position in the menu that you chose last time and displays it inverted. Moving the active field is done by using the “up” and “down” arrow buttons. With the “ESC” key the display jumps one step back in the menu. Going completely back to the start screen is possible by pressing the “ESC” button for 3 seconds from any position in the menu. At the end of the navigation a window with the stored sensor types/names and settings appear (lowest image). In the case shown, the setting for the PAR channel #1 is shown. The “X” at the end of a line marks the sensor chosen for channel #1 is named “Cosine” in this case its calibration factor is 150 (shown as rounded value - can be edited in the “PAR Calib.” window described below) 12 MENU AND OPERATION If another sensor (already stored) shall be chosen, the cursor (inverted field) can be moved up or down and entered by pressing “MENU” once again. Also a second page with five more sensors can be chosen (2nd Page). Under “Leafclip” also the optional leaf-clip holder connected to the ULM-500 can be defined. In the case of a MINI-PAM or PAM-2500 leaf clip holder (2030-B) or the sensor set 2060-M an additional adapter cable is necessary (2030-B/ULM) and the setting has to be “MINIPAM LC”. When a leaf clip from a JUNIOR-PAM shall be connected (JUNIOR-B), “MONITORING LC” has to be chosen to get correct measurements. This can also be done via the WinControl-3 software (chapter 5.4). 13 MENU AND OPERATION 3.2.1 Changing Calibration Factors Connecting a new or different radiation sensor normally needs a change of calibration factors prior to the measurement. Please use the “up” and “down” arrow buttons, “Menu” and “ESC” as described in the chapter 3.1.1 to navigate in the ULM-500 menu. Going completely back to the start screen is possible by pressing the “ESC” button for 3 seconds. In the “PAR Calib.” window the calibration factors for each radiation sensors can be edited (this can also be a pyranometer). Just move the inverted field (cursor) to the desired line (“up” and “down”), afterwards press “MENU” to enter the calibration factor digits. The value can be changed digit by digit - “up” and “down” increase or decrease the digit. “MENU” moves the cursor to the next digit of the calibration factor. Pressing “ESC” for 3 seconds moves to the very start of the settings menu and confirms the changed settings. The ULM-500 stores up to 10 calibration factors shown on two pages in the menu. While the factors themselves can be edited directly in the ULM-500, it is not possible to change the sensor names in the field without using a computer. This can only be done with the help of the WinControl-3 software that has been 14 MENU AND OPERATION shipped together with the instrument (please read more in chapter 4). 3.2.2 Measure Settings This menu point allows controlling the basic settings for the measurement like e.g. “Clock” or “Damping”. Clicking “MENU” once from the start screen and the navigation buttons (arrows “up”, “down” or “MENU”) enters the measure settings. Opens a new window with two parts “Chart” indicates the way to the second measure settings window Measure Settings I When the Clock is activated data are saved continuously with the set interval until it is manually switched off again. The clock time can be set between 10 s and 40 min in the line below. For long term data logging the ULM-500 offers a sleep mode to save battery power. This sleep mode is automatically active when a measuring interval of 1 min or more is chosen. In this case the instrument only switches on for the measurement and to save a new line for the report. Afterwards it will switch off automatically again. The sleep phase can be interrupted at any time by pressing “ON”. 15 MENU AND OPERATION The electronic damping reduces the noise in the radiation signal measured with the ULM-500 (only channel #1!). “On” or “Off” can be chosen as setting. Since the damping may in some cases interfere with the “Auto Range” function it is recommended to use damping “on” rather together with a manually chosen range (Auto Range “off”). In case of pulsed light (PAM light or fluorescent light) it is also recommended to use the Damping for the measurement. Normally it will be switched off for the fast measurement of saturating flashes. (chapter 3.2.4 Applications) “Auto Range” can be switched “On” or “Off”. When observing slow changing signals it is beneficial to chose “On” in case that no fast light changes are expected. In this case the ULM-500 can automatically find the best measuring range. When a high time resolution is needed for the measurement the range should be chosen manually. Set auto range “off”. The measuring range can be switched manually (auto range “off”) in 5 steps from 250 nA (range 5) to 2.5 mA (range 1). The correct range for a measurement depends on the expected light intensity and the technical specifications of the used radiation sensors. A common light sensor consists of a photodiode which produces an electric current upon illumination. A light sensor may have the calibration constant of 10 µA/1000 µmol m-2s-1. This would result in a calibration factor of 100 µmol m-2s-1 per µA. It will give a current of 1µA when illuminated with 100 µmol m-2s-1. For this example the ranges would look like in the following table. 16 MENU AND OPERATION Range minimum maximum [µmol m-2s-1] [A] [µmol m-2s-1] [A] 1 25 250 nA 0.0061 0.061 nA 2 250 2.5 µA 0.061 0.61 nA 3 2500 25 µA 0.61 6.1 nA 4 25000 250 µA 6.1 61 nA 5 250000 2.5 mA 61 0.61 µA Tab. 1 measuring ranges for an example sensor with an assumed calibration factor of 100. Measure Settings II Clicking on “Chart” navigates to a second page the chart settings page. In this window settings for the chart window can be defined (chapter 3.1.1). The chart window offers the option to just observe graphically the alterations in light intensity and can additionally record the values of a light flash e.g. that exceeds a previously defined trigger level (see below). Length defines the shown timescale of the chart window. The user can chose between 1.2 and 2.4 seconds recording time. This value is also used for the triggered recording of a light flash. 17 MENU AND OPERATION Switching “Trigger” on will enable the continuous display of the light value. The chart will freeze when a certain light level is reached (given under “Trig. Level”). The shape of the measured radiation change can be observed in the chart window (described under chapter 3.1.1). This function can be very useful for fast events e.g. saturating flashes of a PAM instrument. 3.2.3 Device Settings In the device settings some basic parameters like the temperature unit (°C to °F), time and the beeper can be changed. These settings do not influence the measurement, but the resulting report (absolute time) and the handling of the instrument under some circumstances. All these items can also be edited via the WinControl-3 software more comfortably. The recent date used by the instrument can be edited by moving the cursor onto the Time/Date field in the device settings. Here every single field can be edited by using the arrow buttons and clicking “MENU” to activate the digits. Afterwards each item can be changed. Using the Computer (WinControl-3 software) provides an automated protocol via the settings tab in WinControl-3 that synchronizes time and date between computer and ULM-500 with just one click (chapter 5.4.1). 18 MENU AND OPERATION The status LED is the signal light in the lower left corner of the ULM-500. In case absolute darkness is needed, this blinking light can be switched off. The beeper normally helps to confirm a pressing of buttons. It can be switched on or off in the device settings. In case the ULM-500 is battery powered only, it will automatically switch off when it is inactive for more than 5 minutes to save battery power. When the ULM-500 is connected to a computer, the batteries will not be used and the “auto off” function is switched off. The ULM-500 will stay on as long as it is not switched off. The contrast setting refers to the display contrast. Under strong or low ambient light conditions it might be helpful to change the contrast setting. Alternatively also the display illumination can be switched on by pressing the “on” button once shortly. The battery type adapts the ULM500 to different available battery types and helps to use them more efficiently without giving a battery warning too early (chapter 2). 3.2.4 Applications For rapidly adapting numerous parameters with a few clicks to a new measuring situation the “Applications” can be used. Five different applications are already preset and can not be changed by the user to avoid mistakes. On 19 MENU AND OPERATION the second page user settings can be stored so that the user can adapt the instrument to his special needs. These applications can also be used as a starting point for a measurement to make additional changes on this basis. To confirm or decline the chosen application Yes/No can be pressed and to take a look at the changed settings the “Info” field is used. Is used to get back to the standard factory settings of the ULM-500 and contains the following settings that can be found by clicking “Info”. Activates settings that are optimized to many opportunities that need the chart screen. For the recording of saturating pulses or other fast events a high time resolution is set and the trigger is switched on. The trigger level is optimized on really saturating flashes. 20 MENU AND OPERATION To reduce the noise in continuous measurements this application can be used due to the electronic damping the measured mean value shall be more accurate. For data logging the clock timer is needed. Standard interval is 5 minutes and can be changed afterwards. 3.2.5 User Applications On the second page of the applications the users can also define two sets of special settings for themselves. “User App.1” and “User App.2”activate certain settings that have been saved before via “Save as User 1” or 2. By pressing “MENU” in the first two lines the user applications can be applied or under info, the settings can be checked. For saving settings as User 1 or two, make the settings you would like to use under measure settings (chapter 3.2.2), navigate to the item “Save as User 1” or 2 in the applications and chose “Yes” or “No” to just leave. 21 MENU AND OPERATION 3.2.6 Info In the Info screen the recent firmware can be checked in case that updates are available. 3.2.7 Memory Via the memory screen the last measurements can be assessed. It the similar design as the normal start screen in the measure mode, but there is the remark “MEM” in the lower left corner of the screen. With the help of the up and down buttons one can navigate through the stored data sets indicated by the values and the changing time and date bottom line. The MEM function can be left at any time by just pressing “ESC” on the keypad of the ULM-500. 22 OPERATION VIA COMPUTER 4 Connection to the Computer On the bottom of the ULM-500 housing a B-connector for USB 2.0 cables is located. A cable for the connection with a PC (USB standard B to standard A) is provided with the instrument. The PC software WinControl-3, shipped together with the instrument, is used for the external control of the ULM-500 and can be used to rename the preset sensors, change the calibration factors. Furthermore the WinControl-3 software may function as a digital recorder for all the incoming sensor values. When WinControl-3 is started (with the ULM-500 connected to the computer) the software will automatically activate the light meter and start the communication with the instrument (during the connection the ULM-500 can still be controlled directly via its key pad). The handling of the WinControl-3 software is also described in our JUNIOR-PAM manual that can be downloaded from the support area of our homepage (www.walz.com). 23 OPERATION VIA COMPUTER 5 Operating the ULM-500 via WinControl-3 5.1 The Initial Tab / Chart Tab The software WinControl-3 offers the standard options of Windows operating systems to vary window sizes. Fig. 6 depicts the initial window of the WinControl-3 software. The window is graphically divided into 11 sections: 10 boxes and the chart area. The graphical divisions will be used for orientation during the subsequent introduction to WinControl-3 functions. Fig. 6 WinControl-3 Initial Window (Box numbers are described below) 24 OPERATION VIA COMPUTER 5.1.1 Main Menu Bar - Box (1) [File] [Load Data] Delete current data and load saved data. Note: loading data with [Rec. Online] checked (see Box (2)) will display the currently recorded data rather than the loaded data. To view the loaded data, select the [Rec.] tab in Box (3) and then record number [1]. [Save Data] Save all data of the current experiment. [Quit] Exit WinControl-3. [View] [Results Panel] Controls the display of Box (5) via mouse click. [Status Panel] Controls the display of Boxes (7) to (9) via mouse click. [Warnings] Ticking prompts the display of program starting time and non-critical errors. [Batch Window] Opens batch file window. Batch files are small programs for automated operation of WinControl-3 compatible devices. [Accessories] [Temperature Units] Allows to toggle between °Celsius and °Fahrenheit as unit of Temp* in Box (7), but does not affect the chart temperature ordinate. 25 OPERATION VIA COMPUTER [Record File] The command prompts WinControl-3 to continuously save data and, thereby, minimize data loss in the case of program failure. Execution of [Record File] is indicated by a tick, []. Data are saved in the PAM data file format (filename.pam). If an existing file name is selected, a dialogue window appears which offers the options to delete the existing file or to append the new data to data of the existing file. 5.1.2 Data Management and Graph Design - Box (2) [Delete All Data] Delete current data (all records and report data). [Load] Delete the current data and load previously saved data. Same function as [Load Data] in the [File] menu. [Save] Save all records of the current experiment. Same function as [Save Data] in [File] menu. [Print Chart] Print the current chart. [Switch Grid on/off] Graph design command. [View Symbols] Graph design command. [View Lines] Graph design command. Creates a floating chart window. Graph settings and data display of the new chart are independent of the WinControl-3 main window. Checking initiates continuous recording of Ft, PAR* and Temp*. [Rec. Online] does not affect the permanent feeding of the chard. For long-term measurements, [Rec. Online] may be turned off to keep data size reasonable. 26 OPERATION VIA COMPUTER [Sampling Frequency] The downward arrow gives access to three different sampling frequencies: [5/s], [1/s], and [1/10s]. The frequency setting affects only online data (Ft, PAR*, and Temp*, see below). The highest sampling frequency of [5/s] is available only for the Ft: sampling of PAR* and Temp* occurs with [1/s] at most. The actual intervals between measurements vary depending on communication between fluorometer and computer. The exact time points of measurements are recorded. Exported data correspond to online data along with the exact time values. [Options] includes three menu items of which two ([Zoom to Selection] and [Export Selection]) are available only after having selected data in the chart. To select data, place mouse cursor in the [Chart] area, move mouse cursor with left mouse button pressed parallel to the x-axis across the data of interest: the selection will be highlighted. The options menu is also available by placing the cursor within the selected area and clicking the right mouse bottom. A single left-button click in the chart area removes an existing selection. Export all graphed data (online and saturating [Export All] pulse analysis data) as CSV file which can be imported by most spread sheet or graphing programs. Exact ms time scales are provided for each measuring point. [Zoom to Selection] Choosing the command increases time axis resolution according to your selection. The action can be reversed by clicking in [Ax] button (Box 11). [Export Selection] Export selected data as CSV file similarly as described above (compare [Export All]). Checking Controls display of Box (3) 27 OPERATION VIA COMPUTER 5.1.3 Sidebar - Box (3) Three Tabs ([Val.], [Rec.] and [Chan.]) permit switching between different sidebars. In the [Val.] sidebar, all types of temperature, light and humidity data measurements and data calculated by WinControl-3 are represented by acronyms. The graphical presentation of data is controlled by checkboxes attached to the acronyms. In the sidebar, the data are distinguished into three groups, [ULM Online] data are continuously reported with the frequency defined in Box (2) and the reservation reported above. Please note that not all channels work with the same max. time resolution. These continuous values are marked with an asterisk. Additionally these values are shown in Box (4) “Online Values” The data group includes: PAR* Temp* Att.* PAR 1* and PAR2* signals coming from BNC channel #1 and #2 (chapter 1) Temperature (°C). In the absence of an external sensor, temperature is measured by an internal integrated-circuit sensor. Attenuation index (percental difference between the PAR sensors connected to BNC channel #1 and #2 LPAR* shows the PAR signals coming from a leaf-clip holder 2030-B or 2060-M connected via the optional adapter cable 2030-B/ULM. LTemp* displays temperature values send by a leaf-clip holder 2030-B or 2060-M (see LPAR* above). 28 OPERATION VIA COMPUTER [ULM triggered] data Triggered values are shown as symbols in the chart window. These symbols appear each time the button “S” in the Box (6) has been pressed or the automatic clock function stores a line in the report. The meaning of the abbreviations is similar to the ones described under [ULM online data] before. Here in the near future the humidity [Sensors online] sensor (air sensor) can be displayed in the chart by ticking. This sensor also carries a thermocouple for the calculation of the relative humidity. This sensor set is not yet available. [Rec.] sidebar Clicking the button [New Record] starts a new record which is added to the currently loaded data. The [Rec.] sidebar lists, as consecutive numbers, each experiment recorded since program start or since the last time the command [Delete All Data] was carried out. Each record can be selected, and displayed in the chart, by clicking on the record number. New induction or light curves are initiated by starting the corresponding automated exposure program (Box (9)). Several measuring periods can be logged during a single record. The [Chan.] sidebar lists all WinControl-3 compatible devices connected via USB to the computer. Note: only one JUNIOR-PAM can be operated by WinControl-3 at a time but the combination of 1 JUNIOR-PAM and other WinControl-3 compatible devices (higher-order PAM fluorometers or the light meter ULM-500) is possible. 29 OPERATION VIA COMPUTER 5.1.4 Online Values - Box (4) The Online values shown in Box (4) are continuously updated during the running measurement in the dedicated frequency of the used cannels 5.1.5 Triggered Data - Box (5) Triggered data are updated each time a new line in the report is produced. It represents digital values of current measurements of the [Online] data introduced above (see [Val.] sidebar). 5.1.6 Store Data Point - Box (6) Clicking the green “S” bottom will write a new line in the report with the recently measured values and will furthermore update the values in Box (5) “Triggered Data” 5.1.7 Protocols - Box (7) This box contains two check boxes for the control of triggering of the “saturation pulse”. This box is derived from the PAM instruments and does of course not switch the Sat pulse in the ULM-500 – only when there is an additional PAM connected and recognized. When switching on the clock, the time defined under the settings tab or in the field left (Clk. Time) will be used. On the right side of this box some basic parameters like the clock time are shown and the recent memory size used for data storage is displayed. In the case additional instruments are connected the values of the others can also be chosen here. 30 OPERATION VIA COMPUTER 5.1.8 Graph, Data and Fluorometer Settings Tabs - Box (8) [Chart] graph can be linked to fast fluorescence changes: selecting slow kinetics data, using the mouse with left button pressed, will highlight the corresponding fast kinetics in the [Report] or [SAT Graph] window. [Report] The window displays numerically the results of temperature and PAR measurements respectively saturating pulse data. Highlighting data in the [chart] graph will highlight the corresponding lines in the report data. [Memory] In this tab the instrument time of the ULM-500 can be synchronized with the computer and logged data of stand alone applications can be downloaded from the ULM. It is also possible to delete the memory of the ULM-500 from here [Settings] The settings window provides the commands required for full control of ULM-500 performance. 5.1.9 Axis Control - Box (9) [Manual Ordinate Scaling] Scaling of the ordinate (yaxis) can be manually adjusted by clicking the upward or downward pointing arrows in Box (9). Manual adjustment affects only the currently selected ordinate (see subsequent comments to Box (10)). This means that various ordinates can be individually scaled. Manual scaling in combination with the vertical scroll bar at the right chart border permits flexible positioning of data. [Automatic Ordinate Scaling] The command scales all data which are selected in Box (3) so that they fit on the chart. 31 OPERATION VIA COMPUTER [Manual Abscissa Scaling] Clicking the horizontally pointing arrows changes scaling of the abscissa (time axis). At increased time axis resolution, experimental data can be scrolled using the scroll bar on top of the chart area, or by placing the mouse pointer inside the chart and turning the mouse wheel. Normally, the chart ordinate is a relative time scale starting at 0. Checking [abs] prompts the display of absolute data including data and time of the day. Both, relative and absolute time data are saved when chart data are exported. [Automatic Abscissa Scaling] Scales the time axis so that the entire record fits into the chart. For Automatic Ordinate and Abscissa Scaling click the [Autoscale button]. It displays all graphed data on the chart. 5.1.10 Ordinate Selection and Text Field - Box (10) Clicking the downward arrow in Box (10) displays several different ordinate scales used for the various categories of data available (depending on the instruments connected). An ordinate can be picked by clicking with the mouse on one of the list items. Furthermore, Box (10) provides a text field to note down key information of the experiment. Each record can be labeled differently, and additional text fields are available for each induction or light curve. 32 OPERATION VIA COMPUTER 5.1.11 Chart - Selecting Data As described above, to select a section of graphed data, click with the left mouse button on the left border of the target data, and move the mouse with the left button held down to the right border of target data. Releasing the mouse button will highlight the selection made. Selection in the [chart] window highlights the corresponding data in the [Report Window] and [SAT Graph]. Similarly, data selected in the [Report Window] will are highlighted on the [Chart]. Fig. 7 Selecting Data from the WinControl-3 chart 33 OPERATION VIA COMPUTER 5.2 The Report Tab The report window logs all data associated with saturating pulse analyses. The boxes (2) to (3) indicated in Fig. below include specific functions for handling of [Report] data as explained below. Fig. 8 Typical report tab in WinControl-3 with ULM-500 connected, some measurements were already done with the JUNIOR-B monitoring leaf clip connected 34 OPERATION VIA COMPUTER 5.2.1 Data Management and Graph Design - Box (2) Clicking the [Print Report] button opens the printer dialogue window from which printing of all parameters present in the [Report Data Field] is initiated. The parameters printed are identical to the parameters displayed in the [Report] table. Parameter selection is controlled by the checkboxes in the [Val.] sidebar. In Box (11), the buttons for data handling ([Clear], [Open] and [Save]) have their usual function. Clicking on the [Options] button or rightclicking into the report data field opens the options menu. Checking [Follow Selection] in the options menu automatically displays selected data in the [Report Data Field]. Data can be selected in the [Chart] window as described above (see 5.1.11) or in the [Report Data Field] by moving the mouse cursor with left mouse button pressed across data lines. Provided that data have been selected, the [Jump to Selection] command is available which moves selected data into the [Report Data Field]. Printing report data The [Options] menu includes the command [Print Report] and two extra print options: [Page Setup for Printing] Adjust page design settings. [Preview Printing] Show the appearance of the printout. Provided that data have been selected, two additional print commands are available (see above). [Preview Print Selection] selected data. Visualize the print design of 35 OPERATION VIA COMPUTER [Print Selected Data] Print only selected data. Similar as described for printing, the Export report data parameters exported can be selected by the checkboxes on the sidebar. In analogy to the print commands: [Export All] exports all data in CSV (comma separated values) format which can be imported into most spread sheet programs and [Export Selected Lines] exports only the selected data. Table 5.2: Report Data - Abbreviations ULM D F FO REG1 REG1 SCHS SICE SICS SLCE SLCS 36 Dataset derived from an ULM-500 When other compatible instruments are connected, also the abbreviations below might appear. Identification of device: number, type and user annotation (see 5.6.1) SAT Normal operation and saturating flash Fo, Fm determination Parameters of regression 1 (see 6.4) Parameters of regression 2 (see 6.4) Start of new record/Chart start End of induction curve Start of induction curve End of rapid light curve Start of rapid light curve OPERATION VIA COMPUTER 5.2.2 The Report Data Field – Box (11) In addition to the parameters chosen from [Display Control] (Box (13)), the report data document time of action and type of data. Table 5.2 summarized the abbreviations used to log data types. 5.3 The Memory Tab In this tab the instrument time of the ULM-500 can be synchronized with the computer and logged data of stand-alone applications can be downloaded from the ULM. It is also possible to delete the memory of the ULM-500 from here. Fig. 9 Memory Tab in WinControl-3 37 OPERATION VIA COMPUTER 5.3.1 Box (12) – Memory Operations In Box (12) the internal time and date settings of the ULM-500 can be edited. This function is also available on the instrument directly. When the internal time of the ULM-500 is different from the used system time in the connected PC, the user will be also asked if time and date shall automatically be synchronized with the PC. With the help of the displayed button, this can also be done by hand during an experiment. The user can decide to clear a part or the complete memory. “Datasets” is the complete number of lines in the Memory. Also for the download the user can decide to transfer the complete dataset from the ULM-500 or only some lines. Clicking “Download” will start the process and will produce a complete report (in this window only part of the parameters is shown). After downloading data the measurements are not deleted from the ULM-500 memory. 38 OPERATION VIA COMPUTER 5.4 The Settings Tab The settings tab controls the function of the ULM-500, naming of sensors and their calibration. Fig. 10 The Settings Tab In this tab information like instrument information and basic settings of the hardware are shown. 5.4.1 Chosen Instrument and Reset button - Box (12) With the reset button the chosen instrument (here #10: ULM-500) can be set back to factory settings. All parameters except the sensor names will be changed. Additionally this box can also be used to personalize the instrument with a comment. In the case more than one WinControl-3 compatible instrument is connected to the computer; please make sure that the correct instrument is chosen before clicking the reset button. 39 OPERATION VIA COMPUTER 5.4.2 Instrument Settings - Box (13) [Selected Sensors] in the text field next to “PAR1:” and “PAR2:” the chosen sensors for BNC channels #1 and #2 are shown. In the example in Fig. 10 a sensor named “Cosine” is chosen to be connected to the fast BNC channel #1 of the ULM500. “Leaf Sensor” is set to MONITORING LC, which means that the instrument can also read incoming signals from a JUNIOR-B leaf clip holder. If a leaf-clip holder from a MINI-PAM / PAM-2500 (2030-B) or the sensor set 2060-M shall be connected the setting has to be switched to “MINI-PAM LC” [System Parameters] The System Parameters menu is homologue to the “Device Settings” also described in chapter 3.2.3 The [LED] is the signal light in the lower left corner of the ULM-500. In case absolute darkness is needed, this blinking light can be switched off. The [Beeper] normally helps to press the right buttons. It can be switched off in the device settings. [Auto Off] - In case the ULM-500 is battery powered only, it will automatically switch off when it is inactive for more than 5 minutes to save battery power. When the ULM-500 is connected to a computer, the batteries will not be used in this case the “auto off” function is switched off and the ULM-500 will stay on as long as it is switched off. [Battery Type] The battery type adapts the ULM-500 to two different available battery types and helps to use them more efficiently without giving a battery warning too early. 40 OPERATION VIA COMPUTER [Temp. Unit] temperature unit The user can chose between °F and °C as [Device Time] The recent date used by the instrument is shown in this field. It can not be edited by direct input from here, but it is possible to synchronize it with the system time of the PC connected. Direct editing of the ULM-500 time and date is possible in the ULM-500 menu directly (chapter 3.2.3). [Clock] When the Clock is activated data are saved continuously with the set interval until it is manually switched off again. The clock time can be set between 10 sec and 40 min in the field below by using the up and down buttons. [Input 1, PAR] For the BNC channel PAR #1 an electronic damping can be defined. The electronic damping reduces the noise in the radiation signal measured with the ULM500 (only channel #1!). Settings for the electronic signal damping: “On” or “Off” can be chosen. Since the damping may in some cases influence the “Auto Range” function it is recommended to use damping “on” rather together with a manually chosen range. In case of pulsed light (PAM light or fluorescent light) it is also recommended to use the Damping for the measurement. Normally it will be switched off for the fast measurement of saturating flashes. [Auto Range] can be switched “On” or “Off”. When observing slow changing signals it is beneficial to chose “On” in case that no fast measurements with high time resolution are done. In this case the ULM-500 can automatically find the best measuring range. When a high resolution is needed for the measurement the range should be chosen manually. Set auto range “off”. (Please find more information in chapter 3.2.2) 41 OPERATION VIA COMPUTER 5.4.3 Instrument Information - Box (14) In the Instrument Information the name and serial number of the chosen instrument is displayed. When calibration factors shall be changed on the right side the “System Settings” button can be found Clicking on the button “System Settings” will bring up a warning message, when clicked for the first time within a session. This warning appears since in the system settings window some important settings can be changed. 42 OPERATION VIA COMPUTER 5.4.4 System Settings – Box (15) Fig. 11 System Settings Tab The ULM-500 as well as the WinControl-3 software can store up to ten different calibration factors for different sensors. In the field [PAR Sensor Profiles] the stored sensor data can be applied to the both BNC channels #1 and #2. In the next line the calibration factors can be defined (normally given as negative value on the calibration sheet delivered with each sensor. Additionally the measuring unit can be defined (µ for µmol/m-2s-1 and W for Wm-2). Please find additional information in chapter 3. 43 OPERATION VIA COMPUTER [Int. Temp.], [Air Sensor] and [Select Leaf-Clip] offer calibration parameters like offset and gain for the calibration of optional or internal sensors and the available leaf clip holders. To learn more about the [Select Leaf-Clip] field please also read chapter 5.4.2 44 SPECIFICATIONS 6 Technical Specifications* Design light grey plastic housing with connectors, membrane keyboard and a white illuminated LCD graphic display Dimensions 12 x 7.5 x 3.5 cm Weight 210 g (including 4 AAA 1.5 V batteries) Power supply 4 AAA type batteries or 5 V DC from USB voltage source Operation time 100 h continuous working time. Ca. 2 month operation time using powerdown features. Unlimited working time via USB connection (PC-software WinControl-3) Working conditions 35 to 85 % rH (avoid condensation) -20 to +50 °C ambient temperature Inputs two light sensors: directly connected (via BNC), with individual calibration factors between -50.0 and -9999.9 (memory for 10 calibration factors). (2,5 mA in range 5 and 250 nA max.) Leaf-Sensor: cosine corrected PAR sensor at the level of the leaf combined with thermocouple for leaf temperature. (Leaf clip holder 2030-B or monitoring leaf clip (JUNIOR-B) Air-Sensor: humidity and air temperature for microclimate measurements close to the leaf (soon available). Memory flash memory used as ring buffer for 40.000 lines (single measurements). 45 SPECIFICATIONS Operation PAR channel #1 with 100 samples / second in the fast trigger mode. PAR channel #2 with 5 samples / second 5 samples / second (all channels – via WinControl-3 software) channel PAR #1 also 100 samples / second Software WinControl-3 software for PAM fluorometers Data/power cable 1.2 m USB-cable type A-B *Subject to change without prior notice 46 WARRANTY 7 Warranty Conditions All products supplied by the Heinz Walz GmbH, Germany, are warranted by Heinz Walz GmbH, Germany to be free from defects in material and workmanship for one (1) year from the shipping date (date on invoice). The warranty is subject to the following conditions: 1. This warranty applies if the defects are called to the attention of Heinz Walz GmbH, Germany, in writing within one year (1) of the shipping date of the product. 2. This warranty shall not apply to any defects or damage directly or indirectly caused by or resulting from the use of unauthorized replacement parts and/or service performed by unauthorized personnel. 3. This warranty shall not apply to any product supplied by the Heinz Walz GmbH, Germany which has been subjected to misuse, abuse, abnormal use, negligence, alteration or accident. 4. This warranty does not apply to damage caused from improper packaging during shipment or any natural acts of God. 5. This warranty does not apply to underwater cables, batteries, fiber optics cables, lamps, gas filters, thermocouples, fuses or calibrations. 47 WARRANTY To obtain warranty service, please follow the instructions below: 1. The Warranty Registration form must be completed and returned to Heinz Walz GmbH, Germany. 2. The product must be returned to Heinz Walz GmbH, Germany, within 30 days after Heinz Walz GmbH, Germany has received written notice of the defect. Postage, insurance, custom duties, and/or shipping costs incurred in returning equipment for warranty service are at customer expense. 3. All products being returned for warranty service must be carefully packed and sent freight prepaid. 4. Heinz Walz GmbH, Germany is not responsible or liable, for missing components or damage to the unit caused by handling during shipping. All claims or damage should be directed to the shipping carrier. Heinz Walz GmbH Eichenring 6 91090 Effeltrich Germany Tel. +49-(0)9133 / 7765-0 Fax +49-(0)9133 / 5395 E-mail: [email protected] Internet: www.walz.com 48 ALPHABETICAL INDEX µmol/m-2s-1 ...............................................................................6, 43 2030-B......................................................................2, 9, 13, 28, 40 2030-B/ULM .................................................................................9 2060-M.........................................................................9, 13, 28, 40 Abscissa Scaling..........................................................................32 absolute time ...............................................................................32 Air ................................................................................................10 Air Sensor................................................................................2, 44 ambient temperature....................................................................9 applications .................................................................................19 arrow button .................................................................................8 Assembly .......................................................................................2 Att ..............................................................................................6, 9 Att.* .............................................................................................28 attenuation index ..........................................................................9 Auto Off.................................................................................19, 40 Auto Range..................................................................................16 Automatic Abscissa Scaling.......................................................32 Automatic Ordinate Scaling ......................................................31 Autoscale .....................................................................................32 Axis Control ................................................................................31 Batch Window ............................................................................25 49 ALPHABETICAL INDEX battery compartment ...................................................................2 Battery Type .........................................................................19, 40 beeper ..........................................................................................19 BNC .....................................................................................2, 4, 40 calibration constant....................................................................16 calibration factor ..............................................................2, 14, 16 Calibration Values........................................................................6 Chan. ...........................................................................................29 chart...........................................................................10, 17, 31, 33 Chart Window ............................................................................10 clear memory ..............................................................................38 Clock......................................................................................15, 41 Computer ....................................................................................23 connecting sensors ........................................................................4 continuous recording..................................................................26 contrast........................................................................................19 Cosine ..........................................................................................40 Damping ......................................................................................16 Data/power cable ........................................................................46 Delete All Data......................................................................26, 29 Device Settings ............................................................................18 Device Time.................................................................................41 50 ALPHABETICAL INDEX Dimensions ..................................................................................45 Display Control...........................................................................37 display illumination......................................................................8 Download ....................................................................................38 ESC ................................................................................................5 Export..........................................................................................36 Export All..............................................................................27, 36 Export Selected Lines.................................................................36 Export Selection..........................................................................27 fast measurement........................................................................16 File ...............................................................................................25 floating chart...............................................................................26 fluorescent light ..........................................................................16 HOLD ..........................................................................................11 Humidity .......................................................................................2 illumination ...................................................................................8 incident radiation .......................................................................10 Info...............................................................................................22 Input 1, PAR ...............................................................................41 Inputs...........................................................................................45 Instrument Settings ....................................................................40 Int. Temp.....................................................................................44 51 ALPHABETICAL INDEX internal temperature ....................................................................9 irradiance ......................................................................................6 JUNIOR-B.........................................................................2, 13, 34 JUNIOR-PAM ............................................................................29 keypad ...........................................................................................5 Leaf Sensor..................................................................................40 Leaf-Clip Window ........................................................................9 LED..............................................................................................40 Length..........................................................................................17 light sensor ..................................................................................16 Load.............................................................................................26 Load Data....................................................................................25 LPAR* .........................................................................................28 LTemp* .......................................................................................28 Manual Abscissa Scaling ...........................................................32 Manual Ordinate Scaling...........................................................31 Measure settings .........................................................................15 Measurement ..............................................................................12 measuring windows ......................................................................8 MEM............................................................................................22 Memory ...........................................................................22, 31, 45 Memory Operations ...................................................................38 52 ALPHABETICAL INDEX Memory Tab ...............................................................................37 MENU........................................................................................5, 8 MINI-PAM....................................................................................2 MINI-PAM LC .....................................................................13, 40 MONITORING LC..........................................................2, 13, 40 NiCd...............................................................................................3 NiMH .............................................................................................3 noise .............................................................................................21 OFF................................................................................................5 ON..................................................................................................5 Online data..................................................................................28 Online Values..............................................................................30 Operation ....................................................................................46 Operation time............................................................................45 Options ........................................................................................35 Ordinate Scaling.........................................................................31 PAM.............................................................................................16 PAR............................................................................................6, 9 PAR #1.................................................................................2, 4, 41 PAR #2.......................................................................................2, 4 PAR 1*.........................................................................................28 PAR Window ................................................................................9 53 ALPHABETICAL INDEX PAR2*..........................................................................................28 PC software.................................................................................23 Power supply...............................................................................45 Print Chart..................................................................................26 Print Report ................................................................................35 Protocols......................................................................................30 Quit ..............................................................................................25 radiation sensors.........................................................................16 Range ...........................................................................................16 Rec. ..............................................................................................29 Record File ..................................................................................26 recording time.............................................................................11 relative time ................................................................................32 Report..........................................................................................31 Report Data Field .......................................................................35 Report Tab ..................................................................................34 Report Window ..........................................................................33 Reset ............................................................................................39 Results Panel...............................................................................25 S…………....................................................................................29 Safety Instructions........................................................................1 saturating flashes..................................................................16, 18 54 ALPHABETICAL INDEX saturating pulse ..........................................................................10 Save....................................................................................5, 11, 26 Save Data.....................................................................................25 select data ..............................................................................27, 33 Select Leaf-Clip ..........................................................................44 Sensors online .............................................................................29 Settings ..................................................................................31, 39 Sidebar ........................................................................................28 signal noise ..................................................................................21 Software ......................................................................................46 start screen ....................................................................................6 starting screen...............................................................................6 status LED...................................................................................19 Status Panel.................................................................................25 Store Data....................................................................................30 storing the ULM ...........................................................................3 support ........................................................................................23 Switch Grid .................................................................................26 synchronize with PC...................................................................38 System Parameters .....................................................................40 Technical Specifications.............................................................45 Temp*..........................................................................................28 55 ALPHABETICAL INDEX Temp. Unit ..................................................................................41 Temperature .................................................................................2 Temperature Units .....................................................................25 thermocouple ................................................................................9 Time/Date....................................................................................18 Trigger.........................................................................................18 Triggered Data............................................................................30 ULM triggered............................................................................29 user App.1 ...................................................................................21 User Applications .......................................................................21 Val................................................................................................30 View .............................................................................................25 View Lines...................................................................................26 View Symbols..............................................................................26 W....................................................................................................6 Warnings .....................................................................................25 Warranty Conditions .................................................................47 Weight .........................................................................................45 WinControl-3..........................................................................7, 23 Wm-2 ........................................................................................6, 43 Working conditions ....................................................................45 X 12 56 ALPHABETICAL INDEX Zoom to Selection .......................................................................27 Heinz Walz GmbH Eichenring 6 91090 Effeltrich Germany Tel. +49-(0)9133 / 7765-0 Fax +49-(0)9133 / 5395 E-mail: [email protected] Internet: www.walz.com 57