1
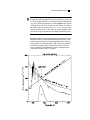
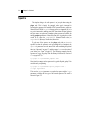
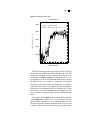
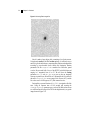
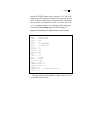
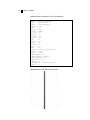
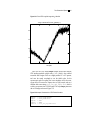
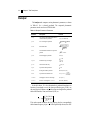
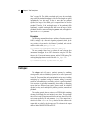
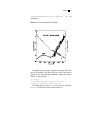
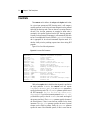
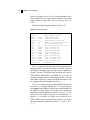
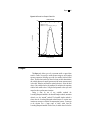
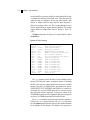
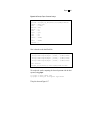
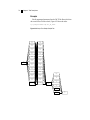
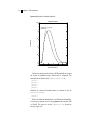
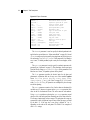
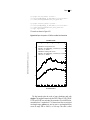
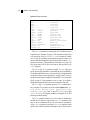
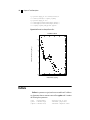
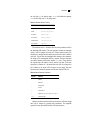
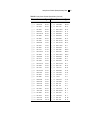
Photometry
29
The results from calcphot are shown in Figure 3.8, where we see that we
can reach an H magnitude of 20.8.
Figure 3.8: Calcphot Results for a NICMOS F160W Observation
Mode = band(h)
Pivot
Equiv Gaussian
Wavelength
FWHM
16448.03
2040.669
band(h)
Spectrum: rn(crgridbpgs$bpgs_147,band(nicmos,2,f160w),10,c
ounts)
VZERO
VEGAMAG
0.
20.79155
The calcphot task is also useful for making photometric measurements
of existing spectra, either in HST instrumental bands or standard
ground-based filter systems. For example, let’s say you’d like to
demonstrate for some students the importance of the 4000 Å break on the
U−B colors of redshifted galaxy spectra. First, you might want to produce a
plot showing the U and B bandpasses relative to some redshifted spectra.
The plspec and plband commands shown in Figure 3.9 will produce the
plot shown in Figure 3.10. Note that the bandpass plots are multiplied by a
scale factor to place them in the same range of data values as the spectra.
Figure 3.9: Commands for Plotting Redshifted Spectra and UB Bands
plspec
plspec
plspec
plspec
plspec
plband
plband
"" "z(crgridkc96$elliptical_template,0.0)"
"" "z(crgridkc96$elliptical_template,0.2)"
"" "z(crgridkc96$elliptical_template,0.4)"
"" "z(crgridkc96$elliptical_template,0.6)"
"" "z(crgridkc96$elliptical_template,0.8)"
"band(u)*3.e-14" app+ ltype=dashed
"band(b)*3.e-14" app+ ltype=dashed
flam
flam
flam
flam
flam
app+
app+
app+
app+