1
SPM 32 User’s Manual
Menu Functions
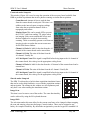
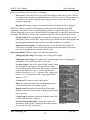
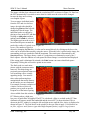
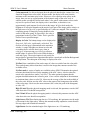
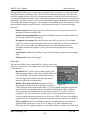
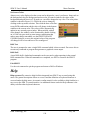
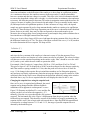
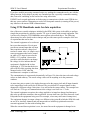
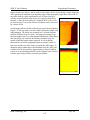
another way to remove the noise at specific spacing is to utilize a notch filter set to a specific x
and y frequency. The advantage to this is if there is noise in the x direction and an important
peak is very close to it, placing a
black circle on the FFT to erase
the power may overlap the
closely spaced peak because of
the circular nature of the
attenuator. Instead, effectively an
ellipse can be used to only reduce
the noise at a specific x or y
frequency and NOT attenuate any
features with a slightly different
spacing. The most useful
example of using this filter is to
eliminate noise along the fast
scan direction without effecting
any features of the same spacing
Figure 57
along the slow scan direction.
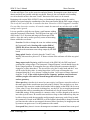
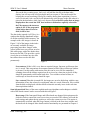
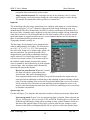
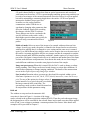
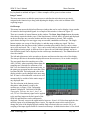
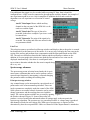
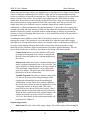
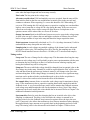
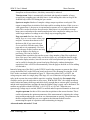
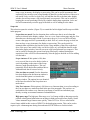
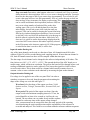
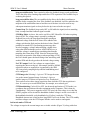
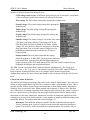
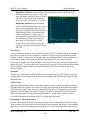
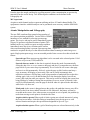
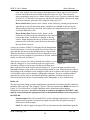
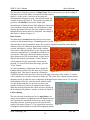
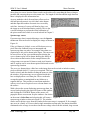
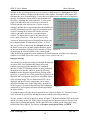
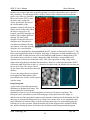
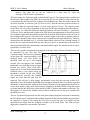
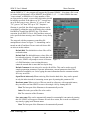
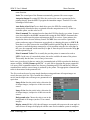
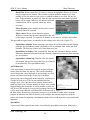
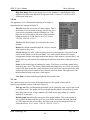
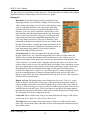
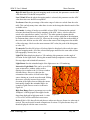
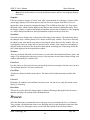
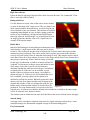
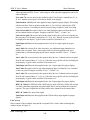
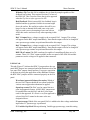
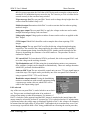
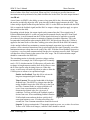
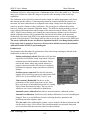
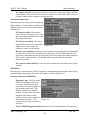
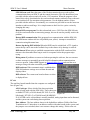
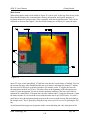
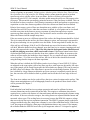
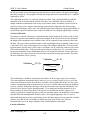
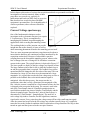
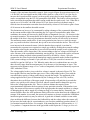
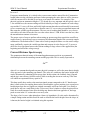
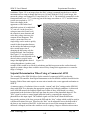
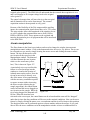
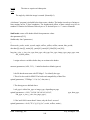
This can be accomplished by choosing notch in the FFT window as illustrated in Figure 57. The
filter can be applied only in the X direction, only in the Y direction or in both simultaneously. To
activate the filter in either direction click no the X off and y off buttons to change them to ON.
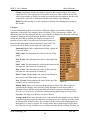
The number below each box is used to change the width of the filter. A large number will
attenuate more of the power around the center. This is the equivalent of using a large circle
radius when using the direct method discussed above. However, in this case the number ONLY
effects the width of the filter in the x or y direction. In other words, the blacked out area does not
have to be a circle. The next two boxes
are the center of the notch filter entered in
distance.
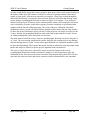
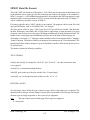
To save any image after processing has
been applied, the Save button can be
pressed and a new window will be opened
with the image
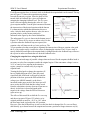
Image histogram
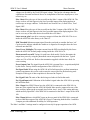
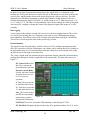
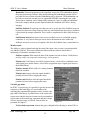
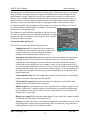
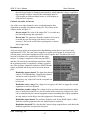
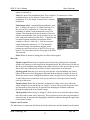
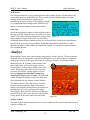
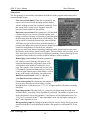
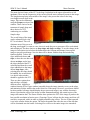
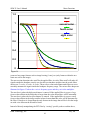
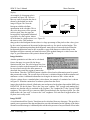
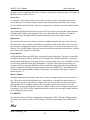
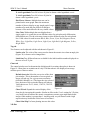
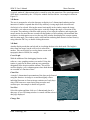
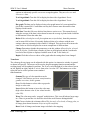
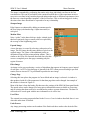
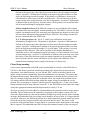
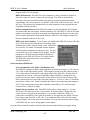
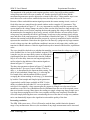
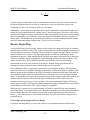
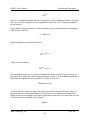
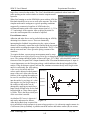
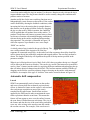
A plot can be created that presents the
distribution of heights in an image. This Figure 58
can be helpful for visualizing the
distribution of terrace sizes or the homogeneity of an array of features in an image. The
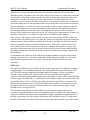
histogram can be calculated over the entire data page or any subsection of the image, so
undesired areas of the image do not unnecessarily introduce artifacts into the histogram plot. The
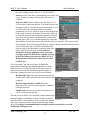
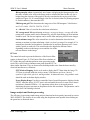
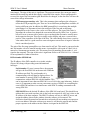
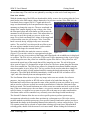
data page to calculate the histogram from is selected via a mouse click. A box around the entire
page is then drawn, but this can be resized by clicking on an edge or a corner and dragging the
selected side to a new location. When the desired area of the image has been outlined with the
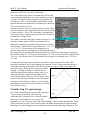
box, double clicking the mouse will lead to the calculation of the histogram and subsequent
RHK Technology, Inc.
Troy, MI
62