1
User’s Guide
Publication number E2448-97008
June 2000
For Safety information, Warranties, and Regulatory information, see the pages
behind the index.
© Copyright Agilent Technologies 1994-2000
All Rights Reserved
Solutions for the Motorola
68360
Solutions for the Motorola 68360—At a Glance
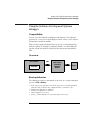
This manual describes several ways to connect an Agilent Technologies
logic analysis system to your target system. These connections use an
analysis probe, plus an emulation module (for an emulation solution).
Analysis Probe
The analysis probe connects your logic analyzer to your target system
for state and timing analysis. The analysis probe can be used with an
Agilent Technologies 16600A/700A-series logic analysis system or with
other Agilent Technologies logic analyzers.
The analysis probe can be purchased alone, or as part of an emulation
solution.
Emulation Module and Target Interface Module
The emulation module plugs into your Agilent Technologies 16600A/
700A-series logic analysis system frame. The emulation module lets
you use the target processor’s built-in background debugging features,
including run control and access to registers and memory. A high-level
source debugger can use the emulation module to debug code running
on the target system. You can connect the emulation module to the
analysis probe or you can connect it to a debug port on the target
system through the provided target interface module (TIM).
2
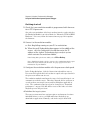
Emulation Solution
The emulation solution includes an analysis probe, an emulation
module, cables and adapters, and the Agilent Technologies B4620B
Source Correlation Tool Set (for analyzing high-level source code).
This solution is designed to be used with an Agilent Technologies
16600A/700A-series logic analysis system.
3
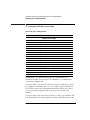
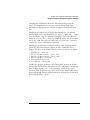
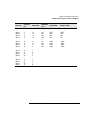
In This Book
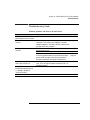
This book documents the following products:
Analysis Probe
Processor supported
Product ordered
Includes
68360/EN/MH
240-pin QFP
Agilent Technologies
E9590A Option #003
Agilent Technologies E2448B analysis
probe and inverse assembler
68360/EN/MH
241-pin PGA
Agilent Technologies
E9590A Option #002
Agilent Technologies E2448B analysis
probe and inverse assembler
Emulation Solution
Processor supported
Product ordered
Includes
68360/EN/MH
240-pin QFP
Agilent Technologies
9490A Option #003
Agilent Technologies E2448B analysis
probe, inverse assembler, Agilent
Technologies 16610A emulation module,
target interface module (TIM), Agilent
Technologies B4620B Source
Correlation Tool Set
68360/EN/MH
241-pin PGA
Agilent Technologies
9490A Option #002
Agilent Technologies E2448B analysis
probe, inverse assembler, Agilent
Technologies 16610A emulation module,
target interface module (TIM), Agilent
Technologies B4620B Source
Correlation Tool Set
4
Contents
1
Overview
Overview
17
18
Setup Checklist
19
Setup Assistant
21
Analysis Probe
22
Equipment supplied 22
Minimum equipment required 24
Additional equipment supported 24
Logic analyzers supported 25
Logic analyzer software version requirements
Emulation Module
27
Equipment supplied 27
Minimum equipment required
Emulation Solution
28
29
Additional Information Sources
2
Installing Software
Installing Software
26
30
31
32
Installing and loading 32
What needs to be installed 33
To install the software from CD-ROM (16600A/700A)
34
To list software packages which are installed (16600A/700A)
To install software on other logic analyzers 35
35
5
Contents
3
Connecting and Configuring the Analysis
Probe 37
Connecting and Configuring the Analysis Probe
Target System Requirements
40
Analysis probe—circuit board dimensions
Power-on/Power-off Sequence
38
41
42
To power on 16600A and 16700A-series logic analysis systems
To power on all other logic analyzers 42
To power off 43
To connect to a PGA target system
45
To connect to a QFP target system
47
To connect the analysis probe to the probe adapter
42
49
Connecting the Analysis Probe to the Logic Analyzer
50
To connect the high-density termination cables to the analysis probe
Connecting the high-density cables to the logic analyzer 52
To connect to the 16600A logic analyzer 53
To connect to the 16601A logic analyzer 54
To connect to the 16602A logic analyzer 56
To connect to the 16550A analyzer 58
To connect to the two-card 16554/55/56/57 analyzers 60
To connect to the three-card 16554/55/56/57 analyzers 62
To connect to the 1660A/AS/C/CS/CP logic analyzers 65
To connect to the 1661A/AS/C/CS/CP logic analyzers 66
To connect to the 1670A/D logic analyzer 68
To connect to the 1671A/D logic analyzer 69
Configuring the Analysis Probe
71
Configuring the analysis probe for address reconstruction
6
72
51
Contents
To configure with a debugger 73
To configure with a logic analysis system
68360 clock configuration
73
75
Configuring the Logic Analysis System
77
To load configuration and inverse assembler files—16600/700 logic analysis
systems 78
To load configuration files—other logic analyzers 79
4
Analyzing the 68360 with a Logic Analyzer
Analyzing the 68360 with a Logic Analyzer
Modes of Operation
83
84
85
State-per-ack mode 85
State-per-clock mode 85
Timing mode 86
Logic Analyzer Configuration
Trigger specification
Format menu
87
Trigger menu 92
87
87
Using the Inverse Assembler
95
To display captured state data 95
To align the inverse assembler 98
Inverse assembler output format 100
To use the Invasm menu
103
7
Contents
5
Symbols and Source Code in the Analyzer
Symbols and Source Code in the Analyzer
User-Defined Symbols
107
108
Requirements 108
To use object file symbols in the 16600A/700A
Compilers 110
Source Code
106
107
Predefined CPU32+ Symbols
Object File Symbols
109
114
Inverse Assembler Generated PC (Software Address) Label
Access to Source Code Files
117
Triggering on Symbols and Source Code
116
118
To avoid triggering on prefetched instructions 118
To correlate relocatable code using the address offset
6
105
119
Connecting and Configuring the Emulation
Module 121
Connecting and Configuring the Emulation Module
Using the Emulation Control Interface
122
123
To start the Emulation Control Interface from the main System window 125
To start the Emulation Control Interface from the Workspace window 125
To start the Emulation Control Interface from the Workspace window for an
emulation probe 127
Designing a Target System for the Emulation Module
8
128
Contents
Debug port connections
8-pin BDM port 130
10-pin BDM port 130
Target VDD 130
CONFIG2 pin 131
Enabling BDM 131
128
Installing the Emulation Module
132
To install the emulation module in a 16700A-series logic analysis system or a
16701A expansion frame 133
To install the emulation module in a 16600A-series logic analysis system 135
To test the emulation module 136
Connecting the Emulation Module to the Target System
137
To connect to a target system using a 10-pin debug port 138
To connect to a target system via an 8-pin debug port
139
To connect to a target system using an analysis probe
141
To update firmware
142
To display current firmware version information
143
To verify communication between the emulator and target system
Configuring the Emulation Module
143
144
What can be configured 144
To configure using the Emulation Control Interface 145
To configure using the built-in commands 146
To configure using a debugger 147
To configure the processor type 148
To configure the processor clock speed (BDM communication speed) 149
To set the default clock rate if the processor clock rate is less than 8 MHz 150
Detailed information about processor clock rates 152
To configure restriction to real-time runs 154
Testing the emulator and target system
To test memory accesses 155
To test with a running program
155
155
9
Contents
7
Using Internal Registers (SIM and EMSIM
Registers) 157
Internal Registers (SIM and EMSIM Registers)
158
The purpose of SIM Registers 158
The purpose of EMSIM registers 158
Configuring the SIM Registers
159
Summary 159
How SIM Register Values are Set 159
The effect of processor type on the EMSIM registers 160
Using the Emulation Control Interface or built-in commands
Configuring EMSIM Register Values
161
To copy target SIM registers to EMSIM registers
To manually define EMSIM values 161
Configuring SIM Register Values
161
163
To copy EMSIM registers to target SIM registers
To manually define SIM values 164
Saving and Loading EMSIM Values
160
163
165
To save EMSIM values in a configuration file 165
To load EMSIM values from a configuration file 165
Configuring SIM and EMSIM Values Using Built-In Commands
To compare SIM and EMSIM registers 167
Summary of EMSIM-related built-in commands
8
168
Internal Representation of SIM and EMSIM Registers
169
Using the Emulator with a Debugger
171
10
167
Contents
Using the Emulator with a Debugger
Setting up Debugger Software
172
175
To connect the logic analysis system to the LAN 176
To change the port number of an emulator 178
To verify communication with the emulator 179
To export the logic analysis system’s display to a workstation
To export the logic analysis system’s display to a PC 181
Using the Green Hills debugger
180
182
Compatibility 182
Overview 182
Getting started 182
To configure the emulation module, analysis probe, and target using an initialization script 186
To perform common debugger tasks 188
To send commands to the emulation module 188
To view commands sent by MULTI to the emulation module 188
To reinitialize the system 189
To disconnect from the emulation module 189
Error conditions 189
Using the Software Development Systems debugger
Compatibility 191
Overview 191
Startup behavior 191
Getting started 192
To send commands to the emulation module
Download performance 199
Error conditions 200
9
191
198
Using the Analysis Probe and Emulation Module
Together 201
11
Contents
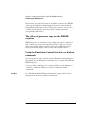
Using the Analysis Probe and Emulation Module Together
What are some of the tools I can use? 202
Which assembly-level listing should I use? 202
Which source-level listing should I use? 203
Where can I find practical examples of measurements?
Triggering the Emulation Module from the Analyzer
202
203
204
To stop the processor when the logic analyzer triggers on a line of source code
(Source Viewer window) 204
To stop the processor when the logic analyzer triggers (Intermodule
window) 205
To minimize the “skid” effect 206
To stop the analyzer and view a measurement 206
Tracing until the processor halts
208
To capture a trace before the processor halts
10
208
Triggering the Logic Analyzer from the Emulation Module
209
The emulation module trigger signal 209
Group Run 210
To trigger the analyzer when the processor halts 212
To trigger the analyzer when the processor reaches a breakpoint
213
Hardware Reference
Hardware Reference
215
216
Analysis probe—operating characteristics
Signal line loading 219
Theory of operation and clocking
220
Analysis probe signal-to-connector mapping
12
217
222
Contents
11
Emulation module—operating characteristics
234
Emulation module—electrical characteristics
235
General-Purpose ASCII (GPA) Symbol File
Format 237
General-Purpose ASCII (GPA) Symbol File Format
GPA Record Format Summary
SECTIONS 242
FUNCTIONS 243
VARIABLES 244
SOURCE LINES 245
START ADDRESS 246
Comments 246
12
Troubleshooting the Analysis Probe
Troubleshooting the Analysis Probe
Logic Analyzer Problems
247
248
249
Intermittent data errors 249
Unwanted triggers 250
No activity on activity indicators
No trace list display
250
Analyzer won’t power up 251
Analysis Probe Problems
238
240
250
252
Target system will not boot up
252
Erratic trace measurements 253
13
Contents
Capacitive loading
253
Inverse Assembler Problems
254
No inverse assembly or incorrect inverse assembly
Inverse assembler will not load or run 255
Intermodule Measurement Problems
256
An event wasn’t captured by one of the modules
Analysis Probe Messages
254
256
257
“. . . Inverse Assembler Not Found” 257
“Measurement Initialization Error” 258
“No Configuration File Loaded” 259
“Selected File is Incompatible” 260
“Slow or Missing Clock”
260
“Time from Arm Greater Than 41.93 ms” 260
“Waiting for Trigger” 261
Returning Parts to Agilent Technologies for Service
To return a part to Agilent Technologies
To obtain replacement parts 263
Cleaning the Instrument
13
262
262
264
Troubleshooting the Emulation Module
Solving Problems
266
Troubleshooting Guide
267
Emulation Module Status Lights
268
Emulation Module Built-in Commands
To telnet to the emulation module
14
269
269
265
Contents
To use the built-in commands
270
Problems with the BDM Connection
If a user interface behaves erratically
Problems with Configuration
272
272
273
If you have problems displaying some registers
If you have problems initializing some registers
Problems with the Target System
If boot area accesses fail
273
273
274
274
Problems with the LAN Interface
275
If LAN communication does not work 275
If it takes a long time to connect to the network
Problems with the Emulation Module
275
276
To run the built-in performance verification test using the logic analysis
system 276
To run complete performance verification tests using a telnet
connection 277
If a performance verification test fails 279
Returning Parts to Agilent Technologies for Service
280
To return a part to Agilent Technologies 280
To obtain replacement parts and cables 281
To clean the instrument 282
Glossary
283
15
Contents
16
1
Overview
17
Overview
This chapter describes:
•
Setup Checklist
•
Setup Assistant
•
Equipment used with the analysis probe (including a list of logic analyzers
supported)
•
Equipment used with the emulation module
•
System configurations
•
Additional information sources
18
Solutions for the Motorola 68360
Chapter 1: Overview
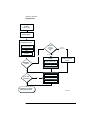
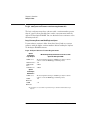
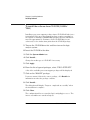
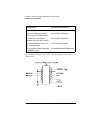
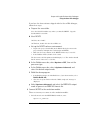
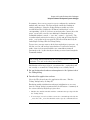
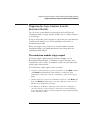
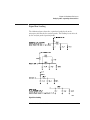
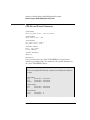
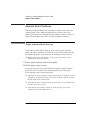
Setup Checklist
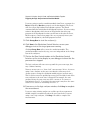
Setup Checklist
Follow these steps to connect your equipment:
•
Check that you received all of the necessary equipment. See page 22
(analysis probe) or page 27 (emulation module).
•
If you need to install an emulation module in an Agilent Technologies
16600A/700A series logic analysis system, see page 132.
•
Install the software. See page 31.
•
If you have an Agilent Technologies 16600A/700A-series logic analysis
system, use the Setup Assistant to help you connect and configure the
analysis probe and emulation module. See page 21.
•
If you do not have an Agilent Technologies 16600A/700A-series logic
analysis system, install the analysis probe (see page 37).
Solutions for the Motorola 68360
19
Chapter 1: Overview
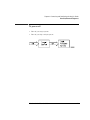
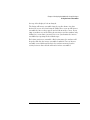
Setup Checklist
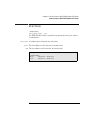
Install emulation
module
(if necessary)
Install software
Install analysis probe
Connect analysis
probe to target system
Emulation
module
connection
type?
Connect analyzer
cables
Through
Analysis Probe
Load inverse
assembler
Yes
Direct to Target
Connect emulation
module
Connect emulation module
to target interface module
Emulation
solution?
Connect emulation
module to analysis
probe
Connect target interface
module to target
No
Create executable with
symbol information
Use source
correlation?
Yes
Download executable to
target
Load program symbols
into analyzer
No
Installation done. Begin
making measurements.
E2476F02.VSD
20
Solutions for the Motorola 68360
Chapter 1: Overview
Setup Assistant
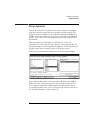
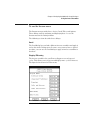
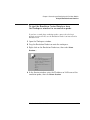
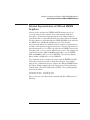
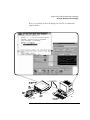
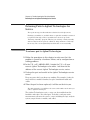
Setup Assistant
The Setup Assistant is an online tool for connecting and configuring
your logic analysis system for microcontroller and bus analysis. The
Setup Assistant is available on the Agilent Technologies 16600A and
16700A-series logic analysis systems. You can use the Setup Assistant
in place of the connection and configuration procedures provided in
this manual.
This menu-driven tool will guide you through the connection
procedures for connecting the logic analyzer to an analysis probe, an
emulation module, or other supported equipment. It will also guide you
through connecting an analysis probe to the target system.
Start the Setup Assistant by clicking its icon in the system window.
If you ordered this product with your Agilent Technologies 16600A/
700A-series logic analysis system, the logic analysis system has the
latest software installed, including support for this product. If you
received this product after you received your logic analysis system, see
the “Installing Software” chapter (page 31).
Solutions for the Motorola 68360
21
Chapter 1: Overview
Analysis Probe
Analysis Probe
This section lists equipment supplied with the analysis probe and
equipment requirements for using the analysis probe.
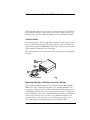
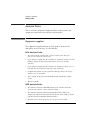
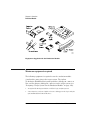
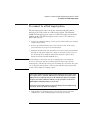
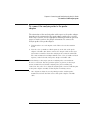
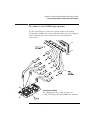
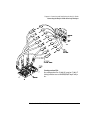
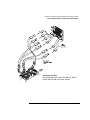
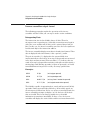
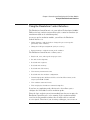
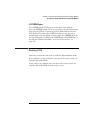
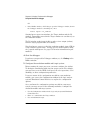
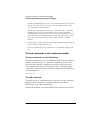
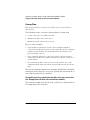
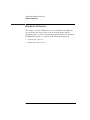
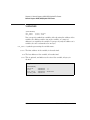
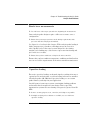
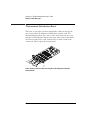
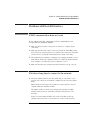
Equipment supplied
The equipment supplied with the analysis probe is shown in the
illustration on the next page. It is listed below:
PGA Analysis Probe
•
The analysis probe circuit board. A male-to-male header and a pin
protector are attached at the factory.
•
Logic analyzer configuration files and inverse assembler software on a CDROM (for Agilent Technologies 16600A/700A series logic analysis
systems).
•
Logic analyzer configuration files and inverse assembler software on a 3.5inch disk (for other Agilent Technologies logic analyzers).
•
Configuration software for the Agilent Technologies 16505A Prototype
Analyzer on a 3.5-inch disk.
•
Three Agilent Technologies E5346A high density termination adapter
cables.
•
This User's Guide.
QFP Analysis Probe
•
The Agilent Technologies E2448B analysis probe, which includes the
circuit board, software, cables, and User's Guide.
•
The Agilent Technologies E5363A 240-pin Elastomeric QFP Probe
Adapter, the Agilent Technologies E5372A Generic Flex Adapter, and the
Agilent Technologies E8124A Transition Board.
•
The Elastomeric Probing System for 240-pin 0.50 mm QFP
22
Solutions for the Motorola 68360
Chapter 1: Overview
Analysis Probe
Installation Guide.
Equipment Supplied with the Agilent Technologies E2448B Analysis Probe
Solutions for the Motorola 68360
23
Chapter 1: Overview
Analysis Probe
Minimum equipment required
For state and timing analysis of a Motorola 68360 target system, you
need all of the following items.
•
The PGA Analysis Probe, for 241-pin PGA target systems.
•
The QFP Analysis Probe, for 240-pin QFP target systems.
•
Three Agilent Technologies E5346A high-density cables.
•
One of the logic analyzers listed on page page 25. The logic analyzer
software version requirements are listed on page 26.
The above is the minimum equipment required to make a measurement. If
the upper bits of the addresses are used as write enables and you want
to configure the analysis probe to reconstruct these addresses, you need
access to an Emulation Module for a one-time configuration of the
Agilent Technologies E2448B.
The Agilent Technologies E2448B contains 12 16-channel pods. Six of the
pods are required for inverse assembly with state analysis, and the other
six pods contain additional signals which may be useful for state or timing
analysis. If you want to monitor signals on the optional pods, you will need
one additional high density termination adapter cable for every two pods
you want to monitor.
Additional equipment supported
Emulation module. The Agilent Technologies E2448B has a built-in
connector for an emulation module.
Agilent Technologies B4620B Source Correlation Tool Set. The
analysis probe and inverse assembler may be used with the Agilent
Technologies B4620B Source Correlation Tool Set.
24
Solutions for the Motorola 68360
Chapter 1: Overview
Analysis Probe
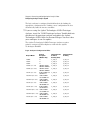
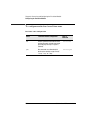
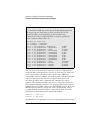
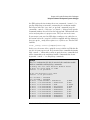
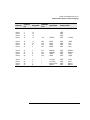
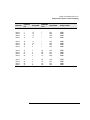
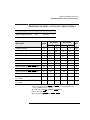
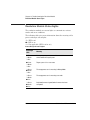
Logic analyzers supported
The table below lists the logic analyzers supported by the Agilent
Technologies E2448B analysis probe. Logic analyzer software version
requirements are shown on the following page.
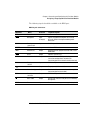
The Agilent Technologies E2448B requires six logic analyzer pods (102
channels) for inverse assembly. The analysis probe contains six highdensity connectors (12 logic analyzer pods). The extra connectors
have additional signals you might want to monitor.
Logic Analyzers Supported
Logic Analyzer
16600A
16601A
16602A
16550A (one or two cards)
16554A (two or three cards)
16555A (two or three cards)
16555D (two or three cards)
16556A (two or three cards)
16556D (two or three cards)
16557D (one or two cards)
1660A/AS/C/CS/CP
1661A/AS/C/CS/CP
1670A
1670D
1671A
1671D
Channel
Count
204
136
102
102/card
68/card
68/card
68/card
68/card
68/card
68/card
136
102
136
136
102
102
State Speed
Timing Speed
100 MHz
100 MHz
100 MHz
100 MHz
70 MHz
110 MHz
110 MHz
100 MHz
100 MHz
135 MHz*
100 MHz
100 MHz
70 MHz
100 MHz
70 MHz
100 MHz
125 MHz
125 MHz
125 MHz
250 MHz
125 MHz
250 MHz
250 MHz
200 MHz
200 MHz
250 MHz
250 MHz
250 MHz
125 MHz
125 MHz
125 MHz
125 MHz
Memory Depth
64 k states
64 k states
64 k states
4 k states
512 k states
1 M states
2 M states
1 M states
2 M states
2 M states
4 k states
4 k states
64 k or .5 M states
64 k or 1 M states
64 k or .5 M
64 k or 1 M
*For the 16557D, the state and timing speeds decrease for four- or five-card configurations.
Solutions for the Motorola 68360
25
Chapter 1: Overview
Analysis Probe
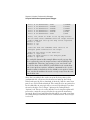
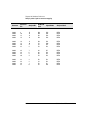
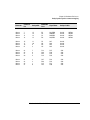
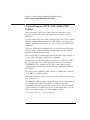
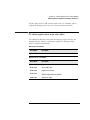
Logic analyzer software version requirements
The logic analyzers must have software with a version number greater
than or equal to those listed below to make a measurement with the
Agilent Technologies E2448B. You can obtain the latest software at the
following web site:
http://www.agilent.com/find/logicanalyzer
If your software version is older than those listed, load new system
software with the higher version numbers before loading the Agilent
Technologies E2448B software.
Logic Analyzer Software Version Requirements
Agilent
Technologies
Logic Analyzer
16600A-series
1660A/AS Series
1660C/CS/CP
Series
1670A/D Series
Minimum Logic Analyzer Software Version for use with
Agilent Technologies E2448B
The latest Agilent Technologies 16600A logic analyzer software
version is on the CD-ROM shipped with this product.
3.01
A.02.01
A.02.02
Agilent
Technologies
Mainframes*
16700A-series
16500C
Mainframe
16500B
Mainframe
The latest Agilent Technologies 16700A logic analyzer software
version is on the CD-ROM shipped with this product.
1.07
3.14
* The mainframes are used with the Agilent Technologies 16550 and 16554/55/56/57 logic
analyzers.
26
Solutions for the Motorola 68360
Chapter 1: Overview
Emulation Module
Emulation Module
This section lists equipment supplied with the emulation module and
lists the minimum equipment required to use the emulation module.
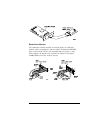
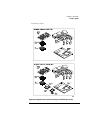
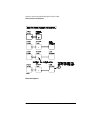
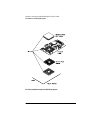
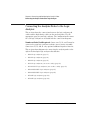
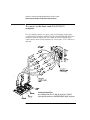
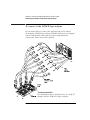
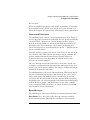
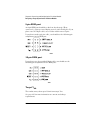
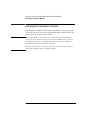
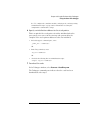
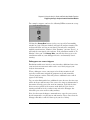
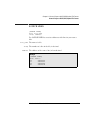
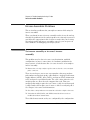
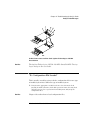
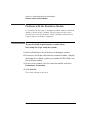
Equipment supplied
The equipment supplied with your emulation module includes:
•
An Agilent Technologies 16610A emulation module. If you ordered an
emulation module as part of your Agilent Technologies 16600A or 16700A
logic analysis system, it is already installed in the frame.
•
A target interface module (TIM) circuit board.
•
An emulation module loopback test board (Agilent part number E349666502).
•
Firmware for the emulation module and/or updated software for the
Emulation Control Interface on a CD-ROM.
•
A 50-pin ribbon cable for connecting the emulation module to the target
interface module or the Agilent Technologies E2448B analysis probe.
•
A 10-pin ribbon cable for connecting the target interface module to the
target system.
•
Torx T-8, T-10 and T-15 screwdrivers.
•
This User’s Guide.
Solutions for the Motorola 68360
27
Chapter 1: Overview
Emulation Module
Equipment Supplied with the Emulation Module
Minimum equipment required
The following equipment is required to use the emulation module:
A method for connecting to the target system. The Agilent
Technologies E2448B analysis probe provides a debug port connector.
You can also design a debug port connector on the target system (see
“Designing a Target System for the Emulation Module” on page 128).
•
An Agilent Technologies 16600A or 16700A logic analysis system.
•
A user interface, such as a high-level source debugger or the logic analysis
system’s Emulation Control Interface.
28
Solutions for the Motorola 68360
Chapter 1: Overview
Emulation Solution
Emulation Solution
An emulation solution uses the equipment and software already
described in this chapter.
The combination of an analysis probe, an emulation module, and an
Agilent Technologies 16600A or 16700A logic analysis system lets you
both trace and control microcontroller activity on the target system.
The analysis probe supplies signals from the target microcontroller to
the logic analyzer. A configuration file sets up the logic analyzer to
properly interpret these signals.
You can use a debugger or the logic analysis system’s Emulation
Control Interface to configure and control the target processor and to
download program code. You can use the Agilent Technologies B4620B
Source Correlation Tool Set to analyze high-level source code using the
logic analysis system.
Solutions for the Motorola 68360
29
Chapter 1: Overview
Additional Information Sources
Additional Information Sources
Additional or updated information can be found in the following places:
Newer editions of this manual may be available. Contact your local
Agilent Technologies representative.
If you have a probing adapter, the instructions for connecting the probe
to your target microcontroller are in the Probing Adapter
documentation.
Application notes may be available from your local Agilent
Technologies representative or on the World Wide Web at:
http://www.agilent.com/find/logicanalyzer
If you have an Agilent Technologies 16600A or 16700A logic analysis
system, the online help for the Emulation Control Interface has
additional information on using the emulation module.
The measurement examples include valuable tips for making
emulation and analysis measurements. You can find the measurement
examples under the system help in your Agilent Technologies 16600A/
700A logic analysis system.
30
Solutions for the Motorola 68360
2
Installing Software
31
Installing Software
This chapter explains how to install the software you will need for your
analysis probe or emulation solution.
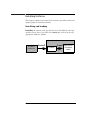
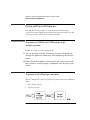
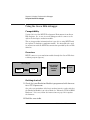
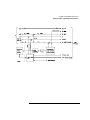
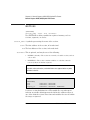
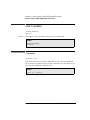
Installing and loading
Installing the software will copy the files to the hard disk of your logic
analysis system. Later, you will need to load some of the files into the
appropriate hardware module.
Logic analysis system or logic analyzer frame
CD-ROM or
flexible disk
32
Install
Load
Hard Disk
Logic analyzer
or emulation
module
Solutions for the Motorola 68360
Chapter 2: Installing Software
Installing Software
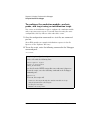
What needs to be installed
Agilent Technologies 16600A/700A-series logic analysis
systems
If you ordered an emulation solution with your logic analysis system,
the software was installed at the factory.
The following files are installed when you install a processor support
package from the CD-ROM:
•
Logic analysis system configuration files
•
Inverse assembler (automatically loaded with the configuration files)
•
Personality files for the Setup Assistant
•
Emulation module firmware (for emulation solutions)
•
Emulation Control Interface (for emulation solutions)
The Agilent Technologies B4620B Source Correlation Tool Set is
installed with the logic analysis system’s operating system.
Other Agilent Technologies logic analyzers
The following files can be installed from a floppy disk:
•
Logic analyzer configuration files, which automatically load the inverse
assembler
Solutions for the Motorola 68360
33
Chapter 2: Installing Software
Installing Software
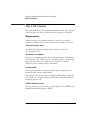
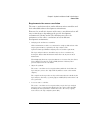
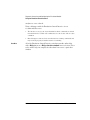
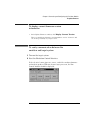
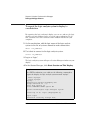
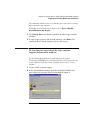
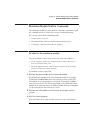
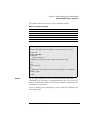
To install the software from CD-ROM (16600A/
700A)
Installing a processor support package from a CD-ROM will take just a
few minutes. If the processor support package requires an update to
the Agilent Technologies 16600A/700A operating system, installation
may take approximately 15 minutes. If the CD-ROM drive is not
connected, see the instructions printed on the CD-ROM package.
1 Turn on the CD-ROM drive first and then turn on the logic
analysis system.
2 Insert the CD-ROM in the drive.
3 Click the System Admin icon.
4 Click Install... .
Change the media type to “CD-ROM” if necessary.
5 Click Apply.
6 From the list of types of packages, select “PROC-SUPPORT.”
A list of the available processor support packages will be displayed.
7 Click on the “M683XX” package.
If you are unsure if this is the correct package, click Details for
information on what the package contains.
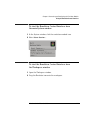
8 Click Install... .
The dialog box will display “Progress: completed successfully” when
the installation is complete.
9 Click Close.
The configuration files are stored in /logic/configs/hp/processor. The
inverse assemblers are stored in /logic/ia.
34
Solutions for the Motorola 68360
Chapter 2: Installing Software
Installing Software
See Also
The instructions printed on the CD-ROM package for a summary of the
installation instructions.
The online help for more information on installing, licensing, and
removing software.
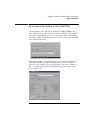
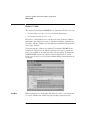
To list software packages which are installed
(16600A/700A)
In the System Administration Tools window, click List... .
To install software on other logic analyzers
Consult the documentation for your logic analyzer for details.
Solutions for the Motorola 68360
35
36
Solutions for the Motorola 68360
3
Connecting and Configuring the
Analysis Probe
37
Connecting and Configuring the Analysis Probe
This chapter shows you how to connect the logic analyzer to the target
system through the analysis probe.
If you are connecting to an Agilent Technologies 16600A-series or
16700A-series logic analyzer, use the Setup Assistant to connect and
configure your system (see page 21). Use this manual for additional
information, if desired.
If you are not using the Setup Assistant, follow the instructions given in
this chapter.
Note that there are separate instructions for the PGA and QFP
packages. For QFP packages, the instructions in this manual are
only an overview. Use the documentation included with your probe
adapter for detailed QFP connection procedures.
This chapter covers the following tasks; the order shown here is the
recommended order for performing these tasks:
•
Check that the target system meets the necessary requirements
•
Read the power on/power off sequence (page 42)
•
Connect the analysis probe to the target system
•
•
For PGA target systems, connect the analysis probe to the target
system
For QFP target systems, use the QFP Installation guide to connect the
QFP probe to the target system, then connect the analysis probe to the
QFP probe
•
If you stack several PGA sockets, or use the QFP adapter, you may have to
duplicate the 68360 clocking circuitry on the analysis probe (page 75)
•
Connect the analysis probe to the logic analyzer
38
Solutions for the Motorola 68360
Chapter 3: Connecting and Configuring the Analysis Probe
Connecting and Configuring the Analysis Probe
•
Configure the logic analyzer
Protect Your Equipment
The analysis probe socket assembly pins are covered for shipment
with a conductive foam wafer or conductive plastic pin protector.
This is done to protect the delicate gold-plated pins from damage
due to impact. When you’re not using the analysis probe, protect
the socket assembly pins from damage by covering them with the
pin protector.
Solutions for the Motorola 68360
39
Chapter 3: Connecting and Configuring the Analysis Probe
Target System Requirements
Target System Requirements
The keep-out area and clearance requirements are described below.
Keep-out area on the target board
The QFP probe adapter requires a keep-out area around the target
system microprocessor. Refer to the documentation included with your
probe adapter for keep-out area and dimensions.
Clearance above the target board
See the diagram on the next page for the dimensions of the analysis
probe. You must also allow space for the cables which plug into the top
of the analysis probe.
See Also
The data sheet for your analysis probe, available from your Agilent
Technologies representative, has more detailed information and
diagrams regarding the keep-out area and analysis probe dimensions.
40
Solutions for the Motorola 68360
Chapter 3: Connecting and Configuring the Analysis Probe
Target System Requirements
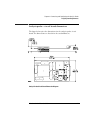
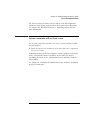
Analysis probe—circuit board dimensions
The figure below gives the dimensions for the analysis probe circuit
board. The dimensions are listed in inches and millimeters.
Analysis Probe Circuit Board Dimension Diagram
Solutions for the Motorola 68360
41
Chapter 3: Connecting and Configuring the Analysis Probe
Power-on/Power-off Sequence
Power-on/Power-off Sequence
Listed below are the sequences for powering on and off a fully
connected system. Simply stated, your target system is always the last
to be powered on, and the first to be powered off.
To power on 16600A and 16700A-series logic
analysis systems
Ensure the target system is powered off.
1 Turn on the logic analyzer. The Setup Assistant will guide you
through the process of connecting and configuring the analysis
probe.
2 When the analysis probe is connected to the target system and
logic analyzer, and everything is configured, turn on your target
system.
To power on all other logic analyzers
With all components connected, power on your system in the following
order:
•
Logic analysis system.
•
Your target system.
42
Solutions for the Motorola 68360
Chapter 3: Connecting and Configuring the Analysis Probe
Power-on/Power-off Sequence
To power off
•
Turn off your target system.
•
Turn off your logic analysis system.
Solutions for the Motorola 68360
43
Chapter 3: Connecting and Configuring the Analysis Probe
Power-on/Power-off Sequence
Connection Sequence
44
Solutions for the Motorola 68360
Chapter 3: Connecting and Configuring the Analysis Probe
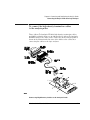
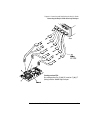
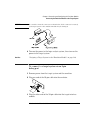
To connect to a PGA target system
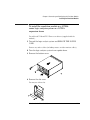
To connect to a PGA target system
The microprocessor connector on the analysis probe will connect
directly to the PGA socket on a PGA target system. The Motorola
68360 PGA microprocessor connects to the PGA socket on top of the
analysis probe. For QFP microprocessors, refer to "To connect to a
QFP target system."
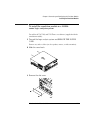
1. To prevent equipment damage, remove power from both the logic analyzer
and the target system.
2. Remove the 68360 PGA microprocessor from its socket on the target
system and store it in a protected environment.
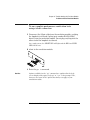
3. Install the analysis probe into the PGA socket on the target system. Ensure
that pin A1 is properly aligned (see figure on next page). The socket on
the analysis probe is designed with low-insertion-force pins to allow
insertion and removal with minimum force.
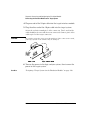
CAUTION:
Serious damage to the target system or analysis probe can result from
incorrect connection. Note the position of pin A1 on the target system,
analysis probe, and microprocessor prior to making any connection. Also, take
care to align the analysis probe connector pins with the target system PGA
socket so that all pins are making contact.
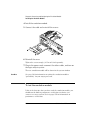
If the analysis probe connector interferes with components of the target system
or if a higher profile is required, additional plastic pin protector sockets can be
added. Plastic pin protector sockets can be ordered from Agilent Technologies
using the part number 1200-1828. However, any 241-pin PGA IC socket with a
68360 footprint and gold-plated pins can be used.
If you stack several PGA sockets you may have to duplicate the 68360 clocking
circuitry on the analysis probe. (See page 75.)
4. Plug the Motorola 68360 microprocessor into the PGA socket on the
analysis probe, again ensuring that pin A1 is properly aligned.
Solutions for the Motorola 68360
45
Chapter 3: Connecting and Configuring the Analysis Probe
To connect to a PGA target system
Pin A1 Location/Connecting to the PGA Target System
46
Solutions for the Motorola 68360
Chapter 3: Connecting and Configuring the Analysis Probe
To connect to a QFP target system
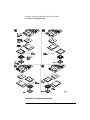
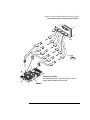
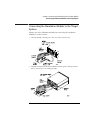
To connect to a QFP target system
Refer to the Elastomeric Probing System for 240-pin 0.50 mm QFP
Installation Guide for details on attaching the QFP probe adapter to
your target system. The information provided here is intended as an
overview; however, the orientations shown in the illustration on the
following page are specific to the Agilent Technologies E2448B.
The QFP probe adapter assembly allows the analysis probe to be
connected to the target system without removing the microprocessor
from the target system.
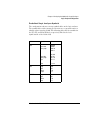
The illustration on the following page shows the allowable rotations for
the QFP probe adapter when used with the Agilent Technologies
E2448B. Note that the orientation (rotation) of the analysis probe,
transition board, and flexible cable, with respect to the probe adapter
depends on the orientation (rotation) of the probe adapter with
respect to the target system. To ensure that you do not have
mechanical interference between the analysis probe and the target
system, use the rotation diagram on the following page, and the
instructions in "Connecting the analysis probe to the probe adapter," to
determine the desired orientation before you connect the probe
adapter to the target system.
CAUTION:
Serious damage to the target system or analysis probe can result from
incorrect connection. Note the position of pin 1 (or pin A1) on the target
system, transition board, and the analysis probe prior to making any
connection. Also, take care to align the analysis probe connector with the pins
on the probe adapter assembly so that all pins are making contact.
CAUTION:
To prevent equipment damage, remove power from all system components
before making attachments.
If you use the QFP adapter, you may have to duplicate the 68360 clocking
circuitry on the analysis probe. (See page 75.)
Solutions for the Motorola 68360
47
Chapter 3: Connecting and Configuring the Analysis Probe
To connect to a QFP target system
240-pin QFP Probe Adapter Rotation Diagram
48
Solutions for the Motorola 68360
Chapter 3: Connecting and Configuring the Analysis Probe
To connect to a QFP target system
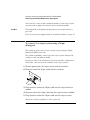
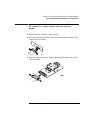
To connect the analysis probe to the probe
adapter
The orientation of the analysis probe with respect to the probe adapter
depends on the orientation of the probe adapter with respect to pin 1
of the target system. Use the appropriate illustration from the previous
pages to ensure you have the proper orientation. To connect the
analysis probe to the probe adapter:
1. Verify that there are no bent pins on the PGA socket of the transition
board.
2. Note the color (or number of black squares) on the side of the probe
adapter or flexible cable that is connected to the pin 1 side of the target
system microcontroller. Orient the analysis probe so that the solid white
side of the transition board aligns with the same color (or number of black
squares) on the PGA end of the probe adapter or flexible cable.
CAUTION:
Serious damage to the target system or analysis probe can result from
incorrect connection. Note the position of pin 1 (or pin A1) on the target
system, transition board, and the analysis probe prior to making any
connection. Also, take care to align the analysis probe connector with the pins
on the probe adapter assembly so that all pins are making contact.
3. Once all pins are aligned correctly, firmly press the analysis probe/
transition board onto the PGA socket of the probe adapter or flexible
cable.
Solutions for the Motorola 68360
49
Chapter 3: Connecting and Configuring the Analysis Probe
Connecting the Analysis Probe to the Logic Analyzer
Connecting the Analysis Probe to the Logic
Analyzer
This section shows the connections between the logic analyzer pod
cables and the high-density cables on the analysis probe. Use the
appropriate page for your logic analyzer. The configuration file names
for each logic analyzer are included with the connection diagrams.
Number of Pods Used/Required. Connectors J1, J2, and J3 must be
connected to your logic analyzer to obtain correct inverse assembly.
Connectors J4, J5, and J6 carry optional additional signals of interest.
This section shows diagrams for connecting the analysis probe to the
Agilent Technologies logic analyzers listed below:
•
16600A logic analyzers (page 53)
•
16601A logic analyzers (page 54)
•
16602A logic analyzers (page 56)
•
16550A logic analyzers (one or two cards) (page 58)
•
16554/55/56/57 logic analyzers (two or three cards) (page 60)
•
1660A/AS/C/CS/CP logic analyzers (page 65)
•
1661A/AS/C/CS/CP logic analyzers (page 66)
•
1670A/D logic analyzers (page 68)
•
1671A/D logic analyzers (page 69)
50
Solutions for the Motorola 68360
Chapter 3: Connecting and Configuring the Analysis Probe
Connecting the Analysis Probe to the Logic Analyzer
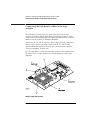
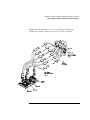
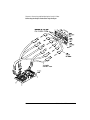
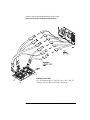
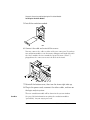
To connect the high-density termination cables
to the analysis probe
Three Agilent Technologies E5346A high-density termination cables,
and labels to identify them, are included with the Agilent Technologies
E2448B. Connect the cables to the connectors on the analysis probe as
shown in the illustration below. Attach the labels to the cables after
connecting the cables to the logic analyzer.
Connecting High-Density Cables to the Analysis Probe
Solutions for the Motorola 68360
51
Chapter 3: Connecting and Configuring the Analysis Probe
Connecting the Analysis Probe to the Logic Analyzer
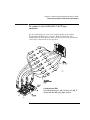
Connecting the high-density cables to the logic
analyzer
The following sections show the connections between the logic
analyzer pod cables and the high density termination adapter cables
connected to the analysis probe. The figure below shows the connector
numbers for the Agilent Technologies E2448B.
Connectors J1, J2, and J3 must be connected to your logic analyzer to
obtain correct inverse assembly. Connectors J4, J5, and J6 carry
optional additional signals of interest. See “Analysis probe signal-toconnector mapping” on page 222.
Use the appropriate section for your logic analyzer. The configuration
file names for each logic analyzer are included with the connection
diagrams.
Analysis Probe Pod Locations
52
Solutions for the Motorola 68360
Chapter 3: Connecting and Configuring the Analysis Probe
Connecting the Analysis Probe to the Logic Analyzer
To connect to the 16600A logic analyzer
Use the figure below to connect the analysis probe to the Agilent
Technologies 16600A logic analyzer. Find the labels that were shipped
with the high-density cables and use them to help identify the
connections.
Configuration File
Use configuration files C_360_1S (state) or
C_360_1T (timing) with the 16600A logic analyzer.
Solutions for the Motorola 68360
53
Chapter 3: Connecting and Configuring the Analysis Probe
Connecting the Analysis Probe to the Logic Analyzer
To connect to the 16601A logic analyzer
Use the figure below to connect the analysis probe to the Agilent
Technologies 16601A logic analyzer. Find the labels that were shipped
with the high-density cables and use them to help identify the
connections.
54
Solutions for the Motorola 68360
Chapter 3: Connecting and Configuring the Analysis Probe
Connecting the Analysis Probe to the Logic Analyzer
Configuration File
Use configuration files C_360_1S (state) or C_360_1T
(timing) with the 16601A logic analyzer.
Solutions for the Motorola 68360
55
Chapter 3: Connecting and Configuring the Analysis Probe
Connecting the Analysis Probe to the Logic Analyzer
To connect to the 16602A logic analyzer
Use the figure below to connect the analysis probe to the Agilent
Technologies 16602A logic analyzer. Find the labels that were shipped
with the high-density cables and use them to help identify the
connections.
56
Solutions for the Motorola 68360
Chapter 3: Connecting and Configuring the Analysis Probe
Connecting the Analysis Probe to the Logic Analyzer
Configuration File
Use configuration files C_360_1S (state) or C_360_1T
(timing) with the 16602A logic analyzer.
Solutions for the Motorola 68360
57
Chapter 3: Connecting and Configuring the Analysis Probe
Connecting the Analysis Probe to the Logic Analyzer
To connect to the 16550A analyzer
Use the figure below to connect the analysis probe to the Agilent
Technologies 16550A one-card logic analyzer. For a two-card 16550A
logic analyzer, use the figure below for the master card and the figure
on the next page for the expander card. Find the labels that were
shipped with the high density termination adapter cables and use them
to help identify the connections.
Configuration File
Use configuration files C_360_1S (state) or C_360_1T
(timing) with the 16550A logic analyzer (one- or twocard).
58
Solutions for the Motorola 68360
Chapter 3: Connecting and Configuring the Analysis Probe
Connecting the Analysis Probe to the Logic Analyzer
Expansion card connections for a two-card Agilent Technologies
16550A logic analyzer. Connection of J4, J5, and J6 is optional.
Solutions for the Motorola 68360
59
Chapter 3: Connecting and Configuring the Analysis Probe
Connecting the Analysis Probe to the Logic Analyzer
To connect to the two-card 16554/55/56/57
analyzers
Use the figure below to connect the analysis probe to the two-card
Agilent Technologies 16554A/55A/56A and 16555D/56D/57D logic
analyzers. Find the labels that were shipped with the high-density
cables and use them to help identify the connections. Connection of J4
is optional.
60
Solutions for the Motorola 68360
Chapter 3: Connecting and Configuring the Analysis Probe
Connecting the Analysis Probe to the Logic Analyzer
Configuration File
Use configuration files C_360_2S (state) or C_360_2T
(timing) with the two-card 1654/55/56/57 logic analyzers.
Solutions for the Motorola 68360
61
Chapter 3: Connecting and Configuring the Analysis Probe
Connecting the Analysis Probe to the Logic Analyzer
To connect to the three-card 16554/55/56/57
analyzers
Use the following figures to connect the analysis probe to the threecard Agilent Technologies 16554A/55A/56A and 16555D/56D/57D logic
analyzers. Find the labels that were shipped with the high-density
cables and use them to help identify the connections. J4, J5, and J6 are
optional.
Configuration File
Use configuration files C_360_2S (state) or C_360_2T
(timing) with the three-card 1654/55/56/57 logic analyzers.
62
Solutions for the Motorola 68360
Chapter 3: Connecting and Configuring the Analysis Probe
Connecting the Analysis Probe to the Logic Analyzer
Three-card Agilent Technologies 16554/55/56/57 logic analyzer
connections (continued)
Solutions for the Motorola 68360
63
Chapter 3: Connecting and Configuring the Analysis Probe
Connecting the Analysis Probe to the Logic Analyzer
64
Solutions for the Motorola 68360
Chapter 3: Connecting and Configuring the Analysis Probe
Connecting the Analysis Probe to the Logic Analyzer
To connect to the 1660A/AS/C/CS/CP logic
analyzers
Use the figure below to connect the analysis probe to the Agilent
Technologies 1660A/C logic analyzers. Find the labels that were
shipped with the high-density cables and use them to help identify the
connections. Connection of J4 is optional.
Configuration File
Use configuration files C_360_1S (state) or C_360_1T
(timing) with the 1660-series logic analyzer.
Solutions for the Motorola 68360
65
Chapter 3: Connecting and Configuring the Analysis Probe
Connecting the Analysis Probe to the Logic Analyzer
To connect to the 1661A/AS/C/CS/CP logic
analyzers
Use the figure below to connect the analysis probe to the Agilent
Technologies 1661A/C logic analyzers. Find the labels that were
shipped with the high-density cables and use them to help identify the
connections.
66
Solutions for the Motorola 68360
Chapter 3: Connecting and Configuring the Analysis Probe
Connecting the Analysis Probe to the Logic Analyzer
Configuration File
Use configuration files C_360_1S (state) or C_360_1T
(timing) with the 1661-series logic analyzer.
Solutions for the Motorola 68360
67
Chapter 3: Connecting and Configuring the Analysis Probe
Connecting the Analysis Probe to the Logic Analyzer
To connect to the 1670A/D logic analyzer
Use the figure below to connect the analysis probe to the Agilent
Technologies 1670A/D logic analyzer. Find the labels that were shipped
with the high-density cables and use them to help identify the
connections. Connection of J4 is optional.
Configuration File
Use configuration files C_360_2S (state) or C_360_2T
(timing) with the 1670-series logic analyzers.
68
Solutions for the Motorola 68360
Chapter 3: Connecting and Configuring the Analysis Probe
Connecting the Analysis Probe to the Logic Analyzer
To connect to the 1671A/D logic analyzer
Use the figure below to connect the analysis probe to the Agilent
Technologies 1671A/D logic analyzer. Find the labels that were shipped
with the high-density cables and use them to help identify the
connections.
Solutions for the Motorola 68360
69
Chapter 3: Connecting and Configuring the Analysis Probe
Connecting the Analysis Probe to the Logic Analyzer
Configuration File
Use configuration files C_360_2S (state) or C_360_2T
(timing) with the 1671-series logic analyzers.
70
Solutions for the Motorola 68360
Chapter 3: Connecting and Configuring the Analysis Probe
Configuring the Analysis Probe
Configuring the Analysis Probe
Configuring the analysis probe consists of the following:
•
Configuring the analysis probe for address reconstruction.
The functionality of the analysis probe and logic analyzer, and the
accuracy of displays provided by the inverse assembler, depend on
the address-reconstruction feature of the analysis probe.
•
Duplicating the target clock circuitry (if required).
When the Agilent Technologies E2448B analysis probe is used with
several stacked PGA sockets or with a flexible circuit adapter, the
operation of the 68360 clock circuitry may be degraded. To correct
this problem, it is possible to duplicate the target clock circuitry on
the analysis probe by using socket U3.
Solutions for the Motorola 68360
71
Chapter 3: Connecting and Configuring the Analysis Probe
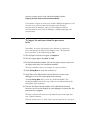
Configuring the analysis probe for address reconstruction
Configuring the analysis probe for address
reconstruction
The analysis probe can regenerate the upper address lines when they
are being used for another function, such as Write Enables. These
upper pseudo "address lines" are useful for seeing what addresses are
actually being used internally by the microprocessor. Address
reconstruction uses the chip selects and upper address lines to recreate the upper bits so they can be viewed on the logic analyzer.
Although the 68360 only uses A[31:28] as Write Enables, the analysis
probe reconstructs A[31:24].
When the analysis probe is shipped from the factory, the default
configuration is with all address lines enabled (no Write Enables). In
this configuration, the logic analyzer displays whatever is being probed
on A[31:28]. The green LED on the analysis probe indicates when this
default configuration is being used. When you download a new
configuration that uses the upper bits as Write Enables, the green LED
turns off.
The LED indicates that a configuration is not presently programmed,
or that the upper four address lines are being used as address lines
rather than Write Enables (default configuration). If the EEPROM
containing the address information becomes corrupt, the LED will turn
on, indicating that the default configuration has been loaded. The LED
can be used as an indicator that something may be wrong.
To perform address reconstruction, the analysis probe stores copies of
the processor’s internal registers in non-volatile memory. To configure
the analysis probe, the Agilent Technologies E2448B must be
connected to an emulation module.
The general steps are:
1 Set the emulation module’s EMSIM registers.
2 Load the EMSIM register values into the analysis probe.
These steps may be performed using a debugger or an Agilent
Technologies 16600A/700A-series logic analysis system.
72
Solutions for the Motorola 68360
Chapter 3: Connecting and Configuring the Analysis Probe
Configuring the analysis probe for address reconstruction
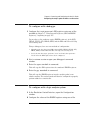
To configure with a debugger
1 Configure the target processor’s SIM registers using one of the
methods in Chapter 7, “Using Internal Registers (SIM and EMSIM
Registers),” beginning on page 157.
You need to set the emulator copies (EMSIM registers) of the MCR,
PEPAR, SYPCR, AVR, MBAR, GIMR, and the BRx and ORx of all chip
selects being used.
Using a debugger, there are two methods of configuration:
•
Manually write the values into SIM registers MCR, PEPAR, SYPCR, AVR,
MBAR, GIMR, and the BRx and ORx of all chip selects being used.
•
Load code into the target, perform a "reset" and "run", then perform a
"break" after the SIM registers have been configured.
2 Start a telnet session or open your debugger’s command
window.
3 Enter the sync sim built-in command.
This will copy the SIM registers into the emulator’s EMSIM registers.
4 Enter the pp load built-in command.
This will copy the EMSIM registers into the analysis probe’s nonvolatile memory. The analysis probe will then be configured to properly
perform address reconstruction.
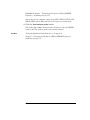
To configure with a logic analysis system
1 In the Emulation Control Interface, open the Configuration
window.
2 Configure the values of the EMSIM registers using one of the
Solutions for the Motorola 68360
73
methods in Chapter , “Using Internal Registers (SIM and EMSIM
Registers),” beginning on page 157.
You need to set the emulator copies of the MCR, PEPAR, SYPCR, AVR,
MBAR, GIMR, and the BRx and ORx of all chip selects being used.
3 Click the Load analysis probe button.
This sends a pp load command to the emulator to copy the EMSIM
registers into the analysis probe’s non-volatile memory.
See Also
“Using the Emulation Control Interface” on page 123.
Chapter 7, “Using Internal Registers (SIM and EMSIM Registers),”
beginning on page 157.
74
Solutions for the Motorola 68360
Chapter 3: Connecting and Configuring the Analysis Probe
68360 clock configuration
68360 clock configuration
When the Agilent Technologies E2448B analysis probe is used with
several stacked PGA sockets or with a flexible circuit adapter, the
operation of the 68360 clock circuitry may be degraded. To correct this
problem, it is possible to duplicate the target clock circuitry on the
analysis probe by using socket U3.
The most likely problem that will be encountered will be the loss of the
ability of the PLL to maintain lock due to excessive lead length in the
XFC circuit. This can be remedied by adding the XFC filter to U3.
Another common problem is the loss of the clock when a crystal is
used. This is fixed by adding the crystal circuitry to U3.
Unless the above conditions exist, it is not necessary to install any
components in the socket.
Socket U3 is connected to the 68360 clock and PLL signals to allow the
circuit modification listed below. When components are added to U3 it
is necessary to disconnect the leads for the corresponding signals from
the target system by pushing pins out of one of the PGA sockets
connected to the bottom of the analysis probe. The easiest way to add
components to U3 is to use a 14-pin header, rather than soldering
directly to the socket.
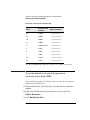
There are five possible clock modification using U3. Any one of the five,
or a combination, can be used. The table on the next page lists the
modifications, and the figure shows the pinout for U3.
Solutions for the Motorola 68360
75
Chapter 3: Connecting and Configuring the Analysis Probe
68360 clock configuration
Modification
PGA Pins to be Removed
PLL filter capacitor selection via XFC
Remove XFC pin
Crystal circuit with phase shift and
biasing circuitry via EXTAL and XTAL
Remove EXTAL and XTAL pins
Oscillators. The socket layout is
compatible with 14-pin DIP oscillators.
Remove EXTAL and XTAL pins
Termination of EXTAL line when using
TTL source from target
No pins need to be removed
PLL configuration control via MODCK0
and MODCK1 signals
Remove MODCK0 and/or MODCK1 pins
The unconnected pins can be used as junction points for circuitry
added to U3.
76
Solutions for the Motorola 68360
Chapter 3: Connecting and Configuring the Analysis Probe
Configuring the Logic Analysis System
Configuring the Logic Analysis System
You configure the logic analyzer by loading a configuration file. The
information in the configuration file includes:
•
Label names and channel assignments for the logic analyzer
•
Inverse assembler file name
The configuration file you use is determined by the logic analyzer you
are using, and whether you are performing state or timing analysis. The
configuration file names are listed with the logic analyzer connection
tables, and in a table at the end of this section.
The procedures for loading a configuration file depend on the type of
logic analyzer you are using. There is one procedure for the Agilent
Technologies 16600/700 series logic analysis systems, and another
procedure for the Agilent Technologies 1660-series, 1670-series, and
logic analyzer modules in a 16500B/C mainframe. Use the appropriate
procedures for your analyzer.
Solutions for the Motorola 68360
77
Chapter 3: Connecting and Configuring the Analysis Probe
Configuring the Logic Analysis System
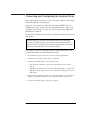
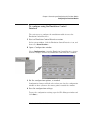
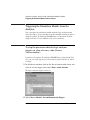
To load configuration and inverse assembler
files—16600/700 logic analysis systems
If you did not use Setup Assistant, you can load the configuration and
inverse assembler files from the logic analysis system hard disk.
1 Click on the File Manager icon. Use File Manager to ensure that
the subdirectory /logic/configs/hp/m683xx/E2448B/ exists.
If the above directory does not exist, you need to install the M683XX
Processor Support Package. Close File Manager, then use the
procedure on the CD-ROM jacket to install the M683XX Processor
Support Package before you continue.
2 Using File Manager, select the configuration file you want to load
in the /logic/configs/hp/m683xx/E2448B/ directory, then click
Load. If you have more than one logic analyzer installed in your
logic analysis system, use the Target field to select the machine
you want to load.
The logic analyzer is configured for 68360 analysis by loading the
appropriate configuration file. Loading the indicated state file also
automatically loads the inverse assembler. The configuration file you
use is determined by the logic analyzer you are using, and whether you
are performing state analysis or timing analysis. The configuration file
names are located at the bottom of the table showing the connections
for your particular logic analyzer. They are also shown in the table on
page 80.
3 Close File Manager.
78
Solutions for the Motorola 68360
Chapter 3: Connecting and Configuring the Analysis Probe
Configuring the Logic Analysis System
To load configuration files—other logic
analyzers
If you have an Agilent Technologies 1660-series, 1670-series, or logic
analyzer modules in a 16500B/C mainframe use these procedures to
load the configuration file and inverse assembler.
The first time you set up the logic analyzer, make a duplicate copy of
the flexible disk. For information on duplicating disks, refer to the
reference manual for your logic analyzer.
For logic analyzers that have a hard disk, you might want to create a
directory such as 68360 on the hard drive and copy the contents of the
floppy onto the hard drive. You can then use the hard drive for loading
files.
Configuring the logic analyzer consists of loading the software by
inserting the floppy disk into the logic analyzer disk drive and loading
the proper configuration file.
1 Insert the floppy disk in the front disk drive of the logic analyzer.
2 Go to the Flexible Disk menu.
3 Configure the menu to load.
4 Use the knob to select the appropriate configuration file.
The configuration file you use is determined by the logic analyzer you
are using, and whether you are performing state analysis or timing
analysis. The configuration files are shown with the logic analyzer
connection tables, and are also in the table on the next page.
5 Select the appropriate analyzer on the menu. The Agilent
Technologies 165xx logic analyzer modules are shown in the
table on the next page.
6 Execute the load operation on the menu to load the file into the
logic analyzer.
Solutions for the Motorola 68360
79
Chapter 3: Connecting and Configuring the Analysis Probe
Configuring the Logic Analysis System
The logic analyzer is configured for 68360 analysis by loading the
appropriate configuration file. Loading a state configuration file also
automatically loads the inverse assembler.
7 If you are using the Agilent Technologies 16505A Prototype
Analyzer, insert the "16505 Prototype Analyzer" flexible disk into
disk drive of the prototype analyzer and update the Agilent
Technologies 16505A from the Session Manager. You must close
your workspace to run the update.
The Agilent Technologies 16505A Prototype Analyzer requires
software version A.01.30 or higher to work with the Agilent
Technologies E2448B.
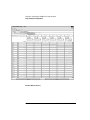
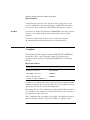
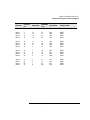
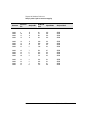
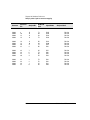
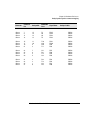
Logic Analyzer Configuration Files
Analyzer Model
16600A
16601A
16602A
16550A (one card)
Analyzer
Description
(Modules Only)
na
na
na
100 MHz STATE
500 MHz TIMING
16550A (two cards)
100 MHz STATE
500 MHz TIMING
16554A (two card)
0.5M SAMPLE 70/
250 MHz LA
16555A/D (two card) 1.0M SAMPLE
110/250 MHz LA
16556A/D (two card) 1.0M SAMPLE
100/400 MHz LA
16557D (two card)
1.0M SAMPLE
100/400 MHz LA
16554A (three card)
0.5M SAMPLE
70/250 MHz LA
16555A/D (three card) 1.0M SAMPLE
110/250 MHz LA
16556A/D (three card) 1.0M SAMPLE
100/400 MHz LA
16557D (three card)
1.0M SAMPLE
100/400 MHz LA
80
Configuration File
for Inverse
Assembly (State)
Configuration File
for Timing
C_360_1S
C_360_1S
C_360_1S
C_360_1S
C_360_1T
C_360_1T
C_360_1T
C_360_1T
C_360_1S
C_360_1T
C_360_2S
C_360_2T
C_360_2S
C_360_2T
C_360_2S
C_360_2T
C_360_2S
C_360_2T
C_360_2S
C_360_2T
C_360_2S
C_360_2T
C_360_2S
C_360_2T
C_360_2S
C_360_2T
Solutions for the Motorola 68360
Chapter 3: Connecting and Configuring the Analysis Probe
Configuring the Logic Analysis System
1660A/AS/C/CS/CP
1661A/AS/C/CS/CP
1670A/D
1671A/D
na
na
na
na
Solutions for the Motorola 68360
C_360_1S
C_360_1S
C_360_2S
C_360_2S
C_360_1T
C_360_1T
C_360_2T
C_360_2T
81
Chapter 3: Connecting and Configuring the Analysis Probe
Configuring the Logic Analysis System
82
Solutions for the Motorola 68360
4
Analyzing the 68360 with a Logic
Analyzer
83
Analyzing the 68360 with a Logic Analyzer
This chapter describes modes of operation for the Agilent Technologies
E2448B analysis probe. It also describes data, symbol encodings, and
information about the inverse assembler.
The information in this chapter is presented in the following sections:
•
Modes of operation
•
Logic analyzer configuration
•
Using the inverse assembler
84
Solutions for the Motorola 68360
Chapter 4: Analyzing the 68360 with a Logic Analyzer
Modes of Operation
Modes of Operation
The Agilent Technologies E2448B analysis probe can be used in three
different analysis modes: State-per-ack, State-per-clock, or Timing. The
following sections describe these operating modes and how to
configure the logic analyzer for each mode.
State-per-ack mode
In State-per-ack mode, the logic analyzer uses trigger sequencer store
qualification to capture only address and data-acknowledge cycles.
This is the default mode set up by the configuration files.
State-per-ack mode provides the greatest information density in the
logic analyzer acquisition memory.
State-per-clock mode
In State-per-clock mode, every clock cycle is captured by the logic
analyzer, including idle and wait states between and during tenures. To
configure the logic analyzer for State-per-clock mode, use the Trigger
menu to change the trigger store qualification to "anystate". For
additional information, refer to the "Trigger Menu" section.
Note that data acquired in state-per-clock mode may not provide
correct disassembled results. For inverse assembly, state-per-ack mode
is recommended.
Solutions for the Motorola 68360
85
Chapter 4: Analyzing the 68360 with a Logic Analyzer
Modes of Operation
Timing mode
In Timing mode, the logic analyzer samples the microcontroller pins
asynchronously, at a user-selected sampling rate. The Timing mode is
set up by the Timing configuration files.
86
Solutions for the Motorola 68360
Chapter 4: Analyzing the 68360 with a Logic Analyzer
Logic Analyzer Configuration
Logic Analyzer Configuration
The following sections describe the logic analyzer configuration as set
up by the configuration files.
Trigger specification
The trigger specification is set up by the software to store all states. If
you modify the trigger specification to store only selected bus cycles,
incorrect or incomplete disassembly may be displayed.
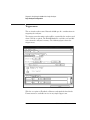
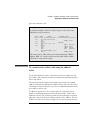
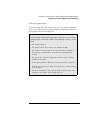
Format menu
This section describes the organization of 68360 signals in the logic
analyzer’s Format menu.
The configuration software sets up the analyzer format menu on the
analyzer. The figure on the following page shows the Format menu for
the 68360.
The configuration files contain predefined format specifications. These
format specifications include all labels for monitoring the
microcontroller. The tables on the following pages show the signals
used in the STAT label and the predefined symbols set up by the
configuration files.
Do not modify the ADDR, DATA, or STAT labels in the format
specification if you want inverse assembly. Changes to these labels may
cause incorrect or incomplete inverse assembly.
Solutions for the Motorola 68360
87
Chapter 4: Analyzing the 68360 with a Logic Analyzer
Logic Analyzer Configuration
Format Menu (State)
88
Solutions for the Motorola 68360
Chapter 4: Analyzing the 68360 with a Logic Analyzer
Logic Analyzer Configuration
Status Encoding
This section describes symbol information that has been set up by the
analysis probe configuration software. The signal-to-connector tables
in the “Hardware Reference” chapter list all the 68360 signals probed
and their corresponding analyzer channels.
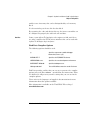
The table below describes each of the bits of the STAT label. This table
is specifically for a state configuration. The timing configurations have
many of the same signals, and those signals are represented by the
same symbols used for state configurations.
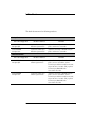
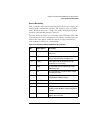
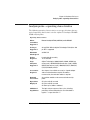
Agilent Technologies E2448B STAT Bit Description
Bit
Status Signals
Description
0
R/~W
This signal is high for read cycles and low for
write cycles.
1-2
SIZ[0:1]
These signals indicate the size of the bus
transfer requested by the microprocessor.
3-6
FC[0:3]
These signals indicate the type of cycle the
microprocessor is executing.
7
~RMC
This signal indicates the execution of a readmodify-write cycle.
8
~OE
This signal indicates an external device should
place data on the bus.
9
FREEZE
This signal indicates that the 68360 has
acknowledged a BDM breakpoint.
10
~RESETH
Hard system reset.
11
~RESETS
Soft system reset.
12
~BG
This signal is low when the current bus cycle is
complete and the 68360 has relinquished control
of the bus.
13
~BR
This signal is low when an external device
requests bus mastership.
Solutions for the Motorola 68360
89
Chapter 4: Analyzing the 68360 with a Logic Analyzer
Logic Analyzer Configuration
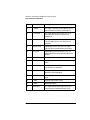
Bit
Status Signals
Description
14
~BGACK
This signal is low when the microprocessor has
granted control of the bus to another device.
15
~IFetch/DSI
This signal identifies the present cycle as an
instruction fetch. Since this signal is timemultiplexed
16
Normal
This signal indicates that the bus cycle is
“normal” (took three or more clock cycles to
complete.).
17
Normal Flush
Valid during “normal” bus cycle. This signal
indicates the instruction pipeline was flushed.
18
Fast Flush
Valid following a fast-termination cycle. This
signal indicates that the instruction pipeline was
flushed.
19
InstFetch
This signal is high during an instruction fetch.
20 - 21
IPIPE[0:1]
These signals are the 68360 instruction pipeline
status.
22 - 23
DSACK[0:1]
These signals indicate the size of the bus
transfer that was completed.
24
~BERR
This signal indicates that an erroneous bus
operation is being attempted.
25
~PERR
This signal indicates a parity error during a read
cycle.
26
~HALT
Suspends external bus activity.
27
~AVEC
Autovector request.
29
Show Qual
This signal indicates that the present cycle is
internal to the microcontroller (show cycle).
90
Solutions for the Motorola 68360
Chapter 4: Analyzing the 68360 with a Logic Analyzer
Logic Analyzer Configuration
Predefined Logic Analyzer Symbols
The configuration software sets up symbol tables on the logic analyzer.
The symbol tables of the format specification are set up with names to
identify values from the 68360. The following tables list the symbols for
the FC, SIZ, and DSACK labels, respectively. Bit 0 is the least
significant bit of the 16-bit field.
Label
Symbol
Pattern
user data
user prgm
0000
0001
0010
0011
FCx
supr data
supr prgm
cpu
0100
0101
0110
X111
dma
1xxx
SIZ
long
byte
word
3 byte
00
01
10
11
DSACK
long
byte
word
wait
00
01
10
11
Solutions for the Motorola 68360
91
Chapter 4: Analyzing the 68360 with a Logic Analyzer
Logic Analyzer Configuration
Trigger menu
This section describes some Motorola 68360-specific considerations in
triggering the analyzer.
The trigger menu determines what will be acquired by the analyzer and
when it will be acquired. The E2448B hardware excludes wait and idle
states from the analyzer’s memory. The following figure shows the
trigger menu.
With the exception of Fastflush, all busses and signals defined in the
Format menu are available for use in any single trigger term.
92
Solutions for the Motorola 68360
Chapter 4: Analyzing the 68360 with a Logic Analyzer
Logic Analyzer Configuration
To change the trigger conditions
You can use the trigger menu to change the triggering and storage
qualification to include or exclude specified cycles.
Excluding tenure from other bus masters. In a system in which
devices other than the Motorola 68360 assume bus mastership, you can
exclude tenures by other masters by defining new terms and changing
store qualification. Define the term MYBUS, where:
MYBUS = (~BGACK = 1)
Change the store qualification to MYBUS, as shown in the following
figure.
This allows other bus masters to gain control of the bus without having
that activity captured by the logic analyzer.
Solutions for the Motorola 68360
93
Chapter 4: Analyzing the 68360 with a Logic Analyzer
Logic Analyzer Configuration
Triggering Note:
When the Motorola 68360 accesses a 32-bit device, it can fetch two
instructions in one clock cycle. If two instructions are fetched, the
address for one instruction will appear on the address bus, whereas the
other will not. If you specify a trigger on the address of the instruction
that does not appear on the bus, no trigger will be found.
To ensure the trigger is found on the fetch of a particular instruction
from a 32-bit device, set the two least significant address bits to don’t
cares. (Change the base of the ADDR label to binary to enter the two
x’s.)
If the trigger is specified as a symbol, you can specify “Align to 4 Bytes”
in the Symbol browser menu.
The alignment may be specified in the Symbol Browser or the Source
Line Trigger Menu.
94
Solutions for the Motorola 68360
Chapter 4: Analyzing the 68360 with a Logic Analyzer
Using the Inverse Assembler
Using the Inverse Assembler
This section discusses the general output format of the inverse
assembler and processor-specific information.
To display captured state data
The logic analyzer displays captured state data in the Listing menu.
The inverse assembler display is obtained by setting the base for the
DATA label to Invasm.
Captured data is displayed as shown in the following figure. The figure
displays the state listing for 32-bit bus cycles after disassembly. The
inverse assembler is constructed so the mnemonic output closely
resembles the actual assembly source code.
Note: bus cycles that execute in two clocks are identified as “fast.” Bus
cycles that execute in more than two clocks are identified as “norm”
(normal). For example, a normal bus cycle occurred in line 21 in the
illustration on the next page.
The “#” symbol in the state listing identifies an immediate operand.
Unexecuted prefetches are marked with a hyphen (-).
The following figure shows a typical Listing menu.
Solutions for the Motorola 68360
95
Chapter 4: Analyzing the 68360 with a Logic Analyzer
Using the Inverse Assembler
Listing Menu
Displaying Data with the Agilent Technologies B4620B
Source Correlation Tool Set
Source correlation correlates the addresses from cache with the highlevel code execution. The figure below shows execution of data that is
correlated to the data shown on the previous page.
96
Solutions for the Motorola 68360
Chapter 4: Analyzing the 68360 with a Logic Analyzer
Using the Inverse Assembler
Source Correlation Tool Set Data
Solutions for the Motorola 68360
97
Chapter 4: Analyzing the 68360 with a Logic Analyzer
Using the Inverse Assembler
To align the inverse assembler
The 68360 microprocessor supports a 32-bit bus width, but many
instructions are 16 bits. The microprocessor does not provide enough
status information for the inverse assembler to know whether the first
word of an opcode fetch is in the high (even) or low (odd) word of a
32-bit code fetch. To ensure correct disassembly, you may need to help
align the inverse assembler. Once the top line of the display is properly
aligned, the inverse assembler will disassemble from this point through
the end of the screen. In the Listing menu, use the following steps to
align the inverse assembler to the first word of an opcode fetch:
1 Select a line on the display that you know contains the first word
of an instruction fetch.
2 Roll this line to the top of the display.
Do not roll the instruction to the line number field at the left center
screen. In the Listing Menu figure on page 96, line 11 is the top of
the display.
3 Select the appropriate field for your analyzer.
a For the Agilent Technologies 16600/700 series analyzers,
select "Invasm," then select "Align."
b For the other logic analyzers, select "Invasm Options" and use
the "Code Synchronization" submenu.
4 Select the choice that identifies which word in the 32-bit long
word contains the first word of the instruction fetch.
For 8-bit and 16-bit target data busses the even/odd selections have
no effect.
5 Select "Align."
The listing inverse assembles from the top line down. Any data before
98
Solutions for the Motorola 68360
Chapter 4: Analyzing the 68360 with a Logic Analyzer
Using the Inverse Assembler
the top of the display is left unchanged.
The listing will inverse assemble from the top line down. Any data
before this screen is left unchanged. Rolling the screen up will inverse
assemble the lines as they appear on the bottom of the screen. If you
jump to another area of the listing by entering a new line number or by
rolling the screen down, you may have to re-synchronize the inverse
assembler by repeating the described steps.
Each time you inverse assemble a block of memory, the analyzer will
keep that block in the inverse assembled condition. You can inverse
assemble several different blocks in the analyzer memory, but the
activity between those blocks will not be inverse assembled.
Solutions for the Motorola 68360
99
Chapter 4: Analyzing the 68360 with a Logic Analyzer
Using the Inverse Assembler
Inverse assembler output format
The following paragraphs explain the operation of the inverse
assembler and the results you can expect under certain conditions.
Interpreting Data
The instruction size for the 68360 is always 16 bits. When the
microprocessor is operating on a 32-bit bus, instructions may begin in
either the even or odd word (16 bits) of the captured long word (32
bits). In this case, the inverse assembler generates the least significant
hexadecimal digit of the instruction address.
The inverse assembler displays most data in hexadecimal format. When
data is displayed in decimal format, it has a period (.) suffix.
The pair of asterisks (**) displayed in the operand field of an
instruction indicates that a byte of an expected operand was not stored
in the logic analyzer memory. Four asterisks (****) indicate that one
word of an expected operand was missing, and eight asterisks signify a
missing long word. Missing operands (or parts of operands) can result
from 68360 instruction prefetch activity or storage qualification.
Examples:
ORI.B
#**,D2
(missing byte operand)
ORI.W
#****,D1
(missing word operand)
ORI.L
#234A****,D3
(missing “lower” word of the operand)
ORI.L
#********,D3
(missing both words of the operand)
The 68360 is capable of supporting byte, word, and long word (32-bit)
operands. During operand reads and writes, 32-bit values appear on
the microprocessor data bus. In the case of byte or word operands, the
inverse assembler attempts to display “xx” for the bytes of the data
that are invalid. This is not always possible since port-width
information is sometimes unavailable. In these cases, the inverse
assembler will display the entire 32 bits and the user must know which
100
Solutions for the Motorola 68360
Chapter 4: Analyzing the 68360 with a Logic Analyzer
Using the Inverse Assembler
bits are valid.
When the 68360 is operating in a full 32-bit environment, it is possible
that two instructions (16 bits each) will be fetched on one bus cycle.
When this happens, the instructions will be displayed on separate lines.
Unexecuted Prefetches
The 68360 microprocessor is a prefetching microprocessor. That is, it
fetches up to three instruction words while the last opcode is still being
executed. When a program executes an instruction that causes a
branch, prefetched words are not used and will be discarded by the
microprocessor. These words are called “unexecuted prefetches.”
Unexecuted prefetches are indicated by the prefix “-” (hyphen) in the
inverse assembly listing.
The logic analyzer captures prefetches, even if they are not executed.
Care must be taken when you are specifying a trigger condition or a
storage qualification and the instruction of interest follows an
instruction that may cause branching. An unused prefetch may
generate an unwanted trigger.
Since the microprocessor only prefetches at most three words, one
technique to avoid unwanted triggering from unused prefetches is to
add at least 8 to the trigger address. This trigger condition will only be
satisfied if the branch is not taken.
The 68360 pipeline is effectively four words deep. This means that by
the time a branching instruction is fully decoded, up to three other
unexecuted instruction words may have already been prefetched
across the data bus and stored in the logic analyzer. Both exceptions
and instructions can cause the pipeline to be flushed and subsequently
refilled. Branches, jumps, calls, and returns are the most common
causes of pipeline flushes, but there are others. Refer to your 68360
user’s manual for more information.
Error Messages
The following list of messages will help you identify operation errors.
Data Error. Trace data collected by the logic analyzer cannot be
retrieved from memory. This indicates a hardware error or inverse
Solutions for the Motorola 68360
101
Chapter 4: Analyzing the 68360 with a Logic Analyzer
Using the Inverse Assembler
assembler software error.
Illegal Opcode. Undefined opcode encountered. Microprocessor
action cannot be determined.
Do not remove or append bits to the less significant end of the ADDR, DATA, or
STAT labels in the format specification if you want inverse assembly. Changes
may cause incorrect results. Also note that if the trace specification is modified
to store only selected bus cycles, incorrect or incomplete inverse assembly may
result.
102
Solutions for the Motorola 68360
Chapter 4: Analyzing the 68360 with a Logic Analyzer
Using the Inverse Assembler
To use the Invasm menu
The Invasm menu provides three choices: Load, Filter, and Options.
These dialogs assist in analyzing and displaying data. Access the
Invasm menu in the Listing window.
The following sections describe these dialogs.
Load
The Load dialog lets you load a different inverse assembler and apply it
to the data in the Listing menu. In some cases you may have acquired
raw data; you can use the Load dialog to apply an inverse assembler to
that data.
Display Filtering
The inverse assembler lets you Show or Suppress several types of
cycles. This allows you to focus on and display more cycles of interest.
The figure below shows the Filter menu.
Solutions for the Motorola 68360
103
Chapter 4: Analyzing the 68360 with a Logic Analyzer
Using the Inverse Assembler
The settings for the various operations do not affect the data which is
stored by the logic analyzer, they only affect whether that data is
displayed or not. The same data can be examined with different
settings, for different analysis requirements.
This function allows faster analysis in two ways. First, unneeded
information can be filtered out of the display. The figure above shows
the settings to suppress extensions words and overfetch.
Second, particular operations can be isolated by suppressing all other
operations. For example, memory writes can be shown, with all other
operations suppressed, allowing quick analysis of memory writes.
The operations which can be shown or suppressed are User/Supervisor
Reads/Writes, Program Extension states, Overfetch instructions,
Branching, Call/Return, or other instructions. The Call/Return opcodes
are JSR, BSR, BKPT, TRAP, RTD, RTR, RTS, RTE, STOP, and
ILLEGAL. The Branching opcodes are BRA, Bcc, JMP, FBcc, TRAPcc,
CHK, CHK2, and TRAPV.
Options
The Options menu lets you change the width of the display.
104
Solutions for the Motorola 68360
5
Symbols and Source Code in the
Analyzer
105
Symbols and Source Code in the Analyzer
Symbols are more easily recognized than hexadecimal address values
in logic analyzer trace displays, and they are easier to remember when
setting up triggers.
Agilent Technologies logic analyzers let you assign user-defined symbol
names to particular label values.
Also, you can download symbols from certain object file formats into
Agilent Technologies logic analyzers.
When source file line number symbols are downloaded to the logic
analyzer, you can set up triggers on source lines. The Agilent
Technologies B4620B Source Correlation Tool Set also lets you display
the high-level source code associated with captured data.
After describing user-defined symbols, the rest of this chapter
describes the requirements and considerations for displaying object file
symbols and source code for address values captured by a logic
analyzer.
106
Solutions for the Motorola 68360
Chapter 5: Symbols and Source Code in the Analyzer
User-Defined Symbols
User-Defined Symbols
User-defined symbols are symbols you create from within the logic
analyzer user interface by assigning symbol names to label values.
Typically, you assign symbol names to address label values, but you can
define symbols for data, status, or other label values as well.
User-defined symbols are saved with the logic analyzer configuration.
Predefined CPU32+ Symbols
The logic analyzer configuration files include predefined symbols.
These symbols appear along with the other user-defined symbols in the
logic analyzer.
The predefined symbols are listed on page 91.
Solutions for the Motorola 68360
107
Chapter 5: Symbols and Source Code in the Analyzer
Object File Symbols
Object File Symbols
The most common way to load program symbols into the logic analyzer
is from an object file that is created when the program is compiled.
Requirements
In order for object file symbols and source code to be accurately
assigned to address values captured by the logic analyzer, you need:
An accurate bus trace
An Agilent Technologies analysis probe is used to capture the
microcontroller data.
An inverse assembler
The inverse assembler software is included with Agilent Technologies
analysis probes. The CPU32+ inverse assembler decodes captured data
into program counter (PC) addresses (also known as software
addresses) and assembly language mnemonics.
A symbol file
You need an object file containing symbolic debug information in a
format the logic analyzer understands.
Alternatively, you can use a General Purpose ASCII (GPA) symbol file
(see Chapter 11, “General-Purpose ASCII (GPA) Symbol File Format,”
beginning on page 237).
Visible internal cycles
To store internal cycles in the trace, enable Show Cycles (SHEN) in the
Module Configuration Register (MCR).
108
Solutions for the Motorola 68360
Chapter 5: Symbols and Source Code in the Analyzer
Object File Symbols
To use object file symbols in the 16600A/700A
To load symbols in the Agilent Technologies 16600A/16700A-series
logic analysis system, open the logic analyzer module’s Setup window
and select the Symbol tab; then, select the Object File tab. Make sure
the label is ADDR. From this dialog you can select object files and load
their symbol information.
When you load object file symbols into a logic analyzer, a database of
symbol/line number to address assignments is generated from the
object file. The Symbol Selector dialog allows you to use a symbol in
place of a hexadecimal value when defining trigger patterns, trigger
ranges, and so on.
Solutions for the Motorola 68360
109
Chapter 5: Symbols and Source Code in the Analyzer
Object File Symbols
If your language tool is not one of those listed on page 110, you can
create a symbol file in the General-Purpose ASCII (GPA) file format
(refer to the “General-Purpose ASCII (GPA) File Format” chapter).
See Also
If you have an Agilent Technologies 16600A/700A-series logic analysis
system, see the online help for more information on how to load
symbols.
If you have another logic analyzer refer to your logic analyzer
documentation for information on how to load symbol files.
Compilers
The following CPU32 compilers and their ELF/DWARF or IEEE-695
format object files can be used with Agilent Technologies logic
analyzers and the Agilent Technologies B4620B Source Correlation
Tool Set:
Object File Formats
Language System & Version
Format
Diab Data version 4.1a
ELF/DWARF
Green Hills version 1.8.8
IEEE-695
Microtec Research, Inc.
mcc68k ver. 4.6G, asm68k ver. 7.1
IEEE-695
In order to use symbols in the logic analyzer, file name and line number
information must be present in the object file. Your compiler may have
options that include or exclude this information.
Limitations: For C++ files, symbols are not demangled. Mangled names
are available for use and the trace listing will still correctly correlate to
the appropriate source file lines.
When compiling code, if possible, specify that code and data be put in
different memory ‘blocks’. A ‘block’ is 32 Kbytes. 32 Kbytes is the
110
Solutions for the Motorola 68360
Chapter 5: Symbols and Source Code in the Analyzer
Object File Symbols
smallest area of memory that can be distinguished by each memory
block.
It is also useful to put the stack in the data block.
By separating the code and data in this way, the inverse assembler can
be configured to properly decode both code and data.
See Also
Contact your Agilent Technologies sales engineer to find out if there
are other compilers for CPU32 microcontrollers that can be used with
Agilent Technologies logic analyzers.
Diab Data Compiler Options
The following options should be used:
-g
Specifies to generate symbolic debugger
information (same as -g2).
-WDDOBJECT=F
Specifies the ELF/DWARF file format.
-WDDENVIRON=cross
Specifies the cross development environment.
-WDDTARGET=MC68360
Specifies 68360 processor.
-Xdebug-mode=0xff
Turns off Diab Data extensions to the file format.
Diab Data provides a utility that you can use to generate the compiler
options you need. Enter dctrl -t and follow the instructions. When
it is finished, it will present you with a string that you can use for the
compiler options.
Please refer to the language tool supplier’s documentation for more
information about the options available.
More information is available on the World Wide Web at: http://
www.diabdata.com
Solutions for the Motorola 68360
111
Chapter 5: Symbols and Source Code in the Analyzer
Object File Symbols
Green Hills Compiler Options
The following options should be used:
-nodbg
Specifies not to use Green Hills proprietary debug
information; instead use DWARF style debugging
information.
-G
Generates extended debugging information.
-cpu=68360
Specifies code generation for the 68360 processor.
A COFF file is generated. You must then use the coff695 converter to
get an IEEE-695 file.
If you are using the Green Hills MULTI builder interface, use the
following selections:
Options➞File Options, select
“Debugging Level MULTI”
Generates extended debugging
information.
Options➞CPU, select processor
Specifies code generation for the CPU32
processor.
Options➞Advanced➞IEEE695
Generate IEEE-695 file format. You must
create a COFF file before generating the
IEEE-695 file.
Refer to the debugger information beginning on page 182 for more
information on the compiler options required to use the debugger with
the emulation module. Those options may be different than the options
required for the Agilent Technologies B4620B Source Correlation Tool
Set. For example, do not use the “-nodbg” compiler option for an object
file intended for use with the MULTI debugger. If you are using source
correlation and the debugger, generate two object files.
Please refer to the language tool supplier’s documentation for more
information about the options available. More information is available
on the World Wide Web at: http://www.ghs.com
112
Solutions for the Motorola 68360
Chapter 5: Symbols and Source Code in the Analyzer
Object File Symbols
Microtec Research Inc. Compiler Options
The following options should be used:
-g
Specifies to generate debugging information.
Please refer to the language tool supplier’s documentation for more
information about the options available.
More information is available on the World Wide Web at:
http://www.mentorg.com/microtec
Solutions for the Motorola 68360
113
Chapter 5: Symbols and Source Code in the Analyzer
Source Code
Source Code
The Agilent Technologies B4620B Source Correlation Tool Set lets you:
•
View the high-level source code associated with captured data.
•
Set up triggers based on source code.
The source correlation tool set correlates the logic analyzer’s address
label with a line of high-level source code whose address, symbol name,
file name, and line numbers are described in a symbol file downloaded
to the logic analyzer.
If you purchased a solution, the Agilent Technologies B4620B Source
Correlation Tool Set was included. Otherwise, the source correlation
tool set is available as an add-on product for the Agilent Technologies
16600A/16700A-series logic analysis system and must be licensed
before you can use it (see the System Admin dialogs for information on
licensing).
See Also
More information on configuring and using the source correlation tool
set can be found in the online help for your logic analysis system.
114
Solutions for the Motorola 68360
Chapter 5: Symbols and Source Code in the Analyzer
Source Code
Requirements for source correlation
The source correlation tool set works with many microcontrollers and
their embedded software development environments.
However, the overall effectiveness of the source correlation tool set will
vary to some degree depending on the specific development
environment it is being used in. The following areas affect the
performance of the source correlation tool set for different
development environments:
•
Analysis probe and inverse assembler.
All the information needed to reconstruct the complete address bus of the
target system must be acquired by the logic analyzer. The
Agilent Technologies E2448A analysis probe meets this requirement.
The logic analyzer’s inverse assembler may need to reconstruct any
incomplete address bus information and/or filter out any unexecuted
instructions.
When displaying the next or previous instances of a source line, the Source
Viewer display uses the PC or SW_ADDR (Software Address) label
generated by the inverse assembler.
•
Object file symbols.
The source correlation tool set requires that symbols be loaded into the
logic analyzer (refer to the “Object File Symbols” section earlier in this
chapter).
The compiler needs to produce an object file format that is readable by the
logic analyzer; otherwise; a general-purpose ASCII (GPA) format file needs
to be generated.
•
Access to source code files.
The source correlation tool set requires that you give the logic analysis
system access to your program’s high-level source files (either by NFS
mounting the file system that contains the source files or by copying
source files to the logic analysis system disk).
Solutions for the Motorola 68360
115
Chapter 5: Symbols and Source Code in the Analyzer
Source Code
Inverse Assembler Generated PC (Software
Address) Label
In the Agilent Technologies 16600A/16700A-series logic analysis
system, the inverse assembler generates a “PC” label. The PC label is
displayed as another column in the Listing tool. This label is also known
as the Software Address generated by the inverse assembler.
The “Goto this line in listing” commands in the Agilent Technologies
16600A/16700A-series logic analysis system perform a pattern search
on the PC label in the Listing display (when an inverse assembler is
loaded). Because the inverse assembler is called for each line that is
searched, the search can be slow, especially with a deep memory logic
analyzer.
Also, a single source code line will generate many assembly
instructions. The “Goto this line in listing” commands will not find a
given source code line unless the first assembly instruction generated
from the source line has been acquired by the logic analyzer.
For example, if the compiler unrolls a loop in the source code, the trace
could begin after the first assembly instruction of the loop has been
executed. A “Goto this line in listing” command would not find the
source line.
116
Solutions for the Motorola 68360
Chapter 5: Symbols and Source Code in the Analyzer
Source Code
Access to Source Code Files
The source correlation tool set must be able to access the high-level
source code files referenced by the symbol information so that these
source files can be displayed next to and correlated with the logic
analyzer’s execution trace acquisition. This requires you to be aware of
a number of issues.
Source File Search Path
Verify that the correct file search paths for the source code have been
entered into the source correlation tool set. The Agilent Technologies
B4620B Source Correlation Tool Set can often read and access the
correct source code file from information contained in the symbol file,
if the source code files have not been moved since they were compiled.
Network Access to Source Files
If source code files are being accessed across a network, the logic
analyzer networking must be compatible with the network
environment. Agilent Technologies logic analyzers currently support
Ethernet networks running a TCP/IP protocol and support ftp, telnet,
NFS client/server and X-Window client/server applications. Some PC
networks may require extensions to the normal LAN protocols to
support the TCP/IP protocol and/or these networking applications.
Contact your LAN administrator to help set up the logic analyzer on the
network.
Source File Version Control
If the source code files are under a source code or version control
utility, check the file names and paths carefully. These utilities can
change source code file paths and file names. If these names are
changed from the names in the symbol file, the source correlation tool
set will not be able to find the proper source code file. Version control
utilities usually provide an “export” command that creates a set of
source code files with unmodified names. The source correlation tool
set can then be given the correct path to these files.
Solutions for the Motorola 68360
117
Chapter 5: Symbols and Source Code in the Analyzer
Triggering on Symbols and Source Code
Triggering on Symbols and Source Code
When setting up trigger specifications to capture processor execution:
•
Use the logic analyzer trigger alignment to avoid missed triggers.
•
Use the logic analyzer address offset to compensate for relocated code.
•
Use the logic analyzer storage qualification to capture the software
execution you’re interested in and filter out library code execution (whose
source file lookups can take a long time if the library source code is not
available).
To avoid triggering on prefetched instructions
A CPU32+ microcontroller may prefetch one instruction following a
taken branch (BRx, JMP, JSR). The preprocessor does not filter these
prefetches. This means that the prefetched states will be collected by
the analyzer, and that a trigger set to the address of the prefetched
instruction will cause a false trigger on the prefetch.
The recommended way to avoid false triggering for a CPU32+ device
(32-bit data bus) in this case is to offset the address of the trigger by 4.
An offset field is provided in the symbolic trigger menu to allow
offsetting the symbol address.
Note that this is not a foolproof scheme, since this may result in an
inappropriate trigger if the offset address is a point where control
transfers (branch destination). Be aware of prefetches and adjust your
triggering to compensate for it as you gain experience with the
118
Solutions for the Motorola 68360
Chapter 5: Symbols and Source Code in the Analyzer
Triggering on Symbols and Source Code
processor and your code.
Example
A common example of this is setting a trigger on the source line
following a loop, for instance:
Line #
Addr
C source
====== ====== =====================
100
101
102
103
104
1000
1000
1002
1002
1002
1002
1008
1008
100A
1010
1012
1012
Assembly Source
==============================
for (i=0;i<10;i++)
MOVEQ
#0,D3
ADD.L
#100,D2
ADDQ.L
CMP.L
BLT
#1,D3
#10,D3
forLoop1
{
forLoop1:
foo = foo + 100;
}
printf("%d\n", foo);
-MOVEA.L D2,A0
The instruction at 1012 will be prefetched following the BLT at
address 1010. So, setting a trigger on line #104 (address 1012)
will result in a premature trigger.
To correlate relocatable code using the address
offset
You need to adjust the source correlation tool set to compensate for
relocatable code segments or memory management units that produce
fixed code offsets.
The offset field in the trigger menu allows you to offset the symbol
address. Entering the appropriate address offset will cause the source
correlation tool set to reference the correct symbol information for the
relocatable or offset code.
To adjust for prefetches, use a trigger offset of 4 (prefetch queue
depth) to avoid triggering on prefetched instructions. This is not a
foolproof scheme, since this may result in a missed trigger if a branch
takes place between the base address and the offset address. For the
CPU32+, an offset of 4 is large enough to overcome the prefetch queue.
Solutions for the Motorola 68360
119
Chapter 5: Symbols and Source Code in the Analyzer
Triggering on Symbols and Source Code
120
Solutions for the Motorola 68360
6
Connecting and Configuring the
Emulation Module
121
Chapter 6: Connecting and Configuring the Emulation Module
Connecting and Configuring the Emulation Module
Connecting and Configuring the Emulation
Module
This chapter shows you how to connect the emulation module to the
target system and how to configure the emulation module and target.
Here is a summary of the steps for connecting and configuring the
emulation module:
1 Make sure the target system is designed to work properly with
the emulation module. (page 128)
2 Install the emulation module in your logic analysis system, if
necessary. (page 132)
If you are connecting to an Agilent Technologies 16600A/700A-series
logic analysis system, use the Setup Assistant to guide you through
steps 3-6 (see page 21). Use this manual for additional information, if
desired.
3 Connect the emulation module to your target system using the
50-pin cable and the TIM or an analysis probe. (page 137)
4 Update the firmware of the emulation module, if necessary. (page
142)
5 Verify communication between the emulation module and the
target. (page 143)
6 Configure the emulation module. (page 144)
7 Test the connection between the emulation module and the
target. (page 155)
8 Connect a debugger to the emulation module, if applicable. (page
171.)
See Also
Chapter 8, “Using the Emulator with a Debugger,” beginning on page
171 for information on configuration with a debugger, and on
configuring LAN port numbers.
122
Solutions for the Motorola 68360
Chapter 6: Connecting and Configuring the Emulation Module
Using the Emulation Control Interface
Using the Emulation Control Interface
The Emulation Control Interface in your Agilent Technologies 16600A/
700A-series logic analysis system allows you to control an emulator (an
emulation module or an emulation probe).
As you set up the emulation module, you will use the Emulation
Control Interface to:
•
Update firmware (which reloads or changes the processor-specific
personality of the emulator).
•
Change the LAN port assignment (rarely necessary).
•
Run performance verification tests on the emulator.
The Emulation Control Interface allows you to:
•
Run, break, reset, and step the target processor.
•
Set and clear breakpoints.
•
Read and write registers.
•
Read and write memory.
•
Read and write I/O memory.
•
View memory in mnemonic form.
•
Read and write the emulator configuration.
•
Download programs (in Motorola S-Record or Intel Hex format) to the
target system RAM or ROM.
•
View emulator status and errors.
•
Write and play back emulator command script files.
If you have an emulation probe, this interface also allows you to
configure the LAN address of the emulation probe.
Using the logic analysis system’s intermodule bus does not require the
Emulation Control Interface to be running. If the emulation module
icon is in the Intermodule window, then it will be able to send and
receive signals. Therefore if you are using a debugger, you can use an
Solutions for the Motorola 68360
123
Chapter 6: Connecting and Configuring the Emulation Module
Using the Emulation Control Interface
analyzer to cause a break.
Using a debugger with the Emulation Control Interface is not
recommended because:
See Also
•
The interfaces can get out of synchronization when commands are issued
from both interfaces. This causes windows to be out-of-date and can cause
confusion.
•
Most debuggers cannot tolerate another interface issuing commands and
may not start properly if another interface is running.
All of the Emulation Control Interface windows provide online help
with a Help button or a Help➞On this window menu selection. Refer
to the online help for complete details about how to use a particular
window.
124
Solutions for the Motorola 68360
Chapter 6: Connecting and Configuring the Emulation Module
Using the Emulation Control Interface
To start the Emulation Control Interface from
the main System window
1 In the System window, click the emulation module icon.
2 Select Start Session....
To start the Emulation Control Interface from
the Workspace window
1 Open the Workspace window.
2 Drag the Emulator icon onto the workspace.
Solutions for the Motorola 68360
125
Chapter 6: Connecting and Configuring the Emulation Module
Using the Emulation Control Interface
3 Right-click on the Emulator icon, then select Start Session....
126
Solutions for the Motorola 68360
Chapter 6: Connecting and Configuring the Emulation Module
Using the Emulation Control Interface
To start the Emulation Control Interface from
the Workspace window for an emulation probe
If you have a stand-alone emulation probe connected to the logic
analysis system via LAN, use the Emulation Probe icon instead of the
Emulator icon.
1 Open the Workspace window.
2 Drag the Emulation Probe icon onto the workspace.
3 Right-click on the Emulation Probe icon, then select Start
Session....
4 In the Session window, enter the IP address or LAN name of the
emulation probe, then click Start Session.
Solutions for the Motorola 68360
127
Chapter 6: Connecting and Configuring the Emulation Module
Designing a Target System for the Emulation Module
Designing a Target System for the Emulation
Module
Debug port connections
If you plan to connect the emulation module directly to the target
system, the target system should have a debug port (BDM) connector.
The connector should be a dual row header strip (“Berg connector”),
10 pins per inch, with 25 mil pins.
Some of the signals at the BDM port share the same lines, as shown in
the diagrams on the following pages.
When deciding whether to use an 8-pin or a 10-pin BDM port, consider
how often you are likely to encounter "hung" bus cycles. If you are
using an 8-pin BDM port, and a target bus cycle fails to terminate, you
will need to reset the target system. If you use a 10-pin BDM port, the
emulator will detect and terminate the "hung" cycle.
Therefore if your target system does not have a good bus monitor, or if
you are not using the built-in bus monitor, you should use a 10-pin
BDM port to take advantage of the DS and BERR signals.
The emulation module adds about 40 pF to all target system signals
routed to the debug connector. This added capacitance may reduce the
rise time of some signals beyond the processor specifications. If so, the
target may need to increase the pull-up current on these signal lines.
128
Solutions for the Motorola 68360
Chapter 6: Connecting and Configuring the Emulation Module
Designing a Target System for the Emulation Module
The following signals should be available at the BDM port:
BDM signal definitions
Mnemonic
Name
Direction
Signal Description
GND
Ground
BKPT
Breakpoint
Input
(to target)
Signals a hardware breakpoint. Also used to
place the CPU32 in background debug mode.
Active low
DSCLK
Development
system clock
Input
Serial input clock
FREEZE
Freeze
Output
Indicates BDM mode
QUOT
Quotient out
Output
Quotient bit of the polynomial divider. Not used in
BDM mode.
RESET
Reset
Output
Indicates system reset
IFETCH
Instruction fetch
Output
Indicates when the CPU is performing an
instruction word prefetch and when the
instruction pipeline has been flushed (active low)
DSI
Development
serial in
Input
BDM data input
Output
Target power (+5 V or +3.3 V)
VDD
IPIPE
Instruction pipe
Output
Used to track the movement of words through the
instruction pipeline (active low)
DSO
Development
serial out
Output
BDM data output
DS
Data strobe
Output
During read, indicates ready to receive valid data;
during write
BERR
Bus error
Input
Used to terminate target memory cycles (optional)
Solutions for the Motorola 68360
129
Chapter 6: Connecting and Configuring the Emulation Module
Designing a Target System for the Emulation Module
8-pin BDM port
An 8-pin BDM port should be a dual row header strip ("Berg
connector"), 4 pins per row, 10 pins per inch, with 25 mil pins. If you
plan to use the 10-pin cable, use a header with 2 rows of 5 pins.
If you plan to make an 8-pin cable, you should use the following pin
assignments for the BDM port:
10-pin BDM port
If you plan to use the provided 10-pin cable, you should use the
following pin assignments for the BDM port:
Target VDD
The emulator may draw up to 10 mA from target VDD.
See page 235 for more information on current and voltage
requirements.
130
Solutions for the Motorola 68360
Chapter 6: Connecting and Configuring the Emulation Module
Designing a Target System for the Emulation Module
CONFIG2 pin
The CONFIG2 pin on CPU32+ processors shares a pin with the
processor FREEZE output. The processor probe can pull this line down
and cause the CPU32+ to power up in Slave Mode with the internal
CPU disabled. To ensure that CONFIG2 is high at reset, the target
should supply sufficient pullup current to drive the FREEZE input on
the processor probe. Loading for the FREEZE pin (and all BDM pins) is
described in “Emulation module—electrical characteristics” on
page 235.
Enabling BDM
Your target system does not need to enable background debug mode.
If the emulator is connected before you turn on the target system, the
emulator will enable BDM.
If you connect the emulator after you turn on the target system, the
emulator will enable BDM when the target is reset.
Solutions for the Motorola 68360
131
Chapter 6: Connecting and Configuring the Emulation Module
Installing the Emulation Module
Installing the Emulation Module
Your emulation module may already be installed in your logic analysis
system. If you need to install an emulation module yourself, follow the
instructions on the pages which follow.
CAUTION:
These instructions are for trained service personnel. To avoid dangerous
electric shock, do not perform any service unless qualified to do so. Do not
attempt internal service or adjustment unless another person, capable of
rendering first aid and resuscitation, is present.
Electrostatic discharge can damage electronic components. Use grounded
wrist straps and mats when you handle modules.
132
Solutions for the Motorola 68360
Chapter 6: Connecting and Configuring the Emulation Module
Installing the Emulation Module
To install the emulation module in a 16700Aseries logic analysis system or a 16701A
expansion frame
You will need T-10 and T-15 Torx screw drivers (supplied with the
module).
1 Turn off the logic analysis system and REMOVE THE POWER
CORD.
Remove any other cables (including mouse or video monitor cables).
2 Turn the logic analysis system frame upside-down.
3 Remove the bottom cover.
4 Remove the slot cover.
You may use either slot.
Solutions for the Motorola 68360
133
Chapter 6: Connecting and Configuring the Emulation Module
Installing the Emulation Module
5 Install the emulation module.
6 Connect the cable and re-install the screws.
You may connect the cable to either of the two connectors. If you have
two emulation modules, note that many debuggers will work only with
the “first” module: the one toward the top of the frame (“Slot 1”),
plugged into the connector nearest the back of the frame.
7 Reinstall the bottom cover, then turn the frame right-side-up.
8 Plug in the power cord, reconnect the other cables, and turn on
the logic analysis system.
The new emulation module will be shown in the system window.
See Also
See page 142 for information on giving the emulation module a
“personality” for your target processor.
134
Solutions for the Motorola 68360
Chapter 6: Connecting and Configuring the Emulation Module
Installing the Emulation Module
To install the emulation module in a 16600Aseries logic analysis system
You will need T-8, T-10, and T-15 Torx screw drivers (supplied with the
emulation module).
1 Turn off the logic analysis system and REMOVE THE POWER
CORD.
Remove any other cables (such as probes, mouse, or video monitor).
2 Slide the cover back.
3 Remove the slot cover.
Solutions for the Motorola 68360
135
Chapter 6: Connecting and Configuring the Emulation Module
Installing the Emulation Module
4 Install the emulation module.
5 Connect the cable and re-install the screws.
6 Reinstall the cover.
Tighten the screws snugly ( 2 N·m or 18 inch-pounds).
7 Plug in the power cord, reconnect the other cables, and turn on
the logic analysis system.
The new emulation module will be shown in the system window.
See Also
See page 142 for information on giving the emulation module a
“personality” for your target processor.
To test the emulation module
If this is the first time that you have used the emulation module, you
should run the built-in performance verification test before you
connect to a target system. Refer to page 276 for information on
performance verification.
136
Solutions for the Motorola 68360
Chapter 6: Connecting and Configuring the Emulation Module
Connecting the Emulation Module to the Target System
Connecting the Emulation Module to the Target
System
Choose one of the following methods for connecting the emulation
module to a target system.
•
Directly through a debug port connector on the target board.
•
Through an Agilent Technologies E2448A analysis probe, which provides a
direct connection to the debug port pins.
Solutions for the Motorola 68360
137
Chapter 6: Connecting and Configuring the Emulation Module
Connecting the Emulation Module to the Target System
After you have connected the emulation module to your target system,
you may need to update the firmware in the emulation module.
See Also
For information on designing a debug port on your target board, see
page 128.
For a list of the parts supplied with the emulation module, see page 27.
To connect to a target system using a 10-pin
debug port
The emulator can be connected to a target system through a 10-pin
debug port (BDM connector).
The emulator should be connected to the target system using the 10conductor cable assembly provided.
In order to connect the emulator to the microcontroller, a 10-pin male
2x5 header connector must be available on the target system.
1 Remove power from the target system and the emulator.
2 Plug one end of the 50-pin cable into the emulator.
3 Plug the other end of the 50-pin cable into the target interface
module.
4 Plug one end of the 10-pin cable into the target interface module.
5 Plug the other end of the 10-pin cable into the target system.
Orient the red wire toward pin 1 of the connector.
138
Solutions for the Motorola 68360
Chapter 6: Connecting and Configuring the Emulation Module
Connecting the Emulation Module to the Target System
CAUTION:
Be careful to orient the connector as shown below. If the connector is rotated,
your target system or the emulation module may be damaged.
6 Turn on the power to the logic analysis system, then turn on the
power to the target system.
See Also
“Designing a Target System for the Emulation Module” on page 128.
To connect to a target system via an 8-pin
debug port
1 Remove power from the target system and the emulator.
2 Plug one end of the 50-pin cable into the emulator.
3 Plug the other end of the 50-pin cable into the target interface
module.
Solutions for the Motorola 68360
139
Chapter 6: Connecting and Configuring the Emulation Module
Connecting the Emulation Module to the Target System
4 Plug one end of the 10-pin cable into the target interface module.
5 Plug the other end of the 10-pin cable into the target system.
Orient the red wire toward pin 1 of the connector. Pins 1 and 2 of the
cable should be the ones which are not connected. Connect pin 3 of the
cable to pin 1 of the target connector.
CAUTION:
Be careful to orient the connector as shown below. If the connector is rotated,
your target system or the emulator may be damaged.
6 Turn on the power to the logic analysis system, then turn on the
power to the target system.
See Also
“Designing a Target System for the Emulation Module” on page 128.
140
Solutions for the Motorola 68360
Chapter 6: Connecting and Configuring the Emulation Module
Connecting the Emulation Module to the Target System
To connect to a target system using an analysis
probe
1 Remove power from the target system.
2 Plug one end of the 50-pin cable into the emulation module. The
connectors are keyed.
3 Plug the other end of the 50-pin cable into the connector on the
analysis probe.
Solutions for the Motorola 68360
141
Chapter 6: Connecting and Configuring the Emulation Module
To update firmware
To update firmware
After you have connected the emulation module to your target system,
you may need to update the firmware to give it the right “personality”
for your processor. You must update the firmware if:
•
•
•
The emulation module is being connected to a new analysis probe or TIM,
or
The emulation module was not shipped already installed in the logic
analysis system, or
You have an updated version of the firmware from Agilent Technologies.
To update the firmware:
1 End any run control sessions which may be running.
2 In the Workspace window, remove any Emulator icons from the
workspace.
3 Install the firmware onto the logic analysis system’s hard disk, if
necessary.
4 In the system window, click the emulation module and select
Update Firmware.
5 In the Update Firmware window, select the firmware version to
load into the emulation module.
6 Click Update Firmware.
In about 20 seconds, the firmware will be installed and the screen will
update to show the current firmware version.
See Also
Chapter 2, “Installing Software,” beginning on page 31, for instructions
on how to install the firmware files on the hard disk.
142
Solutions for the Motorola 68360
Chapter 6: Connecting and Configuring the Emulation Module
To update firmware
To display current firmware version
information
•
In the Update Firmware window, click Display Current Version.
There are usually two firmware version numbers: one for “Generics” and
one for the personality of your processor.
To verify communication between the
emulator and target system
1 Turn on the target system.
2 Start the Emulation Control Interface.
If the electrical connections are correct, and if the emulator firmware
and analysis probe or TIM match your target processor, the Run
Control window should be displayed:
Solutions for the Motorola 68360
143
Chapter 6: Connecting and Configuring the Emulation Module
Configuring the Emulation Module
Configuring the Emulation Module
The emulation module has several user-configurable options. These
options may be customized for specific target systems and saved in
configuration files for future use.
The easiest way to configure the emulation module is through the
Emulation Control Interface in an Agilent Technologies 16600A or
16700A logic analysis system.
If you use the Emulation Control Interface, please refer to the online
help in the Configuration window for information on each of the
configuration options.
Other ways to configure the emulation module are by using:
•
•
the emulation module’s built-in terminal interface
your debugger, if it provides an “emulator configuration” window which
can be used with this Agilent Technologies emulation module
What can be configured
The following options can be configured using the Emulation Control
Interface or using built-in commands:
•
•
•
Processor type.
Processor clock speed.
Initial values for internal registers (see Chapter 7, “Using Internal
Registers (SIM and EMSIM Registers),” beginning on page 157).
The following option can be configured using built-in commands:
•
Restriction to real-time runs.
The built-in “help cf” command also lists the following options, which
are provided only for compatibility with stand-alone emulation probes:
•
•
144
BNC break in behavior.
BNC trigger out behavior.
Solutions for the Motorola 68360
Chapter 6: Connecting and Configuring the Emulation Module
Configuring the Emulation Module
To configure using the Emulation Control
Interface
The easiest way to configure the emulation module is to use the
Emulation Control Interface.
1 Start an Emulation Control Interface session.
In the system window, click the Emulation Control Interface icon, and
then select Start Session....
2 Open a Configuration window.
Select Configuration... from the Emulation Control Interface icon or
from the Navigate menu in any Emulation Control Interface window.
3 Set the configuration options, as needed.
Configuration changes will take effect when you close the configuration
window or when you move the mouse pointer outside the window.
4 Save the configuration settings.
To save the configuration settings, open the File Manager window and
click Save....
Solutions for the Motorola 68360
145
Chapter 6: Connecting and Configuring the Emulation Module
Configuring the Emulation Module
See Also
Help➞Help on this window in the Configuration window for
information on each of the configuration options.
Help in the Emulation Control Interface menu for help on starting an
Emulation Control session.
To configure using the built-in commands
If you are unable to configure the emulation module with the
Emulation Control Interface or a debugger interface, you can configure
the emulation module using the built-in “terminal interface”
commands.
1 Connect a telnet session to the emulation module over the LAN.
For example, on a UNIX system, for an emulation module in Slot 1
enter:
telnet LAN_address 6472
2 Enter cf to see the current configuration settings.
3 Use the cf command to change the configuration settings.
See Also
Enter help cf for help on the configuration commands.
For information on connecting using telnet, and for information on
other built-in commands, see page 269.
146
Solutions for the Motorola 68360
Chapter 6: Connecting and Configuring the Emulation Module
Configuring the Emulation Module
Example
To see a complete list of configuration items, type help cf. This
command displays:
M>help cf
cf - display or set emulation configuration
cf
- display current settings for all config items
cf <item>
- display current setting for specified <item>
cf <item>=<value> - set new <value> for specified <item>
cf <item> <item>=<value> <item> - set and display can be combined
help cf <item>
- display long help for specified <item>
--- VALID CONFIGURATION <item> NAMES --proc
- Set type of CPU16/32 Processor
procck
- Set Clock Speed of Processor
dprocck - Display Default Clock Speed of Processor
rrt
- Enable or Disable Restriction to Real-Time Runs
breakin - Select BNC break input option
trigout - Select BNC trigger output option
M>
To configure using a debugger
Because the Agilent Technologies emulation module can be used with
several third-party debuggers, specific details for sending the
configuration commands from the debugger to the emulation module
cannot be given here. However, all debuggers should provide a way of
directly entering terminal mode commands to the emulation module.
Ideally, you would create a file that contains the modified configuration
entries to be sent to the emulation module at the beginning of each
debugger session.
See Also
Information about specific debuggers in Chapter 8, “Using the
Emulator with a Debugger,” beginning on page 171.
Your debugger manual.
Solutions for the Motorola 68360
147
Chapter 6: Connecting and Configuring the Emulation Module
Configuring the Emulation Module
To configure the processor type
Processor type configuration
Value
Built-in command
Notes
CPU32 Processor Types
68330
68331
68332
68333
68334
68335
68336
68338
68340
68341
68349
68360
68376
683xx
cf
cf
cf
cf
cf
cf
cf
cf
cf
cf
cf
cf
cf
cf
proc=68330
proc=68331
proc=68332
proc=68333
proc=68334
proc=68335
proc=68336
proc=68338
proc=68340
proc=68341
proc=68349
proc=68360
proc=68376
proc=683xx
Use for other CPU32 processors
CPU16 Processor Types
68hc16z1
68hc16z2
68hc16y1
cf proc=68hc16z1
cf proc=68hc16z2
cf proc=68hc16y1
The cfsave -s command will store this configuration in the
emulation module’s flash memory. The cfsave -r command will
restore this configuration.
If you are using a processor in your target that is not listed as a choice,
the emulator can provide direct access to all the registers defined in
the CPU32 architecture programming model but will not have direct
access to memory mapped registers in the processor’s internal
modules.
If you are using a processor that is listed as a choice, the emulator will
have knowledge of on-chip peripheral registers and SIM registers and
148
Solutions for the Motorola 68360
Chapter 6: Connecting and Configuring the Emulation Module
Configuring the Emulation Module
will allow display and modification from the user interface. For
example, when 68332 is selected as the processor type, the interface
will support direct access to the SIM, the QSM, the TPU, and the
TPURAM registers.
The emulator does not have explicit support for all CPU32 processors.
When using a member of the CPU32 family that is not explicitly
supported it may be possible to select a processor that is a formal
subset of the unsupported processor. This will provide direct access to
all of the internal memory mapped registers that are common. Since
the registers in the internal modules are memory mapped, registers in
unsupported CPU32 processors are also accessible through the
memory commands. For example, on a 68332, SIM registers can be
accessed at memory locations 7FFA00 to 7FFA7F or FFFA00 to
FFFA7F.
To configure the processor clock speed (BDM
communication speed)
The maximum communication rate with the target processor through
the BDM port is based upon the target processor type and the target
processor clock speed.
For best performance, set the processor clock speed to the highest
speed that is equal to or less than the clock speed of the target
processor. You may set the processor clock speed to a speed lower than
the actual clock speed of your target system. Use the 25 MHz option for
microcontrollers running faster than 25 MHz.
If using the internal clock synthesizer, set the EMSYNCR (EMulator
copy of the SYNthesizer Control Register, SYNCR) to the same value as
set by the initialization code. See Chapter 7, “Using Internal Registers
(SIM and EMSIM Registers),” beginning on page 157.
Solutions for the Motorola 68360
149
Chapter 6: Connecting and Configuring the Emulation Module
Configuring the Emulation Module
Processor clock speed configuration
Value
Processor clock
is at least
33
33 MHz
cf procck=33
25
25 MHz
cf procck=25
20
20 MHz
cf procck=20
16
16 MHz
cf procck=16
8
8 MHz (default)
cf procck=8
4
4 MHz
cf procck=4
2
2 MHz
cf procck=2
1
1 MHz
cf procck=1
512
512 kHz
cf procck=512
32
32 kHz
cf procck=32
Built-in command
Use the cf dprocck command to display the default clock speed.
To set the default clock rate if the processor
clock rate is less than 8 MHz
For an emulation module, the default clock rate must be set using the
Emulation Control Interface.
1 End any Emulation Control Interface session for the emulation
module.
2 Right-click the Emulation Control Interface icon and select
Update Firmware....
3 Click Modify Lan Port....
150
Solutions for the Motorola 68360
Chapter 6: Connecting and Configuring the Emulation Module
Configuring the Emulation Module
4 Select the clock rate.
5 Click Apply, then click Close.
If a target system’s processor clock rate is less than 8 MHz following
powerup, the default clock rate must be set to 131 kHz.
This can occur when the target system has the processor running off of
an external clock source that is less than 8 MHz or is using the clock
synthesizer with a crystal that is lower in frequency that the standard
crystal.
The actual processor clock rate should then be communicated to the
emulator through the configuration processor clock rate entry. The
emulator will then start communications with the target processor at
the 131 kHz processor clock rate. When the configuration process is
complete, the emulator will change the communication rate to a rate
based on the clock speed (procck).
The emulator will not communicate correctly with target systems that
have a processor clock rate slower than 131 kHz.
Note
The emulator does not automatically match the communication
speed to the actual target speed (SYNCR register). Maintaining
consistency is the responsibility of the user.
To maintain consistency, specify a correct SYNCR register value in
the configuration process and make sure that the target code does
not change the SYNCR register to a value that is slower than what
is specified in the configuration.
The emulator will not run correctly if the actual target
processor clock rate is slower than the rate specified in the
configuration.
Solutions for the Motorola 68360
151
Chapter 6: Connecting and Configuring the Emulation Module
Configuring the Emulation Module
Detailed information about processor clock
rates
Most target systems will communicate with the emulator properly and
with excellent performance following the basic guidelines given in the
preceding sections. In some target systems, the setting of this
parameter requires greater knowledge of the actual clock generation
model.
The CPU32 family has two major use models for the processor clock
rate which can be used to support the majority of target systems. When
using the internal clock synthesizer, the processor will run from reset
at a Motorola defined default clock rate which, when using the
Motorola recommended crystal is usually 8.38 MHz or 1/2 of the
maximum clock rate of the processor. The programmer’s initialization
code then programs the clock synthesizer to run at the desired clock
rate which is usually higher than the default. The second model uses an
external clock source to directly control the processor clock rate. The
emulator directly supports both processor clock rate models. Users
that use a different clock rate model can examine the support of these
models to determine the correct settings for supporting their processor
clock rate.
The emulator supports the use model of the target processor clock rate
being increased through the configuration. When applying the
configuration at the start of a user interface or through the
configuration process, the emulator communicates with the target
processor at a rate based on the default processor clock rate (either 8
MHz or 131 kHz). At this default rate, it copies the EMSYNCR
(EMulator copy of the SYNthesizer Control Register) to the SYNCR
(SYNthesizer Control Register). The emulator then changes its
communications rate to the maximum rate that the processor clock
rate specified in the configuration can support.
Resetting the target processor also resets the SYNCR to its default
value. If the target processor is reset while running user code (as
opposed to putting the processor in a reset state from the interface),
no communications rate change takes place within the emulator. The
152
Solutions for the Motorola 68360
Chapter 6: Connecting and Configuring the Emulation Module
Configuring the Emulation Module
initialization code that runs on the target system from reset is required
to set the SYNCR to the correct value.
When the target processor clock rate is fixed through the use of an
external clock source, the Processor Clock Rate parameter can be set
to the highest rate that is equal to or less than the target clock rate.
There are no dependencies upon any other configuration parameters.
When the target system is using the internal clock synthesizer to
increase the final clock rate but the user leaves the emulator at the
default processor type (683xx) the EMSYNCR is not available to the
configuration process. The powerup default clock rate for the target
system can be entered into the "Processor Clock Rate". This is a
failsafe setting but can limit the emulator performance if the target
processor is programmed to run at a significantly faster rate than the
powerup default.
If the user desires the higher performance available by setting the
"Processor Clock Rate" configuration parameter to his final value but
does not set his processor type (which means that the configuration
process cannot set the SYNCR) the debugger interface will have a
number of failures when invoked because it cannot communicate
accurately with the target processor. These will show up as either
dashes or bad values in the source, backtrace, and memory windows.
These errors can be cleared up if the target system can support a "run
from reset" with code in the target system that initializes the target
SYNCR register. Following the target initializing this register, a break
can be requested and the emulator will communicate correctly with the
target. Until the emulator and the target system are running at
compatible rates, operations such as "run," "load," "modify memory/
registers," or "display memory/registers" will either fail or give incorrect
information.
If the user loses communication between the emulator and the target
system because of incompatible clock rates, control of the target
processor through the emulator can be recovered by applying the
configuration to the emulator with the target processor clock rate set
to a known good value.
Solutions for the Motorola 68360
153
Chapter 6: Connecting and Configuring the Emulation Module
Configuring the Emulation Module
To configure restriction to real-time runs
Real-time runs configuration
Built-in
command
Value
Emulation module configuration
no
Allows commands which break to the
monitor. Examples include commands
which display memory or registers.
(Default)
cf rrt=no
yes
No commands are allowed which
break to the monitor, except “break,”
“reset,” “run,” or “step.”
cf rrt=yes
154
Solutions for the Motorola 68360
Chapter 6: Connecting and Configuring the Emulation Module
Testing the emulator and target system
Testing the emulator and target system
After you have connected and configured the emulator, you should
perform some simple tests to verify that everything is working.
See Also
Chapter 13, “Troubleshooting the Emulation Module,” beginning on
page 265, for information on testing the emulator hardware.
To test memory accesses
1 Start the Emulation Control Interface and configure the
emulator, if necessary.
2 Open the Memory window.
3 Write individual locations or fill blocks of memory with patterns
of your choosing.
The access size is the size of memory access that will be used to write
or read the memory values.
4 Use the Memory I/O window to stimulate I/O locations by reading
and writing individual memory locations.
To test with a running program
To more fully test your target, you can load simple programs and
execute them.
1 Compile or assemble a small program and store it in a Motorola SRecord or Intel Hex file.
2 Use the Load Executable window to download the program into
Solutions for the Motorola 68360
155
Chapter 6: Connecting and Configuring the Emulation Module
Testing the emulator and target system
RAM or flash memory.
3 Use the Breakpoints window to set breakpoints. Use the
Registers window to initialize register values.
The new register or breakpoint values are sent to the processor when
you press the Enter key or when you move the cursor out of the
selected register field.
4 In the Run Control window, click Run.
5 Use the Memory Mnemonic window to view the program and use
the Memory window to view any output which has been written
to memory.
156
Solutions for the Motorola 68360
7
Using Internal Registers (SIM and
EMSIM Registers)
157
Chapter 7: Using Internal Registers (SIM and EMSIM Registers)
Internal Registers (SIM and EMSIM Registers)
Internal Registers (SIM and EMSIM Registers)
The purpose of SIM Registers
The CPU32 family of processors provides a variety of internal
peripheral and memory modules that are directly connected to the
CPU32 core through an internal bus. These modules are configured
through memory mapped register banks. The base address of the
register banks as well as the base address of internal memory modules
are established through Module Configuration Registers (e.g. MCR)
and Base Address Registers (e.g. BRx). A common module throughout
the family is a System Integration Module (SIM) which controls such
things as clock speed and external chip selects.
The purpose of EMSIM registers
The emulator maintains a set of pseudo registers known as EMSIM
registers. There is a one to one correspondence between the EMSIM
registers and the target SIM registers. The purpose of the EMSIM
registers is to provide a stable, known set of registers that can be
copied into the SIM to establish an initial SIM state or re-establish a
previous known state. This is useful because it allows emulator to
communicate with a target without first running initialization code to
set up the chip select registers.
The names and values of the EMSIM registers are displayed in the
Configuration window of the Emulation Control Interface. The SIM
registers can be viewed in the Registers window.
Note
The emulator supports configuration of the internal registers in the System
Integration Module (SIM) and other important Module Configuration Registers
and Base Address Registers. To simplify the interface, all configurable registers
will be referred to as SIM registers even if they are technically part of another
module.
158
Solutions for the Motorola 68360
Chapter 7: Using Internal Registers (SIM and EMSIM Registers)
Configuring the SIM Registers
Configuring the SIM Registers
Summary
If you have a boot ROM that initializes the SIM registers, you don’t have
to configure the EMSIM registers in order to load code and run your
target. It is a good idea to configure the EMSIM registers anyway, since
the EMSIM registers are used configure an analysis probe. Page 161
discusses how to copy the SIM registers into the EMSIM registers.
If you do not have a boot ROM, then you will need to initialize the
EMSIM registers first so that you can communicate with the memory of
the processor. Once the EMSIM registers are defined, then every reset
followed by a break will write the EMSIM registers to the processor’s
SIM registers.
Once you have configured the EMSIM registers, it is a good idea to save
a configuration. Loading the configuration will restore the values of all
configuration options, including the EMSIM registers.
How SIM Register Values are Set
These registers are typically initialized by the CPU32 executing the
reset initialization code. During development this code may not be
available or may not exist on the target system. To aid in development,
the most important of these registers can be set directly by the
emulator. This enables such functions as clock speed, chip selects, and
location of internal memory to be established prior to executing any
user code. Once these registers are set, resources in the target system
can be accessed in the same manner as the processor would access
them after executing the reset initialization code. Activities such as
downloading code into the target system can now be performed
through the emulator.
The emulator copy is identified by the prefix "EM" on the register name
(e.g. EMSYNCR is the emulator copy of the SYNCR register) and are
referred to as the EMSIM. The EMSIM registers are transferred to the
processor registers when the target processor is reset while it is
running in the BDM monitor.
Solutions for the Motorola 68360
159
Chapter 7: Using Internal Registers (SIM and EMSIM Registers)
Configuring the SIM Registers
Based on the previous discussion, it should be clear that the EMSIM
values specified during configuration need to match the intended
programming and of use of your CPU32 target system. You need to
carefully decide how the processor will be configured and the
corresponding SIM values.
The effect of processor type on the EMSIM
registers
EMSIM registers are valid only if the emulator has been configured
with a target processor name other than 683xx. If the processor is
683xx, the emulator does not know what type of SIM exists in the
target and will not display correct values for the SIM registers.
Using the Emulation Control Interface or built-in
commands
If you are using the logic analysis system’s Emulation Control Interface,
you should use the Emulation Control Interface to work with SIM and
EMSIM registers.
If you are using a debugger, use a telnet window or your debugger’s
“emulator command” window to enter the emulator’s built-in
commands.
See Also
See “Emulation Module Built-in Commands” on page 269 for more
information on how to use built-in commands.
160
Solutions for the Motorola 68360
Chapter 7: Using Internal Registers (SIM and EMSIM Registers)
Configuring EMSIM Register Values
Configuring EMSIM Register Values
There are two methods you can use to configure EMSIM register
values:
•
Copy values from the SIMs into the EMSIM registers, or
•
Manually define each of the EMSIM values.
This will not change the value of the SIM registers.
To copy target SIM registers to EMSIM
registers
If you have initialization code that properly defines the SIMs, you can
copy your values of the SIMs into the EMSIM registers. Then you can
save the EMSIM values in a configuration file.
Using the Emulation Control Interface:
• In the Configuration window, click the Read Configuration
button.
Using the emulator’s built-in commands:
• Enter the sync sim command.
To manually define EMSIM values
Using the Emulation Control Interface:
1 Open the Configuration window.
2 Enter the values for the registers.
Solutions for the Motorola 68360
161
Chapter 7: Using Internal Registers (SIM and EMSIM Registers)
Configuring EMSIM Register Values
3 Open the Workspace window and select File➞Save
Configuration....
The EMSIM values will be saved as part of the configuration. This
allows you to restore the EMSIM values by loading the configuration.
162
Solutions for the Motorola 68360
Chapter 7: Using Internal Registers (SIM and EMSIM Registers)
Configuring SIM Register Values
Configuring SIM Register Values
There are three ways to configure the values of the SIM registers:
•
Using code in your target’s boot ROM, or
•
Copying values from the EMSIM registers into the SIM registers, or
•
Manually entering the value of each SIM register using the Emulation
Control Interface
Some registers can only be written once after processor reset.
If you set the EMSIM values, then reset and break, the EMSIM values will be
written to the SIM registers. If your initialization code then attempts to write to
one of the "write once after reset" registers, the writes will fail. In this case, you
must run from reset to correctly execute the initialization code.
To copy EMSIM registers to target SIM
registers
You can copy values from the EMSIM registers into the SIM registers in
three ways:
Using the Emulation Control Interface:
• In the Configuration window, click the Load Configuration
button.
Using the emulator’s built-in commands:
• Enter the sync emsim command.
By resetting the target:
1 Reset the target processor.
Solutions for the Motorola 68360
163
Chapter 7: Using Internal Registers (SIM and EMSIM Registers)
Configuring SIM Register Values
2 Break the target processor.
Some registers can only be written once after processor reset.
If you set the EMSIM values, then reset and break, the EMSIM values will be
written to the SIM registers. If your initialization code then attempts to write to
one of the "write once after reset" registers, the writes will fail. In this case, you
must run from reset to correctly execute the initialization code.
To manually define SIM values
Using the Emulation Control Interface:
1 Open the Registers window.
2 Enter the values for the registers.
Once you have entered the values, it is a good idea to copy the SIM
values to the EMSIM registers and save a configuration. Then you will
be able to reload the SIM registers without typing all the values again:
3 In the Configuration window, click the Read Configuration
button.
4 Open the Workspace window and select File➞Save
Configuration....
164
Solutions for the Motorola 68360
Chapter 7: Using Internal Registers (SIM and EMSIM Registers)
Saving and Loading EMSIM Values
Saving and Loading EMSIM Values
You can use the Emulation Control Interface to save the EMSIM values
to a configuration file then to restore the EMSIM values.
The configuration file contains more than just the EMSIM values.
When you load the configuration, the whole emulator configuration will be
restored, including all configuration settings, and the locations of windows.
Intermodule measurement configurations will be lost (unless you save and
restore with the Source set to All).
To save EMSIM values in a configuration file
1 Open the Workspace window and select File➞Save
Configuration....
2 Set the Source field to the emulator (for example, Motorola
CPU16/32 BDM Emulator (Slot 1)).
3 Select a file name and click Save.
To load EMSIM values from a configuration file
Once you have saved the configuration, you can specify the saved
configuration file and have your EMSIMs set up to the proper values.
1 Open the Workspace window and select File➞Load
Configuration....
2 Set the Source field to the emulator (for example, Motorola
CPU16/32 BDM Emulator (Slot 1)).
Solutions for the Motorola 68360
165
Chapter 7: Using Internal Registers (SIM and EMSIM Registers)
Saving and Loading EMSIM Values
3 Select a file name and click Load.
This will not change the SIM registers. To apply the new values to the
corresponding SIM registers, see “To copy EMSIM registers to target
SIM registers” on page 163.
166
Solutions for the Motorola 68360
Chapter 7: Using Internal Registers (SIM and EMSIM Registers)
Configuring SIM and EMSIM Values Using Built-In Commands
Configuring SIM and EMSIM Values Using BuiltIn Commands
To compare SIM and EMSIM registers
Target SIM registers may compared to the EMSIM to determine if they
have changed. The only way to do this is with a built-in command:
• Enter the sync diff command.
This will display the differences between the SIM and EMSIM register
sets.
The emulator, when comparing SIM and EMSIM registers, will not compare
EMSIM registers that have not been set.
When you first turn on the emulator and the target system, sync diff will not
find any differences. If one register is modified, just that one register may show
differences. A complete check of the register differences will occur only if a
complete configuration is loaded or the SIM registers are copied to the EMSIM
registers.
Solutions for the Motorola 68360
167
Chapter 7: Using Internal Registers (SIM and EMSIM Registers)
Configuring SIM and EMSIM Values Using Built-In Commands
Summary of EMSIM-related built-in commands
See Also
Command
Meaning
sync sim
Copy values from SIM registers to EMSIM registers
sync emsim
Copy values from EMSIM registers to SIM registers
sync diff
Display differences between SIM and EMSIM registers
reset
break
Reset, break, and copy values from EMSIM registers to SIM
registers
Use the help sync command to display help for these commands.
See “Emulation Module Built-in Commands” on page 269 for more
information on how to use built-in commands.
168
Solutions for the Motorola 68360
Chapter 7: Using Internal Registers (SIM and EMSIM Registers)
Internal Representation of SIM and EMSIM Registers
Internal Representation of SIM and EMSIM
Registers
Internal to the emulator the EMSIM and SIM memory spaces are
accessed using memory suffixes of the form offset@emsim and
offset@reg. All memory mapped registers in the 683xx family are
contained within a contiguous 4k block of memory (8k for the 68360).
The base address is determined by the SIM MCR MM bit in the 6833x or
the MBAR in the 68340 and 68360 processors. The internal
representation within the emulator of these registers is maintained as
an offset to the memory mapped register base. Referencing memory as
offset@emsim will access a SIM copy value in the EMSIM. Referencing
offset@reg will access a register within the processor. For example, on
a 68332 the memory address 00a00@emsim will access the EMSIM
MCR and 0a00@reg will access the SIM MCR. The memory address
0@reg within a 68340 will access its SIM MCR.
The command used to compare the values with the EMSIM and SIM
will result in memory references using this notation. For example
suppose the command is given to compare the SIM and EMSIM within
the 68332. Further suppose that the values in the Clock Synthesizer
Control differ. This is the SIM register SYNCR. The resulting display
may look as follows:
0a04@emsim=000, 0a04@reg=03f
0a05@emsim=000, 0a05@reg=008
Refer to the processor data book to understand which SIM register is
differing.
Solutions for the Motorola 68360
169
Chapter 7: Using Internal Registers (SIM and EMSIM Registers)
Internal Representation of SIM and EMSIM Registers
170
Solutions for the Motorola 68360
8
Using the Emulator with a Debugger
171
Using the Emulator with a Debugger
Several prominent companies design and sell state-of-the-art source
debuggers which work with the Agilent Technologies emulation module
and emulation probe.
Benefits of using a debugger
The debugger will enable you to control the execution of your
processor from the familiar environment of your debugger. Using a
debugger lets you step through your code at the source-code level.
With a debugger connection, you can set breakpoints, single-step
through source code, examine variables, and modify source code
variables from the debugger interface. The debugger can also be used
to download executable code to your target system.
Using a debugger to connect to the emulator allows the entire design
team to have a consistent interface from software development to
hardware/software integration.
Debugger interfaces must be ordered directly from the debugger
vendor.
Compatibility with other logic analysis system tools
You can use your logic analysis system to collect and analyze trace data
while you use your debugger. If you are using an X windows
workstation or a PC with an X terminal emulator, you can display the
logic analyzer windows right next to your debugger.
172
Solutions for the Motorola 68360
Chapter 8: Using the Emulator with a Debugger
Using the Emulator with a Debugger
Here is an example of what the display on your PC or workstation
might look like:
Solutions for the Motorola 68360
173
Chapter 8: Using the Emulator with a Debugger
Using the Emulator with a Debugger
Minimum requirements
To use a debugger with the emulator, you will need:
•
A debugger which is compatible with the emulator
•
A LAN connection to the PC or workstation that is running the debugger
•
X windows or an X terminal emulator, such as Reflection X on a PC. This is
required only if you wish to have the logic analysis system user interface
displayed on your PC or workstation screen, along with the debugger.
Is your debugger compatible with the emulator?
Ask your debugger vendor whether the debugger can be used with an
Agilent Technologies emulation module or emulation probe (also
known as a "processor probe" or "software probe").
LAN connection
You will use a LAN connection to allow the debugger to communicate
with the emulator.
Compatibility with the Emulation Control Interface
Do not use the logic analysis system’s Emulation Control Interface and
your debugger at the same time.
174
Solutions for the Motorola 68360
Chapter 8: Using the Emulator with a Debugger
Setting up Debugger Software
Setting up Debugger Software
The instructions in this manual assume that your PC or workstation is
already connected to the LAN, and that you have already installed the
debugger software according to the debugger vendor’s documentation.
To use your debugger with the emulator, follow these general steps:
•
Connect the emulator to your target system (see page 137).
•
Connect the emulator or logic analysis system to the LAN (page 176).
•
Export the logic analysis system's display to your PC or workstation
(page 180).
•
Configure the emulator (page 144).
•
Begin using your debugger.
If you use the Emulation Control Interface to configure the emulator,
remember to end the Emulation Control Interface session before you
start the debugger.
CAUTION:
Do not use the Emulation Control Interface at the same time as a debugger.
The Emulation Control Interface and debuggers do not keep track of
commands issued by other tools. If you use both at the same time, the tools
may display incorrect information about the state of the processor, possibly
resulting in lost data.
See Also
Refer to the documentation for your debugger for more information on
connecting the debugger to the emulator.
Solutions for the Motorola 68360
175
Chapter 8: Using the Emulator with a Debugger
Setting up Debugger Software
To connect the logic analysis system to the
LAN
Information on setting up a LAN connection is provided in the online
help or installation manual for your logic analysis system.
Your debugger will require some information about the LAN connection
before it can connect to the emulator. This information may include:
•
IP address (Internet address) or LAN name of the logic analysis system.
•
Gateway address of the logic analysis system.
•
Port number of the emulator.
Port numbers for emulators
Port number
Debugger connections
6470
6474
6478
6482
Telnet connections
6472
6476
6480
6484
176
Use for
Slot 1 (First emulator in an Agilent Technologies 16600A/
700A-series logic analysis system)
Slot 2 (Second emulator in an Agilent Technologies
16700A-series system)
Slot 3 (Third emulator in an expansion frame)
Slot 4 (Fourth emulator in an expansion frame)
Slot 1 (First emulator)
Slot 2 (Second emulator)
Slot 3 (Third emulator)
Slot 4 (Fourth emulator)
Solutions for the Motorola 68360
Chapter 8: Using the Emulator with a Debugger
Setting up Debugger Software
Write the information here for future reference:
IP Address of Logic Analysis System
___________________________
LAN Name of Logic Analysis System
___________________________
Gateway Address
___________________________
Port Number of Emulator
___________________________
Solutions for the Motorola 68360
177
Chapter 8: Using the Emulator with a Debugger
Setting up Debugger Software
To change the port number of an emulator
Some debuggers do not provide a means to specify a port number. In
that case, the debugger will always connect to port 6470 (the first
emulator). If you need to connect to another module, or if the port
number of the first module has been changed, you must change the
port number to be 6470.
To view or change the port number:
1 Click on the emulation module icon in the system window of the
logic analysis system, then select Update Firmware.
2 Select Modify Lan Port...
3 If necessary, enter the new port number in the Lan Port
Address field.
The new port number must be greater than 1024 and must not already
be assigned to another emulator.
178
Solutions for the Motorola 68360
Chapter 8: Using the Emulator with a Debugger
Setting up Debugger Software
To verify communication with the emulator
1 Telnet to the IP address.
For example, on a UNIX system, enter “telnet <IP_address> 6472”.
This connection will give you access to the emulator’s built-in terminal
interface. You should see a prompt, such as “M>”.
2 At the prompt, type:
ver
You should then see information about the emulator and firmware
version.
3 To exit from this telnet session, type <CTRL>D at the prompt.
See Also
The online help or manual for your logic analysis system, for
information on physically connecting the system to the LAN and
configuring LAN parameters.
If you have problems verifying LAN communication, see page 275.
Solutions for the Motorola 68360
179
Chapter 8: Using the Emulator with a Debugger
Setting up Debugger Software
To export the logic analysis system’s display to
a workstation
By exporting the logic analyzer’s display, you can see and use the logic
analysis system’s windows on the screen of your workstation. To do
this, you must have telnet software and X window installed on your
computer.
1 On the workstation, add the host name of the logic analysis
system to the list of systems allowed to make connections:
xhost +<IP_address>
2 Use telnet to connect to the logic analysis system.
telnet <IP_address>
3 Log in as “logic”.
The logic analysis system will open a Session Manager window on your
display.
4 In the Session Manager, click Start Session on This Display.
Example
On a UNIX workstation, you could use the following commands to
export the display of a logic analysis system named “mylogic”:
$ xhost +mylogic
$ telnet mylogic
Trying...
Connected to mylogic.mycompany.com.
Escape character is ‘^]’.
Local flow control on
Telnet TERMINAL-SPEED option ON
Agilent Technologies Logic Analysis System
Please Log in as: logic [displayname:0]
login: logic
Connection closed by foreign host.
180
Solutions for the Motorola 68360
Chapter 8: Using the Emulator with a Debugger
Setting up Debugger Software
To export the logic analysis system’s display to
a PC
By exporting the logic analyzer’s display, you can see and use the logic
analysis system’s windows on the screen of your PC. To do this, you
must have telnet software and an X terminal emulator installed on your
computer. The following instructions use the Reflection X emulator
from WRQ, running on Windows 95, as an example.
1 On the PC, start the X terminal emulator software.
To start Reflection X, click the Reflection X Client Startup icon.
2 Start a telnet connection to the logic analysis system.
Log in as “logic”.
For Reflection X, enter the following values in the Reflection X Client
Startup dialog:
a In the Host field, enter the LAN name or IP address of the
logic analysis system.
b In the User Name field, enter “logic”.
c Leave the Password field blank.
d Leave the Command field blank.
e Click Run to start the connection.
The logic analysis system will open a Session Manager window on your
display.
3 In the Session Manager window, click Start Session on This
Display.
Solutions for the Motorola 68360
181
Chapter 8: Using the Emulator with a Debugger
Using the Green Hills debugger
Using the Green Hills debugger
Compatibility
Version 1.8.8.A of the MULTI Development Environment from Green
Hills Software, Inc. is one of several debuggers which connect to the
Agilent Technologies emulation module.
This section provides information that is specific to using MULTI with
the Agilent Technologies emulation module. It is intended to be used
in conjunction with the MULTI documentation provided by Green Hills
Software.
Overview
MULTI connects to an emulation module through the Green Hills hostresident program (hpserv).
Host computer
MULTI
hpserv
Logic analysis
system with
emulation
module
Target
Getting started
1 Check that your Emulation Module is programmed with firmware
for a CPU32 processor.
Go to the system window of the logic analyzer interface and verify that
the Emulation Module icon is described as a "Motorola CPU16/32 BDM
Emulator". If it is not, follow the instructions on page 142 to update
the firmware.
2 Build the executable.
182
Solutions for the Motorola 68360
Chapter 8: Using the Emulator with a Debugger
Using the Green Hills debugger
If you have the demo software shipped with the Green Hills debugger,
follow these steps:
a Prepare the executable.
Go to the 68000PC subdirectory where you installed MULTI. Copy the
default.lnk file to user.lnk.
b Start MULTI.
On Unix, enter "multi".
On Windows, double-click the Green Hills icon.
c Set up the MULTI software environment:
•
•
•
Replace the project default.bld (in the Builder dialog box next to the
project button) with hpdemo/ecs.bld and press ENTER.
Make sure the target button on the MULTI window says "cross 68".
In the Builder window, double-click ecs.bld.
The box next to the Debug button should display "ecs". The window should
list the names of the source code files.
d In the Builder menu bar, select Options➞CPU, then set the
processor type.
e In the Builder menu bar, select Options➞Advanced, and
select the default output mode.
f Build the demo program:
•
In the Builder window, click the Build icon. (Or, in the menu bar, select
Build➞Build All.)
•
Close the Progress window when the "Build completed" message is
displayed.
g Select Options➞Advanced, and select the IEEE-695 output
mode to generate an IEEE-695 format file.
3 Connect MULTI to the emulation module.
There are two ways to connect to the emulation module:
•
In the Remote box in the MULTI Builder window, enter:
hpserv IP_address
Solutions for the Motorola 68360
183
Chapter 8: Using the Emulator with a Debugger
Using the Green Hills debugger
OR
•
In the Builder window, click Debug to open the Debugger window, then in
the Debugger window’s command pane, enter:
remote hpserv IP_address
Starting hpserv opens two windows: the Target window and the I/O
window. Commands entered in the Target window are sent directly to
the emulation module.
The I/O window sends input (stdin) to and receives output (stdout)
from the target program while it is running.
Note that hpserv connects to the first emulation module (port 6470) in
a logic analysis system frame. You may specify another port by using
the -p option with hpserv. See page 176 for more information on port
numbers.
4 Start the debugger.
If you have not opened the Debugger window yet, click Debug in the
Builder window.
5 Configure the emulation module and target system.
Before running the target processor, you must configure the Agilent
Technologies emulation module for your target system. For example,
you may have to set the BDM clock speed, the reset operation, cache
disabling, or other configuration parameters.
If you are unsure of the configuration needed for your emulation
module, you can use the Configuration window in the logic analysis
system’s Emulation Control Interface to explore the configuration
options.
Once you know the configuration settings needed for your target
system, you may use one of the following methods to configure the
emulation module and target system:
•
•
•
184
Use the Configuration window in the logic analysis system’s Emulation
Control Interface.
Enter "cf" commands in the Target window.
Use an initialization script.
Solutions for the Motorola 68360
Chapter 8: Using the Emulator with a Debugger
Using the Green Hills debugger
See “To configure the emulation module, analysis probe, and target using
an initialization script” on page 186 for information on saving the
configuration commands in a script.
6 Specify an initialization address for the stack pointer.
This is required if the stack pointer is neither initialized when the
processor is reset nor set in the start-up code generated by the
compiler. If the stack pointer address needs to be initialized:
•
In the debugger’s command pane, enter:
_INIT_SP = <address>
OR
•
In the Target window, enter:
reg a7=<address>
OR
•
* Include the following line in an initialization script:
target reg a7=<address>
7 Download the code:
In the Debugger window, select Remote➞LoadProgram.
The Debugger command pane indicates that the code has been
downloaded to the target.
Solutions for the Motorola 68360
185
Chapter 8: Using the Emulator with a Debugger
Using the Green Hills debugger
To configure the emulation module, analysis
probe, and target using an initialization script
You can use an initialization script to configure the emulation module
and set up your target system. If you will always be using the same
configuration, this way will save time and reduce errors.
1 Save the configuration commands in a text file, one command
per line.
Green Hills provides an example initialization sequence in the file
hpserv.rc in the "hpdemo" directory.
2 To run the script, enter the following command in the Debugger
command pane:
<filename
Example: simple configuration script
Create a file with the following lines:
remote hpserv logic1
target cf proc=68360
_INIT_SP=0x10000
Save the file in the MULTI startup directory and name it hpserv.rc.
To run the script, enter the following command in the Debugger
command pane:
<hpserv.rc
When run, this script will:
•
•
•
186
Connect to the target through the emulation module in a logic
analysis system frame called "logic1".
Set the processor type.
Initialize the stack pointer.
Solutions for the Motorola 68360
Chapter 8: Using the Emulator with a Debugger
Using the Green Hills debugger
Example: script to configure EMSIM and SIM registers
The following script was written for a target which does not have
boot ROM and which is connected to an analysis probe. The script
sets the EMSIM registers, then copies the EMSIM values to the
target processor (sync emsim) and to the analysis probe (pp
load) to enable address reconstruction.
target
target
target
target
target
target
target
target
target
target
target
target
target
target
target
target
target
target
target
target
target
target
target
target
target
target
target
target
target
target
target
target
target
m -d4 0000@emmbar=01000133
m -d4 1000@emsim=00001438F
m -d4 1040@emsim=017CD23A0
m -d4 1034@emsim=000000000
m -d4 1030@emsim=000000000
m -d2 1014@emsim=000000000
m -d2 1016@emsim=0000000A0
m -d2 1026@emsim=00000070F
m -d2 102A@emsim=000000000
m -d2 1010@emsim=000008000
m -d1 1008@emsim=000000084
m -d1 100C@emsim=00000008C
m -d1 1023@emsim=000000000
m -d1 1022@emsim=00000000E
m -d4 1050@emsim=000000000
m -d4 1060@emsim=0A0000001
m -d4 1070@emsim=000000000
m -d4 1080@emsim=000000001
m -d4 1054@emsim=000000000
m -d4 1064@emsim=02FE00000
m -d4 1074@emsim=000000000
m -d4 1084@emsim=04FE00009
m -d4 1090@emsim=000000000
m -d4 10A0@emsim=000000000
m -d4 10B0@emsim=000000000
m -d4 10C0@emsim=000000000
m -d4 1094@emsim=0F0000004
m -d4 10A4@emsim=0F0000004
m -d4 10B4@emsim=0F0000004
m -d4 10C4@emsim=0F0000004
cf proc=68360
sync emsim
pp load
Solutions for the Motorola 68360
187
Chapter 8: Using the Emulator with a Debugger
Using the Green Hills debugger
To perform common debugger tasks
•
To display registers, click the regs button in the Display window.
•
To set a breakpoint, click on the source code line where the breakpoint is
to be located.
•
To clear a breakpoint, click again on the source line.
•
To step through code, click next.
•
To run from the current PC, click go.
•
To toggle the display between source code and source code interlaced with
assembly code, click assem.
•
To load program symbols, reset the PC, reset the stack pointer, and run
from the start, click restart.
To send commands to the emulation module
MULTI communicates to the emulation module using the emulation
module’s "terminal interface" commands. MULTI automatically
generates and sends the commands required for normal operation. If
you want to communicate directly with the emulation module during a
debug session, you may do so using "terminal interface" commands
through the Target window (which comes up when hpserv is brought
up). You can also enter these commands from the Debugger window’s
command pane by preceding the command with the "target" command.
To view commands sent by MULTI to the
emulation module
The communication between MULTI and the emulation module can be
viewed by running hpserv in a logging mode:
remote hpserv -dc -a
-o <filename> <emulation module>
The options -dc and -da log both asynchronous and console messages
and the -o <filename> directs these messages to a log file called
<filename>. When using this option, disconnect from hpserv (to flush
out the file) and then you may view <filename> to see what
commands MULTI sent to the emulation module.
188
Solutions for the Motorola 68360
Chapter 8: Using the Emulator with a Debugger
Using the Green Hills debugger
NOTE: logging commands in this way may result in a VERY large file.
Beware of the disk space it may require.
To reinitialize the system
If you suspect that the emulation module is out of sync with the MULTI
debugger, you may want to reinitialize it. Perform the steps below to
accomplish reinitialization:
1 In the Target window, type:
init -c
2 Repeat step 5 in the "Getting started" section to configure the
emulation module.
To disconnect from the emulation module
• In the Debugger window, select Remote➞Disconnect.
The Debugger command pane indicates that the debugger has
disconnected from the emulation module.
Error conditions
"!ERROR 800! Invalid command: bcast"
usually means that there is not a target interface module (TIM)
connected to the emulation module or the emulation module does not
have firmware for the CPU32 family. Verify that the emulation module
is connected to the target. Next, go to the system window of the logic
analyzer interface and verify that the Emulation Module icon (stoplight) is described as a Motorola CPU16/32 BDM Emulator. If it is not,
follow the steps on page 142 to update the firmware in the emulation
module.
"command socket connection failed: WSAECONNREFUSED: connection refused"
usually means the emulation module is not at port #6470 on the Logic
Analysis System.
See Also
Green Hills MULTI Software Development Environment User’s
Solutions for the Motorola 68360
189
Chapter 8: Using the Emulator with a Debugger
Using the Green Hills debugger
Guide.
Using MULTI with the Agilent Technologies Processor Probe from
Green Hills Software, Inc.
The Green Hills web site: http://www.ghs.com
“Configuring the Emulation Module” on page 144 for more information
on configuration options and the "cf" command.
190
Solutions for the Motorola 68360
Chapter 8: Using the Emulator with a Debugger
Using the Software Development Systems debugger
Using the Software Development Systems
debugger
Compatibility
Version 7.2 of the SingleStep debugger from Software Development
Systems, Inc. is one of several debuggers which connect to the Agilent
Technologies emulation module.
This section provides information that is specific to using SingleStep
with the Agilent Technologies emulation module. It is intended to be
used in conjunction with the SingleStep documentation provided by
SDS.
Overview
Host computer
LAN
SingleStep
Logic analysis
system with
emulation
module
Target
Startup behavior
The following actions are performed at the start of a session and when
you select File➞Debug:
•
•
•
•
•
If the target reset option is selected, the target is reset and programmed
with the register values in the configuration file (<filename>.cfg).
Hardware breakpoints are disabled.
Software breakpoints are enabled.
All breakpoints are cleared.
main() _exit breakpoints are set, if that option is selected.
Solutions for the Motorola 68360
191
Chapter 8: Using the Emulator with a Debugger
Using the Software Development Systems debugger
Getting started
1 Check that your emulation module is programmed with firmware
for a CPU32 processor:
Go to the system window of the logic analyzer interface and verify that
the Emulation Module icon is described as a "Motorola CPU16/32 BDM
Emulator". If it is not, follow the instructions on page 142 to update
the firmware.
2 Connect to the emulation module:
a Start SingleStep running on your PC or workstation.
b When the small Debug dialog box appears in the middle of the
screen, click the Connection tab and then enter the IP
address of the Agilent Technologies logic analysis system
which contains the emulation module.
If the Debug dialog box is not visible, select File➞Debug.
Note: SingleStep is hard-coded to connect to the emulation module at port
6470 of the logic analysis system frame. See page page 178 for more
information on port numbers.
3 Configure the emulation module with the processor clock speed.
In the Debug dialog box, click the Connection tab and then enter a
Processor Clock speed which is less than or equal to the speed at which
the processor will run out of reset.
The emulation module must know the target clock speed before it can
communicate with the target. This value depends on the oscillator or
crystal used on your target system and the multipliers applicable at
reset. The communications speed can be changed (see “Download
performance” on page 199) but will be reset to this value each time
SingleStep resets the processor.
4 Initialize the target system.
The target system must have various registers and memory locations
initialized before it can access RAM and before SingleStep can
download an application. Normally, code in the target’s boot ROM
192
Solutions for the Motorola 68360
Chapter 8: Using the Emulator with a Debugger
Using the Software Development Systems debugger
performs this initialization. However, when SingleStep resets the
target, it immediately places the processor in debug mode. Any
initialization code which may exist on the target board has not been
run.
SingleStep provides a way for target initialization to occur without
running application code through the use of the "_config" alias. _config
is used to define a list of commands that will be used to initialize the
target after a reset. The _config alias should be defined in the sstep.ini
file (in the "cmd" directory) and will point to a file of type .cfg which
contains the actual initialization commands.
SingleStep provides some workspace files for some standard targets.
These files will setup various registers in order to initialize these
targets. The files can be found in the init directory and are as follows:
•
•
•
•
•
•
EST SBC 360 - est360.wsp
Motorola 332 EVS revision a – 332evs_a.wsp
Motorola 332 EVS revision b – 332evs_b.wsp
Motorola 340 EVS – 340evs.wsp
Nohau Trg-332 – trg332.wsp
Vesta SBC332 – vesta332,wsp
Loading one of these workspace files followed by opening the Debug
Dialog from the File Menu and setting the File and Connection options
then clicking OK will create a corresponding .cfg file in the cmd
directory. This file will store the values of the items shown in the Target
Configuration tab. You may wish to edit these values before clicking OK
and saving them to a .cfg file.
Solutions for the Motorola 68360
193
Chapter 8: Using the Emulator with a Debugger
Using the Software Development Systems debugger
Example
If you load the est360.wsp and set up the Debug Dialog options for
the target you are connecting to, when you click OK, the file
68360.cfg will be created and place in the cmd directory.
Comments have been added to this file, in order to explain the
items (comments begin with a #).
Contents of 68360.cfg:
set vectbase = 0x400000
set vectaddr = 0x400000
write -l CPU:0x3FF00 = 0x08000133
write -l SD:0x08001000 = 0x00014F71
write -b SD:0x08001022 = 0x0E
write -l SD:0x08001040 = 0x17CD23A0
write -l SD:0x08001050 = 0x00000001
write -l SD:0x08001054 = 0x3FFC0002
write -l SD:0x08001060 = 0x00100001
write -l SD:0x08001064 = 0x2FF80000
write -l SD:0x08001080 = 0x00400001
write -l SD:0x08001084 = 0x2FE00003
write -b SD:0x0800100C = 0x8F
write -w SD:0x08001010 = 0x4000
write -w SD:0x08001014 = 0x8000
write -w SD:0x08001016 = 0x0000
#
#
#
#
#
#
#
#
#
#
#
#
#
#
MBAR
MCR
SYPCR
GIMR
BRO
OR0
BR1
OR1
BR3
OR3
CLKOCR
PLLCR
CDVCR
PEPAR
The .cfg file sets up the target’s chip select registers (SIM registers)
needed in order to map memory correctly. If your target is connected
to an analysis probe, you will need to execute some additional
commands in order to configure the analysis probe. The analysis probe
stores its own copy of the chip select registers. In general, just
executing the above write commands will configure the target’s
registers. The emulation module also stores a copy of these registers.
The emulation module command “sync sim” listed below will copy the
values of the target’s SIM registers into the EMSIM registers. Next, the
EMSIM registers must be copied over to the analysis probe. This is
accomplished by issuing the built-in command “pp load”. Enter the
following two commands into the Command window:
control –c “sync sim”
control –c “pp load”
You should have the appropriate values for your target first written into
194
Solutions for the Motorola 68360
Chapter 8: Using the Emulator with a Debugger
Using the Software Development Systems debugger
the SIM registers before issuing these two commands. “control –c” is
used by SingleStep to forward a command to the emulation module.
For help on either the “sync sim” or “pp load” command, issue the
commands, control –c “help sync” or control –c “help pp load” into the
Command window. Also, note that the help pp load command will refer
to the analysis probe as a preprocessor. They are one in the same.
If your target is not one that SDS ships a workspace for, add a line to
the bottom of the file “sstep.ini” (which is supplied with the debugger)
that sets up the _config alias to point to a .cfg file to use. This line will
look like:
alias _config ’source ${cmdpath}68336.cfg’
In this case, the name of the config file to use is 68336.cfg. Edit this file
specific for your targets need. Keep in mind, that commands beginning
with “control –c” followed by a string of quoted text are commands that
will be forwarded to the emulation module. Commands that do not
begin with “control –c” are SingleStep commands.
Example
Here is a configuration file which contains both emulation module
built-in commands and SingleStep commands:
# Config file for 68336 Motorola Modular Board
# First set clock speed to 8 MHz
control -c "cf procck=8"
# Set the processor id to 68336
control -c "cf proc=68336"
set vectbase = 0x000000
set vectaddr = 0x000000
# write -l CPU:0x3FF00 =
# write -l SD:0x01001000
# write -b SD:0x01001022
# write -l SD:0x01001040
# write -l SD:0x01001050
# write -l SD:0x01001054
# write -l SD:0x01001060
# write -l SD:0x01001064
# write -l SD:0x01001080
# write -l SD:0x01001084
Solutions for the Motorola 68360
0x01000133
= 0x0001438F
= 0x0E
= 0x17CD23A0
= 0x00000000
= 0x00000000
= 0xA0000001
= 0x2FE00000
= 0x00000001
= 0x4FE00009
#
#
#
#
#
#
#
#
#
#
MBAR
MCR
SYPCR
GIMR
BR0
OR0
BR1
OR1
BR3
OR3
195
Chapter 8: Using the Emulator with a Debugger
Using the Software Development Systems debugger
#
#
#
#
#
#
write
write
write
write
write
write
-b
-w
-w
-w
-w
-b
SD:0x0100100C
SD:0x01001010
SD:0x01001014
SD:0x01001016
SD:0x01001026
SD:0x01001008
=
=
=
=
=
=
0x8C
0x8000
0x0000
0x00A0
0x070F
0x84
#
#
#
#
#
#
CLKOCR
PLLCR
CDVCR
PEPAR
PICR
AVR
# Reset, run, break in order to set up chip selects
# We can issue these commands since the target has boot
# code in ROM that sets up the chip select registers
control -c "rst"
control -c "r"
control -c "b"
# Issue the next two commands since there is an
# analysis probe connected to the target
# Copy the
control -c
# Copy the
control -c
sim values to the emsim set
"sync sim"
emsim values to the analysis probe
"pp load"
The config file shown in this example did not need to set up chip
select registers because the target has boot code in ROM that will
accomplish this. Therefore, just issuing a “reset, run, break” will
execute the boot code in ROM. If your ROM does not contain boot
code to set up these registers, add write commands to the .cfg file
(similar to what is shown here for the 68360) to set up these values.
Reset, run, break would not be used to set up a target that does not
contain boot code.
Given that you added a line to the sstep.ini file that points to this
configuration file, all you need to do now is to bring up the Debug
Dialog and enter the file to download (if desired), and the connection
port to use. Click OK when finished. This config file (the one pointed to
by the added line in sstep.ini) will get executed if and only if you have
not unchecked the “Reset Target” option on the Debug Dialog’s
“Options” tab. This is selected by default. Deselecting this option will
prevent the config file you specified in the sstep.ini file from being
executed. Also, keep in mind that this file will be executed every time
the Debug Dialog is terminated via the OK button when “Reset Target”
is selected.
196
Solutions for the Motorola 68360
Chapter 8: Using the Emulator with a Debugger
Using the Software Development Systems debugger
In summary, there are two ways for you to configure the emulation
module and your target. The first method consisted of loading an
existing workspace, using the Debug Dialog to modify any items
needed followed by clicking the OK button and having it create a
corresponding .cfg file. If you have an analysis probe connected to this
target, you need to enter the two additional commands into the
Command window (control –c “sync sim”, control –c “pp load”). The
second method consisted of creating a .cfg file and specifying that file
in the _config alias in the sstep.ini file. This file will automatically be
loaded upon clicking OK in the Debug Dialog.
To save time, you may want to do the first method just to generate .cfg
file that you can edit and use in method two. If you had an analysis
probe connected you would add the two commands mentioned
previously to the .cfg file thereby not having to enter them through the
Command window.
The "Debug" dialog method and the sstep.ini method are mutually
exclusive. Use one or the other, but not both.
Initialization of the target (that is, execution of the _config alias) will
not actually occur until the "Debug" dialog is successfully exited.
5 Set up the download and execution options in the Options tab of
the Debug dialog.
6 Download the application and run:
Select the File tab and enter the application file name. Exit the
"Debug" dialog box by clicking OK.
Emulation module initialization and target initialization occur every
time the "Debug" dialog is terminated via the OK button. A summary of
the actions taken by SingleStep is given here:
•
Initialize the emulation module with the communication speed specified in
the "Debug" dialog.
•
If "reset target" was selected then execute the commands specified by the
_reset alias. The _reset alias should be used to specify commands that are
Solutions for the Motorola 68360
197
Chapter 8: Using the Emulator with a Debugger
Using the Software Development Systems debugger
specific to initializing the processor. It is executed each time the processor
is reset. The value of the _reset alias can be viewed by issuing a "alias
_reset" from the command window.
•
Execute the commands specified by the _config alias. The _config alias
should be used to specify commands that are specific to initializing
(configuring) the target system. It is executed each time the processor is
reset and each time the debug dialog is exited. The value of the _config
alias can be viewed by issuing an "alias _config" from the command
window.
•
If "load image" was selected then download the application and set the PC
based on object module file contents.
•
If "execute until main" was selected then set a breakpoint at main() and
run.
To send commands to the emulation module
To view commands sent by SingleStep
SingleStep communicates to the emulation module using the emulation
module’s "terminal interface" commands. SingleStep automatically
generates and sends the commands required for normal operation.
This communication between SingleStep and the emulation module
can be observed by entering the following command in the SingleStep
command window:
control -ms
To send commands
"Terminal interface" commands may be sent directly to the emulation
module from the SingleStep command window or included in
SingleStep’s .cfg or .dbg command files.
Commands should be enclosed in double quotes and given the prefix:
198
Solutions for the Motorola 68360
Chapter 8: Using the Emulator with a Debugger
Using the Software Development Systems debugger
control-c.
Examples
To see the speed that the emulation module is using to
communicate with the target system you would issue the following
command in the SingleStep command window:
control -c "cf procck"
To change the speed to match a 25MHz processor clock you would
issue the following command in the command window:
control -c "cf procck=25"
For more information about "terminal interface" commands see page
146.
Download performance
Downloads are fastest when the emulation module speed is set to
match that of the target processor. The initial speed that the emulation
module uses to communicate with the target processor is set by the
Processor clock item in the connection tab of the "Debug" dialog. The
user is responsible for specifying this speed to be less than or equal to
the initial, reset, speed of the processor. Usually a command in the
_config alias will raise the speed of the processor above its initial, reset
value. For maximum download performance the command to increase
the target processor speed should be followed by a command to
increase the speed of the emulation module communication:
Example
After setting the clock rate of the target processor, the following
command should be entered to increase the emulation module
communication speed:
control -c "cf procck=25"
Solutions for the Motorola 68360
199
Chapter 8: Using the Emulator with a Debugger
Using the Software Development Systems debugger
Error conditions
"!ERROR 800! Invalid command: bcast" usually means that there is not
a target interface module (TIM) connected to the emulation module or
the emulation module does not have firmware for the CPU32 family.
Verify that the emulation module is connected to the target. Next, go
to the system window of the logic analyzer interface and verify that the
Emulation Module icon (stop-light) is described as a Motorola CPU16/
32 BDM Emulator. If it is not, follow the steps on page 142 to update
the firmware in the emulation module.
"command socket connection failed: WSAECONNREFUSED: connection refused"
usually means the emulation module is not at port #6470 on the Logic
Analysis System. See step 2 of the getting started section above.
"unrecognized hostname"
usually means that the debugger is unable to establish communication
with the emulator. Verify communication to the emulation module by
doing a ping to the logic analyzer. If you are unable to ping the logic
analyzer refer to page 275 for more information.
See Also
The SDS web site: http://www.sdsi.com
The SDS SingleStep Users Guide.
The configuration section beginning on page 144 for more information
on configuration options and the "cf" command.
200
Solutions for the Motorola 68360
9
Using the Analysis Probe and
Emulation Module Together
201
Chapter 9: Using the Analysis Probe and Emulation Module Together
Using the Analysis Probe and Emulation Module Together
Using the Analysis Probe and Emulation Module
Together
This chapter describes how to use an analysis probe, an emulation
module, and other features of your Agilent Technologies 16600A or
16700A logic analysis system to gain insight into your target system.
What are some of the tools I can use?
You can use a combination of all of the following tools to control and
measure the behavior of your target system:
•
Your analysis probe, to acquire data from the processor bus while it is
running full-speed.
•
Your emulation module, to control the execution of your target processor
and to examine the state of the processor and of the target system.
•
The Emulation Control Interface, to control and configure the emulation
module, and to display or change target registers and memory.
•
Display tools including the Listing tool, Chart tool, and System
Performance Analyzer tool to make sense of the data collected using the
analysis probe.
•
Your debugger, to control your target system using the emulation module.
Do not use the debugger at the same time as the Emulation Control
Interface.
•
The Agilent Technologies B4620B Source Correlation Tool Set, to relate
the analysis trace to your high-level source code.
Which assembly-level listing should I use?
Several windows display assembly language instructions. Be careful to
use to the correct window for your purposes:
•
The Listing tool shows processor states that were captured during a “Run”
of the logic analyzer. Those states are disassembled and displayed in the
Listing window.
•
The Emulation Control Interface shows the disassembled contents of a
202
Solutions for the Motorola 68360
Chapter 9: Using the Analysis Probe and Emulation Module Together
Using the Analysis Probe and Emulation Module Together
section of memory in the Memory Disassembly window.
•
Your debugger shows your program as it was actually assembled, and (if it
supports the emulation module) shows which line of assembly code
corresponds to the value of the program counter on your target system.
Which source-level listing should I use?
Different tools display source code for different uses:
•
The Source Viewer window allows you to follow how the processor
executed code as the analyzer captured a trace. Use the Source Viewer to
set analyzer triggers. The Source Viewer window is available only if you
have licensed the Agilent Technologies B4620B Source Correlation Tool
Set.
•
Your debugger shows which line of code corresponds to the current value
of the program counter on your target system. Use your debugger to set
breakpoints.
Where can I find practical examples of
measurements?
The Measurement Examples section in the online help contains
examples of measurements which will save you time throughout the
phases of system development: hardware turn-on, firmware
development, software development, and system integration.
A few of the many things you can learn from the measurement
examples are:
•
How to find glitches.
•
How to find NULL pointer de-references.
•
How to profile system performance.
To find the measurement examples, click on the Help icon in the logic
analysis system window, then click on “Measurement Examples.”
Solutions for the Motorola 68360
203
Chapter 9: Using the Analysis Probe and Emulation Module Together
Triggering the Emulation Module from the Analyzer
Triggering the Emulation Module from the
Analyzer
You can trigger the emulation module from the logic analyzer using
either the Source Viewer window or the Intermodule window. If you are
using the Agilent Technologies B4620B Source Correlation Tool Set,
using the Source Viewer window is the easiest method.
To stop the processor when the logic analyzer
triggers on a line of source code (Source
Viewer window)
If you have the Agilent Technologies B4620B Source Correlation Tool
Set, you can easily stop the processor when a particular line of code is
reached.
1 In the Source window, click on the line of source code where you
want to set the trigger, then select Trace about this line.
The logic analyzer trigger is now set.
2 Select Trace➞Enable - Break Emulator On Trigger.
204
Solutions for the Motorola 68360
Chapter 9: Using the Analysis Probe and Emulation Module Together
Triggering the Emulation Module from the Analyzer
The emulation module is now set to halt the processor after receiving a
trigger from the logic analyzer.
To disable the processor stop on trigger, select Trace➞Disable Break Emulator On Trigger.
3 Click Group Run in the Source window (or other logic analyzer
window).
4 If your target system is not already running, click Run in the
emulation Run Control window to start your target.
To stop the processor when the logic analyzer
triggers (Intermodule window)
Use the Intermodule window if you do not have the Agilent
Technologies B4620B Source Correlation Tool Set or if you need to use
a more sophisticated trigger than is possible in the Source Viewer
window.
1 Create a logic analyzer trigger.
2 In the Intermodule window, click the emulation module icon,
then select the analyzer which is intended to trigger it.
Solutions for the Motorola 68360
205
Chapter 9: Using the Analysis Probe and Emulation Module Together
Triggering the Emulation Module from the Analyzer
The emulation module is now set to stop the processor when the logic
analyzer triggers.
3 Click Group Run in the Source window (or other logic analyzer
window).
4 If your target system is not already running, click Run in the
emulation Run Control window to start your target.
See Also
See the online help for your logic analysis system for more information
on setting triggers.
To minimize the “skid” effect
There is a finite amount of time between when the logic analyzer
triggers, and when the processor actually stops. During this time, the
processor will continue to execute instructions. This latency is referred
to as the skid effect.
To minimize the skid effect:
1 In the Emulation Control Interface, open the Configuration
window.
2 Set processor clock speed to the maximum value which your
target can support.
The amount of skid will depend on the processor’s execution speed and
whether code is executing from the cache. See page 149 for
information on how to configure the clock speed.
To stop the analyzer and view a measurement
• To view an analysis measurement you may have to click Stop
206
Solutions for the Motorola 68360
Chapter 9: Using the Analysis Probe and Emulation Module Together
Triggering the Emulation Module from the Analyzer
after the trigger occurs.
When the target processor stops it may cause the analyzer qualified
clock to stop. Therefore most intermodule measurements will have to
be stopped to see the measurement.
Example
An intermodule measurement has been set up where the analyzer
is triggering the emulation module. The following sequence could
occur:
1. The analyzer triggers.
2. The trigger (“Break In”) is sent to the emulation module.
3. The emulation module stops the user program which is running on
the target processor. The processor enters a background debug
monitor.
4. Because the processor has stopped, the analyzer stops receiving a
qualified clock signal.
5. If the trigger position is “End”, the measurement will be completed.
If the trigger position is not “End”, the analyzer may continue waiting
for more states.
6. The user clicks Stop in a logic analyzer window, which tells the logic
analyzer to stop waiting, and to display the trace.
Solutions for the Motorola 68360
207
Chapter 9: Using the Analysis Probe and Emulation Module Together
Tracing until the processor halts
Tracing until the processor halts
If you are using a state analyzer, you can begin a trace, run the
processor, then manually end the trace when the processor has halted.
To halt the processor, you can set a breakpoint using the Emulation
Control Interface or a debugger.
Some possible uses for this measurement are:
•
•
•
To store and display processor bus activity leading up to a system crash.
To capture processor activity before a breakpoint.
To determine why a function is being called. To do this, you could set a
breakpoint at the start of the function then use this measurement to see
how the function is getting called.
This kind of measurement is easier than setting up an intermodule
measurement trigger.
To capture a trace before the processor halts
1 Set the logic analyzer to trigger on nostate.
2 Set the trigger point (position) to End.
3 In a logic analyzer window, click Run.
4 In the Emulation Control Interface or debugger click Run.
5 When the emulation module halts click Stop in the logic analyzer
window to complete the measurement.
This is the recommended method to do state analysis of the processor
bus when the processor halts.
If you need to capture the interaction of another bus when the
processor halts or you need to make a timing or oscilloscope
measurement you will need to trigger the logic analyzer from the
emulation module (described in the next section).
208
Solutions for the Motorola 68360
Chapter 9: Using the Analysis Probe and Emulation Module Together
Triggering the Logic Analyzer from the Emulation Module
Triggering the Logic Analyzer from the
Emulation Module
You can create an intermodule measurement which will allow the
emulation module to trigger another module such as a timing analyzer
or oscilloscope.
If you are only using a state analyzer to capture the processor bus then
it will be much simpler to use “Tracing until processor halts” as
described on page 208.
Before you trigger a logic analyzer (or another module) from the
emulation module, you should understand a few things about the
emulation module trigger:
The emulation module trigger signal
The trigger signal coming from the emulation module is an “In
Background Debug Monitor” (“In Monitor”) signal. This may cause
confusion because a variety of conditions could cause this signal and
falsely trigger your analyzer.
The “In Monitor” trigger signal can be caused by:
•
The most common method to generate the signal is to click Run and then
click Break in the Emulation Control Interface. Going from “Run”
(Running User Program) to “Break” (“In Monitor”) generates the trigger
signal.
•
Another method to generate the “In Monitor” signal is to click Reset and
then click Break. Going from the reset state of the processor to the “In
Monitor” state will generate the signal.
•
In addition, an “In Monitor” signal is generated any time a debugger or
other user interface reads a register, reads memory, sets breakpoints or
steps. Care must be taken to not falsely trigger the logic analyzers listening
to the “In Monitor” signal.
Solutions for the Motorola 68360
209
Chapter 9: Using the Analysis Probe and Emulation Module Together
Triggering the Logic Analyzer from the Emulation Module
Group Run
The intermodule bus signals can still be active even without a
Group Run.
The following setups can operate independently of Group Run:
•
Port In connected to an emulation module
•
Emulation modules connected in series
•
Emulation module connected to Port Out
Here are some examples:
•
If “Group Run” is armed from “Port In” and an emulation module is
connected to Group Run, then any “Port In” signal will cause the emulation
module to go into monitor. The Group Run button does not have to be
pressed for this to operate.
•
If two emulation modules are connected together so that one triggers
another, then the first one going into monitor will cause the second one to
go into monitor.
•
If an emulation module is connected to Port Out, then the state of the
emulation module will be sent out the Port Out without regard to “Group
Run”.
The current emulation module state (Running or In Monitor) should be
monitored closely when they are part of a Group Run measurement so
that valid measurements are obtained.
Group Run into an emulation module does not mean that
the Group Run will Run the emulation module.
The emulation module Run, Break, Step, and Reset are independent of
the Group Run of the Analyzers.
210
Solutions for the Motorola 68360
Chapter 9: Using the Analysis Probe and Emulation Module Together
Triggering the Logic Analyzer from the Emulation Module
For example, suppose you have the following IMB measurement set up:
Clicking the Group Run button (at the very top of the Intermodule
window or a logic analyzer window) will start the analyzer running. The
analyzer will then wait for an arm signal. Now when the emulation
module transitions into “Monitor” from “Running” (or from “Reset”), it
will send the arm signal to the analyzer. If the emulation module is “In
Monitor” when you click Group Run, you will then have to go to the
emulation module or your debugger interface and manually start it
running.
Debuggers can cause triggers
Emulation module user interfaces may introduce additional states into
your analysis measurement and in some cases falsely trigger your
analysis measurement.
When a debugger causes your target to break into monitor it will
typically read memory around the program stack and around the
current program counter. This will generate additional states which
appear in the listing.
You can often distinguish these additional states because the time tags
will be in the µs and ms range. You can use the time tag information to
determine when the processor went into monitor. Typically the time
between states will be in the nanoseconds while the processor is
running and will be in the s and ms range when the debugger has
halted the processor and is reading memory.
Note also that some debugger commands may cause the processor to
break temporarily to read registers and memory. These states that the
debugger introduces will also show up in you trace listing.
Solutions for the Motorola 68360
211
Chapter 9: Using the Analysis Probe and Emulation Module Together
Triggering the Logic Analyzer from the Emulation Module
If you define a trigger on some state and the debugger happens to read
the same state, then you may falsely trigger your analyzer
measurement. In summary, when you are making an analysis
measurement be aware that the debugger could be impacting your
measurement.
To trigger the analyzer when the processor
halts
Remember: if you are only using a state analyzer to capture the
processor bus then it will be much simpler to use “Tracing until
processor halts” as described on page 208.
1 Set the logic analyzer to trigger on anystate.
2 Set the trigger point to center or end.
3 In the Intermodule window, click on the logic analyzer you want
to trigger and select the emulation module.
The logic analyzer is now set to trigger on a processor halt.
4 Click Group Run to start the analyzer(s).
5 Click Run in the Emulation Control Interface or use your
debugger to start the target processor running.
Clicking Group Run will not start the emulation module. The
emulation module run, break, step, and reset are independent of the
Group Run of the analyzers.
6 Wait for the Run Control window in the Emulation Control
Interface or the status display in your debugger to show that the
processor has stopped.
The logic analyzer will store states up until the processor stops, but
may continue running.
You may or may not see a “slow clock” error message. In fact, if you are
212
Solutions for the Motorola 68360
Chapter 9: Using the Analysis Probe and Emulation Module Together
Triggering the Logic Analyzer from the Emulation Module
using a state analyzer on the processor bus the status may never
change upon receiving the emulation module trigger (analysis arm).
This occurs because the qualified processor clock needed to switch the
state analyzer to the next state is stopped. For example, the state
analyzer before the arm event may have a status of “Occurrences
Remaining in Level 1: 1” and after the arm event it may have the same
status of “Occurrences Remaining in Level 1: 1”.
7 If necessary, in the logic analyzer window, click Stop to complete
the measurement.
If you are using a timing analyzer or oscilloscope the measurement
should complete automatically when the processor halts. If you are
using a state logic analyzer, click Stop if needed to complete the
measurement.
To trigger the analyzer when the processor
reaches a breakpoint
This measurement is exactly like the previous one, but with the one
additional complexity of setting breakpoints. Be aware that setting
breakpoints may cause a false trigger and that the breakpoints set may
not be valid after a reset.
Remember: if you are only using a state analyzer to capture the
processor bus then it will be much simpler to use “Tracing until
processor halts” as described on page 208.
1 Set the logic analyzer to trigger on anystate.
2 Set the trigger point to center or end.
3 In the Intermodule window, click on the logic analyzer you want
to trigger and select the emulation module.
The logic analyzer is now set to trigger on a processor halt.
4 Set the breakpoint.
Solutions for the Motorola 68360
213
Chapter 9: Using the Analysis Probe and Emulation Module Together
Triggering the Logic Analyzer from the Emulation Module
If you are going to run the emulation module from Reset you must do a
Reset followed by Break to properly set the breakpoints. The Reset
will clear all on-chip hardware breakpoint registers. The Break
command will then reinitialize the breakpoint registers. If you are using
software breakpoints which insert an illegal instruction into your
program at the breakpoint location you will not need to do the Reset,
Break sequence. Instead you must take care to properly insert your
software breakpoint in your RAM program location.
5 Click Group Run to start the analyzer(s).
6 Click Run in the Emulation Control Interface or use your
debugger to start the target processor running.
Clicking Group Run will not start the emulation module. The
emulation module run, break, step, reset are independent of the Group
Run of the analyzers.
7 Wait for the Run Control window in the Emulation Control
Interface or the status display in your debugger to show that the
processor has stopped.
The logic analyzer will store states up until the processor stops, but
may continue running.
You may or may not see a “slow clock” error message. In fact, if you are
using a state analyzer on the processor bus the status may never
change upon receiving the emulation module trigger (analysis arm).
This occurs because the qualified processor clock needed to switch the
state analyzer to the next state is stopped. For example, the state
analyzer before the arm event may have a status of “Occurrences
Remaining in Level 1: 1” and after the arm event it may have the same
status of “Occurrences Remaining in Level 1: 1”
8 If necessary, in the logic analyzer window, click Stop to complete
the measurement.
If you are using a timing analyzer or oscilloscope the measurement
should complete automatically when the processor halts. If you are
using a state logic analyzer, click Stop if needed to complete the
measurement.
214
Solutions for the Motorola 68360
10
Hardware Reference
215
Chapter 10: Hardware Reference
Hardware Reference
Hardware Reference
This chapter contains additional reference information including the
specifications and characteristics for the analysis probe and the
emulation probe, as well as signal mapping for the Agilent Technologies
E2448B analysis probe. It consists of the following information:
•
Analysis probe reference
•
Emulation module reference
216
Solutions for the Motorola 68360
Chapter 10: Hardware Reference
Analysis probe—operating characteristics
Analysis probe—operating characteristics
The following operating characteristics are not specifications, but are
typical operating characteristics for the Agilent Technologies E2448B
68360 analysis probe.
Operating Characteristics
Microcontrollers
Supported
Motorola 68360, 68EN360, 68MH360, and 68MH360V
Packages
Supported
241-pin PGA. With the Agilent Technologies E8123A, the 240pin QFP is supported.
Maximum
Clock Speed
33 MHz CLK
Probes
Required
6 required for disassembly.
12 are available.
Logic
Analyzers
Supported
Agilent Technologies 16600A, 16601A, 16602A, 16550A (one
or two cards), 16554A/55A/56A (two or three cards), 16555D/
56D/57D (two or three cards), 1660A/AS/C/CS/CP, 1661A/AS/
C/CS/CP, 1670A/D, 1671A/D
Accessories
Required
See chapter 1 for available accessories. A probe adapter
and a transition board are required. For address
reconstruction, the emulation module is required.
Optional
Accessories
An emulation module can be connected to the analysis
probe.
Operations
Displayed
All cycles with AS asserted.
All cycles with DS asserted.
All show cycles (address and data).
Additional
Capabilities
The logic analyzer captures all bus cycles, including
prefetches. Unexecuted prefetches are marked with a
hyphen “-” or question mark “?.”
Solutions for the Motorola 68360
217
Chapter 10: Hardware Reference
Analysis probe—operating characteristics
Electrical Characteristics
Power
Requirements
250 mA typical @ 5V, supplied by the logic analyzer.
CAT I Pollution degree 2.
Indoor Use Only
Signal Line
Loading
See diagrams on following page
Target System
Timing
Adjustable from 3.5 ns setup/0 s hold to 0 s setup/3.5 ns hold.
Environmental Characteristics (Operating)
Temperature
0 to + 50 degrees C
Altitude
4,600 m
Humidity
Up to 75% noncondensing. Avoid sudden, extreme
temperature changes which could cause condensation on
the circuit board.
For indoor use only.
218
Solutions for the Motorola 68360
Chapter 10: Hardware Reference
Analysis probe—operating characteristics
Signal line loading
The following figure shows the equivalent loads placed on the
microprocessor bus by the analysis probe. The loading is not affected
by the analysis probe operating mode.
Signal Line Loading
Solutions for the Motorola 68360
219
Chapter 10: Hardware Reference
Analysis probe—operating characteristics
Theory of operation and clocking
A block diagram of the Agilent Technologies E2448B is provided on the
following page.
State Analysis
For state analysis, the analysis probe uses CLK01, AS, and DS in
conjunction with a PAL to clock the logic analyzer. This allows the
disassembly of Show cycles and Fast Termination cycles without the
need for latches. The analysis probe also can recreate the upper bits
(A[31:28]) of the address bus if they are being used as Write Enables
(refer to “To download a configuration).
State-per-cycle Analysis
State-per-cycle analysis captures signals on every clock cycle. To
configure the logic analyzer for State-per-cycle analysis, change the
clock for each pod to a master clock, and set the clocks to rising or
falling edge. You can also adjust the setup/hold times to a desired
setting.
Timing Analysis
The logic analyzer provides the acquisition clock for timing analysis. All
signals are unbuffered, to prevent skew. Since the analysis probe
regenerates the upper address bits (A[31:24]) with a PAL, these bits
are not accurate in timing mode. However, they can be viewed on pod
J4 (CS/ADDR) where they are probed before they enter the PAL.
220
Solutions for the Motorola 68360
Chapter 10: Hardware Reference
Analysis probe—operating characteristics
Solutions for the Motorola 68360
221
Chapter 10: Hardware Reference
Analysis probe signal-to-connector mapping
Analysis probe signal-to-connector mapping
The following table shows the flow of signals from the microcontroller
through the E2448B connectors to the logic analyzer.
Connector
Connector
Pin
Analyzer Bit
68360 PGA
Pin #
Signal Name
J1odd
6
CLK1
*
Slave Clk
J1odd
J1odd
J1odd
J1odd
8
10
12
14
15
14
13
12
J16
K17
J18
K18
IFETCH
BGACK
BR
BG
STAT
STAT
STAT
STAT
~IFchS
~BGack
~BR
~BG
J1odd
J1odd
J1odd
J1odd
16
18
20
22
11
10
9
8
Q18
M18
C17
H18
RESETS
RESETH
FREEZE
OE
STAT
STAT
STAT
STAT
~RstS
~RstH
Freeze
~OE
J1odd
J1odd
J1odd
J1odd
24
26
28
30
7
6
5
4
P17
E2
D1
D2
RMC
FC3
FC2
FC1
STAT
STAT
STAT
STAT
~RMC
FCx
FCx
FCx
FC0
SIZ1
SIZ0
R/W_
STAT
STAT
STAT
STAT
FCx
SIZx
SIZx
Rd/~Wr
J1odd
32
3
E3
J1odd
34
2
C1
J1odd
36
1
B1
J1odd
38
0
D17
* These signals are generated by the analysis probe.
222
Analyzer Labels
SlvClk
Solutions for the Motorola 68360
Chapter 10: Hardware Reference
Analysis probe signal-to-connector mapping
Connector
Connector
Pin
AnalyzerBit
68360 PGA
Pin #
Signal Name
J1even
5
CLK1
*
Show Qual
J1even
J1even
J1even
J1even
7
9
11
13
15
14
13
12
J16
J1even
J1even
J1even
J1even
15
17
19
21
11
10
9
8
J1even
J1even
J1even
J1even
23
25
27
29
7
6
5
4
Analyzer Labels
SHOW
IFETCH
STAT
STAT
STAT
STAT
~IFchM
N16
P16
P18
Q17
AVEC
HALT
PERR
BERR
STAT
STAT
STAT
STAT
~AVEC
~Halt
~Perr
~Berr
E17
D18
G18
G16
DSACK1
DSACK0
IPIPE1
IPIP0
STAT
STAT
STAT
STAT
DSAckx
DSAckx
~IPip1
~IPip0
Ins Fetch
Fast Flush
Normal Flush
Normal
STAT
STAT
STAT
STAT
InstFe
FastFl
NormFl
Normal
J1even
31
3
*
J1even
33
2
*
J1even
35
1
*
J1even
37
0
*
* These signals are generated by the analysis probe.
Solutions for the Motorola 68360
223
Chapter 10: Hardware Reference
Analysis probe signal-to-connector mapping
Connector
Connector
Pin
AnalyzerBit
68360 PGA
Pin #
Signal Name
J2odd
6
CLK1
G17
AS
J2odd
J2odd
J2odd
J2odd
8
10
12
14
15
14
13
12
M2
M3
N1
N2
D15
D14
D13
D12
DATA
DATA
DATA
DATA
J2odd
J2odd
J2odd
J2odd
16
18
20
22
11
10
9
8
N3
P1
P2
P3
D11
D10
D9
D8
DATA
DATA
DATA
DATA
J2odd
J2odd
J2odd
J2odd
24
26
28
30
7
6
5
4
Q1
Q2
Q3
R1
D7
D6
D5
D4
DATA
DATA
DATA
DATA
J2odd
J2odd
J2odd
J2odd
32
34
36
38
3
2
1
0
R2
S1
R3
S2
D3
D2
D1
D0
DATA
DATA
DATA
DATA
224
Analyzer Labels
AS
Solutions for the Motorola 68360
Chapter 10: Hardware Reference
Analysis probe signal-to-connector mapping
Connector
Connector
Pin
AnalyzerBit
68360 PGA
Pin #
Signal Name
Analyzer Labels
J2even
5
CLK1
J1
CLK01
CLK01
J2even
J2even
J2even
J2even
7
9
11
13
15
14
13
12
F3
E1
F2
G3
D31
D30
D29
D28
DATA
DATA
DATA
DATA
J2even
J2even
J2even
J2even
15
17
19
21
11
10
9
8
F1
G2
H3
G1
D27
D26
D25
D24
DATA
DATA
DATA
DATA
J2even
J2even
J2even
J2even
23
25
27
29
7
6
5
4
H2
J3
H1
J2
D23
D22
D21
D20
DATA
DATA
DATA
DATA
J2even
J2even
J2even
J2even
31
33
35
37
3
2
1
0
L1
L2
L3
M1
D19
D18
D17
D16
DATA
DATA
DATA
DATA
Solutions for the Motorola 68360
CLK01
225
Chapter 10: Hardware Reference
Analysis probe signal-to-connector mapping
Connector
Connector
Pin
AnalyzerBit
68360 PGA
Pin #
Signal Name
J3odd
6
CLK1
C18
DS
J3odd
J3odd
J3odd
J3odd
8
10
12
14
15
14
13
12
A8
C9
B9
A9
A15
A14
A13
A12
ADDR
ADDR
ADDR
ADDR
J3odd
J3odd
J3odd
J3odd
16
18
20
22
11
10
9
8
A10
B10
A11
C10
A11
A10
A9
A8
ADDR
ADDR
ADDR
ADDR
J3odd
J3odd
J3odd
J3odd
24
26
28
30
7
6
5
4
B11
A12
B12
C11
A7
A6
A5
A4
ADDR
ADDR
ADDR
ADDR
J3odd
J3odd
J3odd
J3odd
32
34
36
38
3
2
1
0
A13
A14
B13
C12
A3
A2
A1
A0
ADDR
ADDR
ADDR
ADDR
226
Analyzer Labels
DS
Solutions for the Motorola 68360
Chapter 10: Hardware Reference
Analysis probe signal-to-connector mapping
Connector
Connector
Pin
AnalyzerBit
68360 PGA
Pin #
Signal Name
Analyzer Labels
J3even
5
CLK1
C17
FREEZE
FREEZE
J3even
J3even
J3even
J3even
7
9
11
13
15
14
13
12
*
*
*
*
A31
A30
A29
A28
ADDR
ADDR
ADDR
ADDR
J3even
J3even
J3even
J3even
15
17
19
21
11
10
9
8
*
*
*
*
A27
A26
A25
A24
ADDR
ADDR
ADDR
ADDR
J3even
J3even
J3even
J3even
23
25
27
29
7
6
5
4
C6
B6
A6
C7
A23
A22
A21
A20
ADDR
ADDR
ADDR
ADDR
A19
A18
A17
A16
ADDR
ADDR
ADDR
ADDR
J3even
31
3
B7
J3even
33
2
A7
J3even
35
1
C8
J3even
37
0
B8
* These signals are generated by the analysis probe.
Solutions for the Motorola 68360
227
Chapter 10: Hardware Reference
Analysis probe signal-to-connector mapping
Connector
Connector
Pin
AnalyzerBit
68360 PGA
Pin #
Signal Name
J4odd
6
CLK1
L17
BKPT/DSCLK
DSCLK
J4odd
J4odd
J4odd
J4odd
8
10
12
14
15
14
13
12
-C4
B3
H17
-MODCK1
MODCK0
BCLR0
MODckx
MODckx
~BCLR0
J4odd
J4odd
J4odd
J4odd
16
18
20
22
11
10
9
8
A15
E18
F16
F17
TRIS
PRTY3
PRTY2
PRTY1
~TRIS
PRTYx
PRTYx
PRTYx
J4odd
J4odd
J4odd
J4odd
24
26
28
30
7
6
5
4
F18
B14
L18
Q16
PRTY0
IRQ7
IRQ6
IRQ5
PRTYx
~IRQ
~IRQ
~IRQ
J4odd
J4odd
J4odd
J4odd
32
34
36
38
3
2
1
0
K16
R17
S18
R18
IRQ4
IRQ3
IRQ2
IRQ1
~IRQ
~IRQ
~IRQ
~IRQ
228
Analyzer Labels
Solutions for the Motorola 68360
Chapter 10: Hardware Reference
Analysis probe signal-to-connector mapping
Connector
Connector
Pin
AnalyzerBit
68360 PGA
Pin #
Signal Name
Analyzer Labels
J4even
5
CLK1
J4even
J4even
J4even
J4even
7
9
11
13
15
14
13
12
E4
D3
C2
B2
A31/WE0
A30/WE1
A29/WE2
A28/WE3
A31-24
A31-24
A31-24
A31-24
J4even
J4even
J4even
J4even
15
17
19
21
11
10
9
8
C5
A4
B5
A5
A27
A26
A25
A24
A31-24
A31-24
A31-24
A31-24
J4even
J4even
J4even
J4even
23
25
27
29
7
6
5
4
C13
A16
B15
C14
CS7
CS6
CS5
CS4
~CSx
~CSx
~CSx
~CSx
J4even
J4even
J4even
J4even
31
33
35
37
3
2
1
0
A17
B16
C15
A18
CS3
CS2
CS1
CS0
~CSx
~CSx
~CSx
~CSx
Solutions for the Motorola 68360
~WE0-3
~WE0-3
~WE0-3
~WE0-3
229
Chapter 10: Hardware Reference
Analysis probe signal-to-connector mapping
Connector
Connector
Pin
AnalyzerBit
68360 PGA
Pin #
Signal Name
J5odd
6
CLK1
J5odd
J5odd
J5odd
J5odd
8
10
12
14
15
14
13
12
T1
R4
S3
T2
PA15
PA14
PA13
PA12
PA15-0
PA15-0
PA15-0
PA15-0
J5odd
J5odd
J5odd
J5odd
16
18
20
22
11
10
9
8
R5
S4
T3
R6
PA11
PA10
PA9
PA8
PA15-0
PA15-0
PA15-0
PA15-0
J5odd
J5odd
J5odd
J5odd
24
26
28
30
7
6
5
4
S5
T4
S6
R7
PA7
PA6
PA5
PA4
PA15-0
PA15-0
PA15-0
PA15-0
J5odd
J5odd
J5odd
J5odd
32
34
36
38
3
2
1
0
T5
T6
S7
R8
PA3
PA2
PA1
PA0
PA15-0
PA15-0
PA15-0
PA15-0
230
Analyzer Labels
Solutions for the Motorola 68360
Chapter 10: Hardware Reference
Analysis probe signal-to-connector mapping
Connector
Connector
Pin
AnalyzerBit
68360 PGA
Pin #
Signal Name
J5even
5
CLK1
J5even
J5even
J5even
J5even
7
9
11
13
15
14
13
12
T8
R9
S9
T9
PB15
PB14
PB13
PB12
PB17-0
PB17-0
PB17-0
PB17-0
J5even
J5even
J5even
J5even
15
17
19
21
11
10
9
8
T10
S10
R10
T11
PB11
PB10
PB9
PB8
PB17-0
PB17-0
PB17-0
PB17-0
J5even
J5even
J5even
J5even
23
25
27
29
7
6
5
4
S11
R11
T12
S12
PB7
PB6
PB5
PB4
PB17-0
PB17-0
PB17-0
PB17-0
J5even
J5even
J5even
J5even
31
33
35
37
3
2
1
0
R12
T13
S13
R13
PB3
PB2
PB1
PB0
PB17-0
PB17-0
PB17-0
PB17-0
Solutions for the Motorola 68360
Analyzer Labels
231
Chapter 10: Hardware Reference
Analysis probe signal-to-connector mapping
Connector
Connector
Pin
AnalyzerBit
J6odd
6
CLK1
J6odd
J6odd
J6odd
J6odd
8
10
12
14
15
14
13
12
T14
S14
--PC11
PC10
J6odd
J6odd
J6odd
J6odd
16
18
20
22
11
10
9
8
T15
R14
S15
T16
PC9
PC8
PC7
PC6
PC11-0
PC11-0
PC11-0
J6odd
J6odd
J6odd
J6odd
24
26
28
30
7
6
5
4
T17
R15
S16
T18
PC5
PC4
PC3
PC2
PC11-0
PC11-0
PC11-0
PC11-0
J6odd
J6odd
J6odd
J6odd
32
34
36
38
3
2
1
0
S17
R16
T7
S8
PC1
PC0
PB17
PB16
PC11-0
PC11-0
PB17-0
PB17-0
232
68360 PGA
Pin #
Signal Name
Analyzer Labels
PC11-0
PC11-0
PC11-0
Solutions for the Motorola 68360
Chapter 10: Hardware Reference
Analysis probe signal-to-connector mapping
Connector
Connector
Pin
AnalyzerBit
68360 PGA
Pin #
Signal Name
J6even
5
CLK1
M17
TCK
J6even
J6even
J6even
J6even
7
9
11
13
15
14
13
12
TRST
TMS
TDO
TDI
~TRST
TMS
TDO
TDI
J6even
J6even
J6even
J6even
15
17
19
21
11
10
9
8
L16
N18
N17
M16
C
16
B17
B18
D16
CAS3
CAS2
CAS1
CAS0
~CASx
~CASx
~CASx
~CASx
J6even
J6even
J6even
J6even
23
25
27
29
7
6
5
4
J6even
J6even
J6even
J6even
31
33
35
37
3
2
1
0
Solutions for the Motorola 68360
Analyzer Labels
233
Chapter 10: Hardware Reference
Emulation module—operating characteristics
Emulation module—operating characteristics
The following operating characteristics are not specifications, but are
typical operating characteristics for the Agilent Technologies 16610A
emulation module and CPU32 target interface module.
Operating Characteristics
Motorola 68330, 68331, 68332, 68F333, 68334, 68335,
68336, 68338, 68340, 68341, 68349, 68360, or 68376
Microprocessor
Compatibility
Environmental
Characteristics
(Temperature, Altitude,
Humidity)
234
microprocessors operating at clock speeds up to
25 MHz.
The emulator supports both 5V and 3.3V
operation.
The Agilent Technologies 16610A emulation
module meets the environmental characteristics
of the logic analysis system in which it is installed.
For indoor use only.
Solutions for the Motorola 68360
Chapter 10: Hardware Reference
Emulation module—electrical characteristics
Emulation module—electrical characteristics
Characteristic
Symbol
Value
Unit
Supply Voltage from Target
VDD
-0.3 to +5.5
V
Characteristic
Symbol
VDD = 5 Volts
Min
Max
Input Current (VDD)
Iil
Input Voltage
Vin
VSS-0.5
VDD+0.5
Input High Voltage
Vih
2
Input Low Voltage
Vil
VSS-0.5
Input High Current
Iih
Input Low Current
VDD = 3.3 Volts
Min
10
Unit
Max
6
mA
VSS-0.5
VDD+0.5
V
VDD+0.5
2
VDD+0.5
V
0.8
VSS-0.5
0.8
V
-20
-15
µA
Iil
0.6
0.35
mA
Input Capacitance
Cin
40
40
pF
Output High Voltage (BKPT,IFETCH/DSI)*
Voh
3.86
3
V
Output High Current (BKPT,IFETCH/DSI)
Ioh
-4
-2
mA
Output Low Voltage (BKPT,IFETCH/DSI)
Vol
0.4
0.4
V
Output Low Current (BKPT,IFETCH/DSI)
Iol
3.4
3.4
mA
Output Low Voltage (BERR,RESET),
Iol = 12 mA*
Vol
0.4
0.4
V
Output Low Voltage (BERR, RESET),
Iol = 24 mA*
Vol
0.5
0.5
V
*The Voh specification for BERR and RESET is not applicable because
they are OPEN-collector outputs.
Input-only pins: VDD, DS, FREEZE, I_PIPE/DSO
Output-only pins: BKPT
Input/output pins: IFETCH/DSI, BERR, RESET
Solutions for the Motorola 68360
235
236
Solutions for the Motorola 68360
11
General-Purpose ASCII (GPA) Symbol
File Format
237
Chapter 11: General-Purpose ASCII (GPA) Symbol File Format
General-Purpose ASCII (GPA) Symbol File Format
General-Purpose ASCII (GPA) Symbol File
Format
General-purpose ASCII (GPA) format files are loaded into a logic
analyzer just like other object files, but they are usually created
differently.
If your compiler is not one of those listed on page 110, if your compiler
does not include symbol information in the output, or if you want to
define a symbol not in the object file, you can create an ASCII format
symbol file.
Typically, ASCII format symbol files are created using text processing
tools to convert compiler or linker map file output that has symbolic
information into the proper format.
You can typically get symbol table information from a linker map file to
create a General-Purpose ASCII (GPA) symbol file.
Various kinds of symbols are defined in different records in the GPA
file. Record headers are enclosed in square brackets; for example,
[VARIABLES]. For a summary of GPA file records and associated
symbol definition syntax, refer to the “GPA Record Format Summary”
that follows.
Each entry in the symbol file must consist of a symbol name followed
by an address or address range.
While symbol names can be very long, the logic analyzer only uses the
first 16 characters.
The address or address range corresponding to a given symbol appears
as a hexadecimal number. The address or address range must
immediately follow the symbol name, appear on the same line, and be
separated from the symbol name by one or more blank spaces or tabs.
Ensure that address ranges are in the following format:
beginning address..ending address
238
Solutions for the Motorola 68360
Chapter 11: General-Purpose ASCII (GPA) Symbol File Format
General-Purpose ASCII (GPA) Symbol File Format
Example
main
test
var1
00001000..00001009
00001010..0000101F
00001E22
#this is a variable
This example defines two symbols that correspond to address
ranges and one point symbol that corresponds to a single address.
For more detailed descriptions of GPA file records and associated
symbol definition syntax, refer to these topics that follow:
•
SECTIONS
•
FUNCTIONS
•
VARIABLES
•
SOURCE LINES
•
START ADDRESS
•
Comments
Solutions for the Motorola 68360
239
Chapter 11: General-Purpose ASCII (GPA) Symbol File Format
General-Purpose ASCII (GPA) Symbol File Format
GPA Record Format Summary
[SECTIONS]
section_name start..end attribute
[FUNCTIONS]
func_name start..end
[VARIABLES]
var_name start [size]
var_name start..end
[SOURCE LINES]
File: file_name
line# address
[START ADDRESS]
address
#Comments
If no record header is specified, [VARIABLES] is assumed. Lines
without a preceding header are assumed to be symbol definitions in
one of the VARIABLES formats.
Example
This is an example GPA file that contains several different kinds of
records:
[SECTIONS]
prog
00001000..0000101F
data
40002000..40009FFF
common
FFFF0000..FFFF1000
[FUNCTIONS]
main
00001000..00001009
test
00001010..0000101F
[VARIABLES]
total
40002000
value
40008000
240
4
4
Solutions for the Motorola 68360
Chapter 11: General-Purpose ASCII (GPA) Symbol File Format
General-Purpose ASCII (GPA) Symbol File Format
[SOURCE LINES]
File: main.c
10
00001000
11
00001002
14
0000100A
22
0000101E
File: test.c
5
00001010
7
00001012
11
0000101A
Solutions for the Motorola 68360
241
Chapter 11: General-Purpose ASCII (GPA) Symbol File Format
General-Purpose ASCII (GPA) Symbol File Format
SECTIONS
[SECTIONS]
section_name
start..end
attribute
Use SECTIONS to define symbols for regions of memory, such as
sections, segments, or classes.
section_name A symbol representing the name of the section.
start The first address of the section, in hexadecimal.
end The last address of the section, in hexadecimal.
attribute This is optional, and may be one of the following:
•
NORMAL (default)—The section is a normal, relocatable section, such as
code or data.
•
NONRELOC—The section contains variables or code that cannot be
relocated; this is an absolute segment.
Define sections first
To enable section relocation, section definitions must appear before any other
definitions in the file.
Example
[SECTIONS]
prog
data
display_io
00001000..00001FFF
00002000..00003FFF
00008000..0000801F
NONRELOC
If you use section definitions in a GPA symbol file, any subsequent
function or variable definitions must be within the address ranges of
one of the defined sections. Functions and variables that are not within
the range are ignored.
242
Solutions for the Motorola 68360
Chapter 11: General-Purpose ASCII (GPA) Symbol File Format
General-Purpose ASCII (GPA) Symbol File Format
FUNCTIONS
[FUNCTIONS]
func_name start..end
Use FUNCTIONS to define symbols for program functions, procedures,
or subroutines.
func_name A symbol representing the function name.
start The first address of the function, in hexadecimal.
end The last address of the function, in hexadecimal.
Example
[FUNCTIONS]
main
00001000..00001009
test
00001010..0000101F
Solutions for the Motorola 68360
243
Chapter 11: General-Purpose ASCII (GPA) Symbol File Format
General-Purpose ASCII (GPA) Symbol File Format
VARIABLES
[VARIABLES]
var_name
start [size]
var_name
start..end
You can specify symbols for variables either by using the address of the
variable, the address and the size of the variable, or a range of
addresses occupied by the variable. If you specify only the address of a
variable, the size is assumed to be one byte.
var_name A symbol representing the variable name.
start The first address of the variable, in hexadecimal.
end The last address of the variable, in hexadecimal.
size This is optional, and indicates the size of the variable, in bytes, in
decimal.
Example
[VARIABLES]
subtotal
total
data_array
status_char
244
40002000
4
40002004
4
40003000..4000302F
40002345
Solutions for the Motorola 68360
Chapter 11: General-Purpose ASCII (GPA) Symbol File Format
General-Purpose ASCII (GPA) Symbol File Format
SOURCE LINES
[SOURCE LINES]
File: file_name
line# address
Use SOURCE LINES to associate addresses with lines in your source
files.
file_name The name of a file.
line# The number of a line in the file, in decimal.
address The address of the source line, in hexadecimal.
Example
[SOURCE LINES]
File: main.c
10
00001000
11
00001002
14
0000100A
22
0000101E
Solutions for the Motorola 68360
245
Chapter 11: General-Purpose ASCII (GPA) Symbol File Format
General-Purpose ASCII (GPA) Symbol File Format
START ADDRESS
[START ADDRESS]
address
address The address of the program entry point, in hexadecimal.
Example
[START ADDRESS]
00001000
Comments
#comment text
Use the # character to include comments in a file. Any text following
the # character is ignored. You can put comments on a line alone or on
the same line following a symbol entry.
Example
#This is a comment.
246
Solutions for the Motorola 68360
12
Troubleshooting the Analysis Probe
247
Chapter 12: Troubleshooting the Analysis Probe
Troubleshooting the Analysis Probe
Troubleshooting the Analysis Probe
If you encounter difficulties while making measurements, use this
chapter to guide you through some possible solutions. Each heading
lists a problem you may encounter, along with some possible solutions.
If you still have difficulty using the analyzer after trying the suggestions
in this chapter, please contact your local Agilent Technologies service
center.
CAUTION:
When you are working with the analyzer, be sure to power down both the
analyzer and the target system before disconnecting or connecting cables,
probes, and analysis probes. Otherwise, you may damage circuitry in the
analyzer, analysis probe, or target system.
248
Solutions for the Motorola 68360
Chapter 12: Troubleshooting the Analysis Probe
Logic Analyzer Problems
Logic Analyzer Problems
This section lists general problems that you might encounter while
using the logic analyzer.
Intermittent data errors
This problem is usually caused by poor connections, incorrect signal
levels, or marginal timing.
❏ Remove and reseat all cables and probes, ensuring that there are no bent
pins on the analysis probe or poor probe connections.
❏ Adjust the threshold level of the data pod to match the logic levels in the
system under test.
❏ Use an oscilloscope to check the signal integrity of the data lines.
Clock signals for the state analyzer must meet particular pulse shape
and timing requirements. Data inputs for the analyzer must meet pulse
shape and setup and hold time requirements.
See Also
See Capacitive Loading in this chapter for information on other
sources of intermittent data errors.
Solutions for the Motorola 68360
249
Chapter 12: Troubleshooting the Analysis Probe
Logic Analyzer Problems
Unwanted triggers
Unwanted triggers can be caused by instructions that were fetched but
not executed.
❏ Add the prefetch queue or pipeline depth to the trigger address to avoid
this problem.
The logic analyzer captures prefetches, even if they are not executed.
When you are specifying a trigger condition or a storage qualification
that follows an instruction that may cause branching, an unused
prefetch may generate an unwanted trigger.
No activity on activity indicators
❏ Check for loose cables, board connections, and analysis probe connections.
❏ Check for bent or damaged pins on the analysis probe.
No trace list display
If there is no trace list display, it may be that your trigger specification
is not correct for the data you want to capture, or that the trace
memory is only partially filled.
❏ Check your trigger sequencer specification to ensure that it will capture
the events of interest.
❏ Try stopping the analyzer; if the trace list is partially filled, this should
display the contents of trace memory.
250
Solutions for the Motorola 68360
Chapter 12: Troubleshooting the Analysis Probe
Logic Analyzer Problems
Analyzer won’t power up
If logic analyzer power is cycled when the logic analyzer is connected
to a target system or emulation probe that remains powered up, the
logic analyzer may not be able to power up. Some logic analyzers are
inhibited from powering up when they are connected to a target
system or emulation probe that is already powered up.
❏ Remove power from the target system, then disconnect all logic analyzer
cabling from the analysis probe. This will allow the logic analyzer to power
up. Reconnect logic analyzer cabling after power up.
Solutions for the Motorola 68360
251
Chapter 12: Troubleshooting the Analysis Probe
Analysis Probe Problems
Analysis Probe Problems
This section lists problems that you might encounter when using an
analysis probe. If the solutions suggested here do not correct the
problem, you may have a damaged analysis probe. Contact your local
Agilent Technologies Sales Office if you need further assistance.
Target system will not boot up
If the target system will not boot up after connecting the analysis
probe, the microcontroller (if socketed) or the analysis probe may not
be installed properly, or they may not be making electrical contact.
❏ Ensure that you are following the correct power-on sequence for the
analysis probe and target system.
1 Power up the analyzer and analysis probe.
2 Power up the target system.
If you power up the target system before you power up the analysis
probe, interface circuitry in the analysis probe may latch up and
prevent proper target system operation.
❏ Verify that the microcontroller and the analysis probe are properly rotated
and aligned, so that the index pin on the microcontroller (pin A1) matches
the index pin on the analysis probe.
❏ Verify that the microcontroller and the analysis probe are securely inserted
into their respective sockets.
❏ Verify that the logic analyzer cables are in the proper sockets of the
analysis probe and are firmly inserted.
252
Solutions for the Motorola 68360
Chapter 12: Troubleshooting the Analysis Probe
Analysis Probe Problems
Erratic trace measurements
❏ Do a full reset of the target system before beginning the measurement.
Some analysis probe designs require a full reset to ensure correct
configuration.
❏ Ensure that your target system meets the timing requirements of the
processor with the analysis probe installed.
See Capacitive loading in this chapter. While analysis probe loading is
slight, pin protectors, extenders, and adapters may increase it to
unacceptable levels. If the target system design has close timing
margins, such loading may cause incorrect processor functioning and
give erratic trace results.
❏ Ensure that you have sufficient cooling for the microcontroller.
Ensure that you have ambient temperature conditions and airflow that
meet or exceed the requirements of the microcontroller manufacturer.
Capacitive loading
Excessive capacitive loading can degrade signals, resulting in incorrect
capture by the analysis probe, or system lockup in the microcontroller.
All analysis probe add additional capacitive loading, as can custom
probe fixtures you design for your application.
Careful layout of your target system can minimize loading problems
and result in better margins for your design. This is especially
important for systems that are running at frequencies greater than 50
MHz.
❏ Remove as many pin protectors, extenders, and adapters as possible.
❏ If multiple analysis probe solutions are available, use one with lower
capacitive loading.
Solutions for the Motorola 68360
253
Chapter 12: Troubleshooting the Analysis Probe
Inverse Assembler Problems
Inverse Assembler Problems
This section lists problems that you might encounter while using the
inverse assembler.
When you obtain incorrect inverse assembly results, it may be unclear
whether the problem is in the analysis probe or in your target system. If
you follow the suggestions in this section to ensure that you are using
the analysis probe and inverse assembler correctly, you can proceed
with confidence in debugging your target system.
No inverse assembly or incorrect inverse
assembly
This problem may be due to incorrect synchronization, modified
configuration, incorrect connections, or a hardware problem in the
target system. A locked status line can cause incorrect or incomplete
inverse assembly.
❏ Ensure that each logic analyzer pod is connected to the correct analysis
probe connector.
There is not always a one-to-one correspondence between analyzer
pod numbers and analysis probe cable numbers. Analysis Probes must
supply address (ADDR), data (DATA), and status (STAT) information
to the analyzer in a predefined order. The cable connections for each
analysis probe are often altered to support that need. Thus, one
analysis probe might require that you connect cable 2 to analyzer pod
2, while another will require you to connect cable 5 to analyzer pod 2.
See Chapter 3 for connection information.
❏ Check the activity indicators for status lines locked in a high or low state.
❏ Verify that the STAT, DATA, and ADDR format labels have not been
modified from their default values.
These labels must remain as they are configured by the configuration
254
Solutions for the Motorola 68360
Chapter 12: Troubleshooting the Analysis Probe
Inverse Assembler Problems
file. Do not change the names of these labels or the bit assignments
within the labels. Some analysis probes also require other data labels.
See Chapter 10, “Hardware Reference,” beginning on page 215 for
more information.
Inverse assembler will not load or run
You need to ensure that you have the correct system software loaded
on your analyzer.
❏ Ensure that the inverse assembler is on the same disk as the configuration
files you are loading.
Configuration files for the state analyzer contain a pointer to the name
of the corresponding inverse assembler. If you delete the inverse
assembler or rename it, the configuration process will fail to load the
disassembler.
See Chapter 4, “Analyzing the 68360 with a Logic Analyzer,” beginning
on page 83 for details.
Solutions for the Motorola 68360
255
Chapter 12: Troubleshooting the Analysis Probe
Intermodule Measurement Problems
Intermodule Measurement Problems
Some problems occur only when you are trying to make a
measurement involving multiple modules.
An event wasn’t captured by one of the
modules
If you are trying to capture an event that occurs very shortly after the
event that arms one of the measurement modules, it may be missed
due to internal analyzer delays. For example, suppose you set an
oscilloscope module to trigger upon receiving a trigger signal from the
logic analyzer because you are trying to capture a pulse that occurs
right after the analyzer’s trigger state. If the pulse occurs too soon after
the analyzer’s trigger state, the oscilloscope will miss the pulse.
❏ Adjust the skew in the Intermodule menu.
You may be able to specify a skew value that enables the event to be
captured.
❏ Change the trigger specification for modules upstream of the one with the
problem.
If you are using a logic analyzer to trigger an oscilloscope module, try
specifying a trigger state one state before the one you are using. This
may be more difficult than working with the skew because the prior
state may occur more often and not always be related to the event you
are trying to capture with the oscilloscope.
256
Solutions for the Motorola 68360
Chapter 12: Troubleshooting the Analysis Probe
Analysis Probe Messages
Analysis Probe Messages
This section lists some of the messages that the analyzer displays when
it encounters a problem.
“. . . Inverse Assembler Not Found”
This error occurs if you rename or delete the inverse assembler file
that is attached to the configuration file.
Ensure that the inverse assembler file is not renamed or deleted, and
that it is located in the correct directory:
•
For Agilent Technologies 16600A/700A-series logic analysis systems it
should be in /logic/ia.
•
For other logic analyzers it should be in the same directory as the
configuration file.
Solutions for the Motorola 68360
257
Chapter 12: Troubleshooting the Analysis Probe
Analysis Probe Messages
“Measurement Initialization Error”
This error occurs when you have installed the cables incorrectly for
one or two Agilent Technologies 16550A logic analysis cards. The
following diagrams show the correct cable connections for one-card
and two-card installations. Ensure that your cable connections match
the silk screening on the card, and that they are fully seated in the
connectors. Then, repeat the measurement.
Cable Connections for One-Card Agilent Technologies 16550A
Installations
258
Solutions for the Motorola 68360
Chapter 12: Troubleshooting the Analysis Probe
Analysis Probe Messages
Cable Connections for Two-Card Agilent Technologies 16550A
Installations
See Also
The Agilent Technologies 16550A 100-MHz State/500-MHz Timing
Logic Analyzer Service Guide.
“No Configuration File Loaded”
This is usually caused by trying to load a configuration file for one type
of module/system into a different type of module/system.
❏ Verify that the appropriate module has been selected from the Load
{module} from File {filename} in the disk operation menu. Selecting Load
{All} will cause incorrect operation when loading most analysis probe
configuration files.
See Also
Chapter 3 describes how to load configuration files.
Solutions for the Motorola 68360
259
Chapter 12: Troubleshooting the Analysis Probe
Analysis Probe Messages
“Selected File is Incompatible”
This occurs when you try to load a configuration file for the wrong
module. Ensure that you are loading the appropriate configuration file
for your logic analyzer.
“Slow or Missing Clock”
❏ This error message might occur if the logic analyzer cards are not firmly
seated in the logic analysis system frame. Ensure that the cards are firmly
seated.
❏ This error might occur if the target system is not running properly. Ensure
that the target system is on and operating properly.
❏ If the error message persists, check that the logic analyzer pods are
connected to the proper connectors on the analysis probe. See Chapter 3
to determine the proper connections.
“Time from Arm Greater Than 41.93 ms”
The Agilent Technologies 16550A state/timing analyzers have a counter
to keep track of the time from when an analyzer is armed to when it
triggers. The width and clock rate of this counter allow it to count for
up to 41.93 ms before it overflows. Once the counter has overflowed,
the system does not have the data it needs to calculate the time
between module triggers. The system must know this time to be able to
display data from multiple modules on a single screen.
260
Solutions for the Motorola 68360
Chapter 12: Troubleshooting the Analysis Probe
Analysis Probe Messages
“Waiting for Trigger”
If a trigger pattern is specified, this message indicates that the
specified trigger pattern has not occurred. Verify that the triggering
pattern is correctly set.
❏ When analyzing microcontrollers that fetch only from word-aligned
addresses, ensure that the trigger condition is set to look for an opcode
fetch at an address corresponding to a word boundary.
Solutions for the Motorola 68360
261
Chapter 12: Troubleshooting the Analysis Probe
Returning Parts to Agilent Technologies for Service
Returning Parts to Agilent Technologies for
Service
The repair strategy for this emulation solution is board replacement.
Exchange assemblies are available when a repairable assembly is
returned to Agilent Technologies. These assemblies have been set up
on the “Exchange Assembly” program. This lets you exchange a faulty
assembly with one that has been repaired, calibrated, and performance
verified by the factory. The cost is significantly less than that of a new
assembly.
To return a part to Agilent Technologies
1 Follow the procedures in this chapter to make sure that the
problem is caused by a hardware failure, not by configuration or
cabling problems.
2 In the U.S., call 1-800-403-0801. Outside the U.S., call your
nearest Agilent Technologies sales office. Ask them for the
address of the nearest Agilent Technologies service center.
3 Package the part and send it to the Agilent Technologies service
center.
Keep any parts which you know are working. For example, if only the
target interface module is broken, keep the emulation module and
cables.
4 When the part has been replaced, it will be sent back to you.
The unit returned to you will have the same serial number as the unit
you sent to Agilent Technologies.
The Agilent Technologies service center can also troubleshoot the
hardware and replace the failed part. To do this, send your entire
262
Solutions for the Motorola 68360
Chapter 12: Troubleshooting the Analysis Probe
Returning Parts to Agilent Technologies for Service
measurement system to the service center, including the logic analysis
system, analysis probe, and cables.
In some parts of the world, on-site repair service is available. Ask the
Agilent Technologies sales or service representative for details.
To obtain replacement parts
The following table lists some parts that may be replaced if they are
damaged or lost. Contact your nearest Agilent Technologies Sales
Office for further information.
Analysis Probe Replaceable Parts
Replaceable Parts
Agilent Part
Number
Description
Agilent Technologies E2448B
E2448-66506
Motorola 68360 Interface Circuit Card
1200-1828
Pin Protector
E2448-68703
Configuration and Inverse Assembler Software
E5346A
High density termination adapter cable
Agilent Technologies E8123A (includes Agilent Technologies E2448B
E5363A
240-pin QFP Elastomer
E5372A
Flex adapter
E8124A
Transition board
Solutions for the Motorola 68360
263
Chapter 12: Troubleshooting the Analysis Probe
Cleaning the Instrument
Cleaning the Instrument
If the instrument requires cleaning:
1 Remove power from the instrument.
2 Clean the instrument with a mild detergent and water.
3 Make sure that the instrument is completely dry before
reconnecting it to a power source.
264
Solutions for the Motorola 68360
13
Troubleshooting the Emulation
Module
265
Chapter 13: Troubleshooting the Emulation Module
Solving Problems
Solving Problems
If you have problems with the emulation module, your first task is to
determine the source of the problem. Problems may originate in any of
the following places:
•
The connection between the emulation module and your debugger
•
The emulation module itself
•
The connection between the emulation module and the target interface
module
•
The connection between the target interface module and the target system
•
The target system
You can use several means to determine the source of the problem:
•
The troubleshooting guide on the next page
•
The status lights on the emulation module
•
The emulation module "performance verification" tests
•
The emulation module's built-in commands
266
Solutions for the Motorola 68360
Chapter 13: Troubleshooting the Emulation Module
Solving Problems
Troubleshooting Guide
Common problems and what to do about them
Symptom
What to do
Commands from the Emulation
Control Interface have no effect
Commands from debugger have
no effect
Check that you are using the correct firmware.
Emulator built-in commands do
not work
"Slow or missing clock" message
after a logic analyzer run
"Slow clock" message in the
Emulation Control Interface or
"c>" prompt in the built-in
“terminal interface”
Some commands fail
See also
Use the Emulation Control Interface to try a few built-in
commands. If this works, your debugger may not be
configured properly. If this does not work, continue with
the steps for the next symptom....
1 Check that the emulator has been properly configured
for your target system.
2 Run the emulator performance verification tests.
3 If the performance verification tests pass, then there is
an electrical problem with the connection to the target
processor OR the target system may not have been
designed according to "Designing a Target System."
Check that the target system is running user code or is in
reset. (This message can appear if the processor is in
background mode.)
Check that the clock rate is properly configured.
page 149
Check the "restrict to real-time runs" configuration
page 154
Solutions for the Motorola 68360
page 269
page 144
page 276
page 128
page 274
267
Chapter 13: Troubleshooting the Emulation Module
Emulation Module Status Lights
Emulation Module Status Lights
The emulation module uses status lights to communicate various
modes and error conditions.
The following table gives more information about the meaning of the
power and target status lights.
❍ = LED is off
● = LED is on
✳ = Not applicable (LED is off or on)
Power/Target Status Lights
Pwr/Target
LEDs
Meaning
❍ Reset
❍ Break
❍ Run
No target system power, or emulation module is not
connected to the target system
● Reset
❍ Break
❍ Run
Target system is in a reset state
❍ Reset
● Break
❍ Run
The target processor is executing in Debug Mode
❍ Reset
❍ Break
● Run
The target processor is executing user code
❍ Reset
● Break
● Run
Only boot firmware is good (other firmware has been
corrupted)
268
Solutions for the Motorola 68360
Chapter 13: Troubleshooting the Emulation Module
Emulation Module Built-in Commands
Emulation Module Built-in Commands
The emulation module has some built-in commands (sometimes called
the “terminal interface”) which you can use for troubleshooting.
You can enter the built-in commands using:
•
A telnet (LAN) connection
•
The Command Line window in the Emulation Control Interface
•
A “debugger command” window in your debugger
To telnet to the emulation module
You can establish a telnet connection to the emulation module if:
•
A host computer and the logic analysis system are both connected to a
local-area network (LAN), and
•
The host computer has the telnet program (often part of the operating
system or an internet software package).
To establish a telnet connection:
1 Find out the port number of the emulation module.
The default port number of the first emulation module in an Agilent
Technologies 16600A/700A series logic analysis system is 6472. The
default port of a second module in an Agilent Technologies 16600Aseries system is 6476. The default port numbers of a third and fourth
module in an expansion frame are 6480 and 6484. These port numbers
can be changed, but that is rarely necessary.
2 Find out the LAN address or LAN name of the logic analysis
system.
3 Start the telnet program.
If the LAN name of the logic analysis system is “test2” and you have
Solutions for the Motorola 68360
269
Chapter 13: Troubleshooting the Emulation Module
Emulation Module Built-in Commands
only one emulation module installed, the command might look like this:
telnet test2 6472
4 If you do not see a prompt, press the <Return> key a few times.
To exit from this telnet session, type <CTRL>D at the prompt.
To use the built-in commands
Here are a few commonly used built-in commands:
Useful built-in commands
b
cf
help
init
lan
m
pp load
reg
r
rep
rst
s
sync diff
sync emsim
sync sim
ver
270
Break—go into the background monitor state
Configuration—read or write configuration options
Help—display online help for built-in commands
Initialize—init -c re-initializes everything in the emulation module
except for the LAN software; init -p is the equivalent of cycling
power (it will break LAN connections)
configure LAN address (emulation probes only)
Memory—read or write memory
Load EMSIM values into preprocessor
Register—read or write a register
Run—start running user code
Repeat—repeat a command or group of commands
Reset—reset the target processor (the emulation module will wait
for you to press the target’s RESET button)
Step—do a low-level single step
Compare EMSIM with SIM registers
Copy EMSIM to SIM registers
Copy SIM to EMSIM registers
Version—display the product number and firmware version of the
emulation module
Solutions for the Motorola 68360
Chapter 13: Troubleshooting the Emulation Module
Emulation Module Built-in Commands
The prompt indicates the status of the emulation module:
Emulation module prompts
U
M
p
R
r
?
Running user program
Running in background monitor
No target power
Emulation reset
Target reset
Unknown state
Examples
To set register R0, then view R0 to verify that it was set, enter:
R>rst
M>reg
M>reg
reg
-m
r0=ffff
r0
R0=0000ffff
To break execution then step a single instruction, enter:
M>b
M>s
PC=xxxxxxxx
M>
To determine what firmware version is installed in the emulation
module, enter:
M>ver
See Also
Use the help command for more information on these and other
commands. Note that some of commands listed in the help screens are
generic commands for Agilent Technologies emulators and may not be
available for your product.
If you are writing your own debugger, contact Agilent Technologies for
more information.
Solutions for the Motorola 68360
271
Chapter 13: Troubleshooting the Emulation Module
Problems with the BDM Connection
Problems with the BDM Connection
If a user interface behaves erratically
❏ Check the orientation of the cable connecting the target interface module
to your target system. If the cable is offset or rotated, the emulator will try
to interpret the “random” signals with unpredictable results. If the cable is
rotated, the emulator or target system may also be damaged.
❏ Check that the processor clock speed has been properly configured. See
“To configure the processor clock speed (BDM communication speed)” on
page 149.
❏ Check that the FREEZE and CONFIG2 lines have sufficient pull-up
current. See page 131 for more information.
272
Solutions for the Motorola 68360
Chapter 13: Troubleshooting the Emulation Module
Problems with Configuration
Problems with Configuration
If you have problems displaying some registers
❏ If your user interface can read or write “generic” registers, but cannot
access registers that are unique to your target microcontroller, check that
the target microcontroller matches the processor type you have
configured in the emulator. You can use the Configuration window in the
Emulation Control Interface to configure the target processor type.
❏ If the value of the SP and PC are displayed as ???, see “If boot area
accesses fail” on page 274.
If you have problems initializing some registers
Some registers can only be written once after processor reset.
If you set the EMSIM values, then reset and break, the EMSIM values
will be written to the SIM registers. If your initialization code then
attempts to write to one of the “write once after reset” registers, the
writes will fail.
Solutions for the Motorola 68360
273
Chapter 13: Troubleshooting the Emulation Module
Problems with the Target System
Problems with the Target System
If boot area accesses fail
When you start a debugger interface or attempt to run from reset, the
emulator makes four accesses to the target system boot area to find
reset values for the SP and PC. It then attempts to read the values on
the stack and the code at the PC.
This problem can result in unknown values for the SP and PC
(displayed as ???) and can make the debugger interface respond very
slowly.
To avoid this problem, you can do several things:
❏ Use the 10-pin connector. The extra two pins on this connector allow the
emulator to complete unterminated memory cycles.
❏ In your boot-up code, set the initial PC and stack pointer to memory which
will be accessible at reset. Be sure to set the chip selects appropriately.
274
Solutions for the Motorola 68360
Chapter 13: Troubleshooting the Emulation Module
Problems with the LAN Interface
Problems with the LAN Interface
If LAN communication does not work
If you cannot verify the connection, or if the commands are not
accepted by the emulation module:
❏ Make sure that you wait for the power-on self test to complete before
connecting.
❏ Make sure that the LAN cable is connected. Watch the LAN LED’s on the
back of the logic analysis system to see whether the system is seeing LAN
activity. Refer to your LAN documentation for testing connectivity.
❏ Check that the host computer or debugger was configured with the correct
LAN address. If the logic analysis system is on a different subnet than the
host computer, check that the gateway address is correct.
❏ Make sure that the logic analysis system’s IP address is set up correctly.
If it takes a long time to connect to the network
❏ Check the subnet masks on the other LAN devices connected to your
network. All of the devices should be configured to use the same subnet
mask.
Subnet mask error messages do not indicate a major problem. You can
continue using the emulation module.
The subnet mask is set in the logic analysis system’s System Admin
window. If it then detects other subnet masks, it will generate error
messages.
If there are many subnet masks in use on the local subnet, the logic
analysis system may take a very long time to connect to the network
Solutions for the Motorola 68360
275
Chapter 13: Troubleshooting the Emulation Module
Problems with the Emulation Module
Problems with the Emulation Module
Occasionally you may suspect a hardware problem with the emulation
module or target interface module. The procedures in this section
describe how to test the hardware, and if a problem is found, how to
repair or replace the broken component.
To run the built-in performance verification
test using the logic analysis system
1 End any Emulation Control Interface or debugger sessions.
2 Disconnect the 50-pin cable from the emulation module, and plug
the loopback test board (Agilent part number E3496-66502) into
the emulation module.
3 In the system window, click the emulation module and select
Performance Verification.
4 Click Start PV.
The results will appear onscreen.
276
Solutions for the Motorola 68360
Chapter 13: Troubleshooting the Emulation Module
Problems with the Emulation Module
To run complete performance verification tests
using a telnet connection
1 Disconnect the 50-pin cable from the emulation module, and plug
the loopback test board (Agilent part number E3496-66502)
directly into the emulation module. Do not plug anything into the
other end of the loopback test board.
On a good system, the RESET LED will light and the BKG and USER
LEDs will be out.
2 telnet to the emulation module.
3 Enter the pv 1 command.
See Also
Options available for the “pv” command are explained in the help
screen displayed by typing “help pv” or “? pv” at the prompt. Note,
however, that some of the options listed may not apply to your
emulation module.
Solutions for the Motorola 68360
277
Chapter 13: Troubleshooting the Emulation Module
Problems with the Emulation Module
Examples
If you are using a UNIX system, to telnet to a logic analysis system
named “mylogic”, enter:
telnet mylogic 6472
Here are some examples of ways to use the pv command.
To execute both tests one time:
pv 1
To execute test 2 with maximum debug output repeatedly until a
^C is entered:
pv -t2 -v9 0
To execute tests 3, 4, and 5 only for 2 cycles:
pv -t3-5 2
The results on a good system with the loopback test board
connected, are as follows:
M>pv 1
Testing: E3499C Series Emulation System
Test 1: Powerup PV Results
Test 2: Target Probe Feedback Test
Test 3: Boundary Scan Master Test
Test 4: I2C Test
Test 5: Data Lines Test
Number of tests: 1
Number of failures: 0
Passed!
Passed!
Passed!
Passed!
Passed!
Copyright (c) Agilent Technologies 1987-2000
All Rights Reserved. Reproduction, adaptation, or translation without
prior
written permission is prohibited, except as allowed under copyright laws.
E3499C Series Emulation System
Version:
A.07.53 26Feb98
Location: Generics
E3490A Motorola CPU16/32 BDM Emulator
Version:
A.02.05 26Feb98
M>
278
Solutions for the Motorola 68360
Chapter 13: Troubleshooting the Emulation Module
Problems with the Emulation Module
If a performance verification test fails
❏ Details of the failure can be obtained through using a -v option (“verbose”
level) of 2 or more.
❏ Check that the loopback test board is connected.
❏ If the problem persists, contact Agilent Technologies for assistance.
Solutions for the Motorola 68360
279
Chapter 13: Troubleshooting the Emulation Module
Returning Parts to Agilent Technologies for Service
Returning Parts to Agilent Technologies for
Service
The repair strategy for this emulation solution is board replacement.
Exchange assemblies are available when a repairable assembly is returned
to Agilent Technologies. These assemblies have been set up on the
“Exchange Assembly” program. This lets you exchange a faulty assembly
with one that has been repaired, calibrated, and performance verified by
the factory. The cost is significantly less than that of a new assembly.
To return a part to Agilent Technologies
1 Follow the procedures in this chapter to make sure that the
problem is caused by a hardware failure, not by configuration or
cabling problems.
2 In the U.S., call 1-800-403-0801. Outside the U.S., call your
nearest Agilent Technologies sales office. Ask them for the
address of the nearest Agilent Technologies service center.
3 Package the part and send it to the Agilent Technologies service
center.
Keep any parts which you know are working. For example, if only the
target interface module is broken, keep the emulation module and
cables.
4 When the part has been replaced, it will be sent back to you.
The unit returned to you will have the same serial number as the unit you
sent to Agilent Technologies.
The Agilent Technologies service center can also troubleshoot the
hardware and replace the failed part. To do this, send your entire
measurement system to the service center, including the logic analysis
system, target interface module, and cables.
280
Solutions for the Motorola 68360
Chapter 13: Troubleshooting the Emulation Module
Returning Parts to Agilent Technologies for Service
In some parts of the world, on-site repair service is available. Ask an
Agilent Technologies sales or service representative for details.
To obtain replacement parts and cables
The following table lists some parts that may be replaced if they are
damaged or lost. Contact your nearest Agilent Technologies Sales
Office for further information.
Exchange assemblies
Part number
Description
16600-69515
Emulation module
Replacement assemblies
Part number
Description
E3496-61601
50-pin control cable
E3496-61603
10-pin BDM cable
E3496-66502
Loopback test board
E3458-66501
CPU32 target interface module
16700-61608
Expansion cable
Solutions for the Motorola 68360
281
Chapter 13: Troubleshooting the Emulation Module
Returning Parts to Agilent Technologies for Service
To clean the instrument
If the instrument requires cleaning:
1 Remove power from the instrument.
2 Clean with a mild detergent and water.
3 Make sure that the instrument is completely dry before
reconnecting it to a power source.
282
Solutions for the Motorola 68360
Glossary
Analysis Probe A probing solution
connected to the target
microcontroller. It provides an
interface between the signals of the
target microcontroller and the inputs
of the logic analyzer. Formerly called
a “preprocessor.”
Elastomeric Probe Adapter A
connector that is fastened on top of a
target microcontroller using a
retainer and knurled nut. The
conductive elastomer on the bottom
of the probe adapter makes contact
with pins of the target
microcontroller and delivers their
signals to connection points on top of
the probe adapter.
Emulation Module An emulation
module is installed within the
mainframe of a logic analyzer. It
provides run control within an
emulation and analysis test setup.
See Emulation Probe.
Emulation Probe An emulation
probe is a stand-alone instrument
connected via LAN to the mainframe
of a logic analyzer or to a host
computer. It provides run control
within an emulation and analysis test
setup. Formerly called a “processor
probe” or “software probe.” See
Emulation Module.
Emulator An emulation module or
Solutions for the Motorola 68360
an emulation probe.
Extender A part whose only
function is to provide connections
from one location to another. One or
more extenders might be stacked to
raise a probe above a target
microprocessor to avoid mechanical
contact with other components
installed close to the target
microcontroller. Sometimes called a
“connector board.”
Flexible Adapter Two connection
devices coupled with a flexible cable.
Used for connecting probing
hardware on the target
microcontroller to the analysis probe.
General-Purpose Flexible
Adapter A cable assembly that
connects the signals from an
elastomeric probe adapter to an
analysis probe. Normally, a male-tomale header or transition board
makes the connections from the
general-purpose flexible adapter to
the analysis probe.
High-Density Adapter Cable A
cable assembly that delivers signals
from an analysis probe hardware
interface to the logic analyzer pod
cables. A high-density adapter cable
has a single Mictor connector that is
installed into the analysis probe, and
two cables that are connected to
283
Glossary
corresponding odd and even logic
analyzer pod cables.
High-Density Termination
Adapter Cable Same as a HighDensity Adapter Cable, except it has
a termination in the Mictor
connector.
Jumper Moveable direct electrical
connection between two points.
Mainframe Logic Analyzer A logic
analyzer that resides on one or more
board assemblies installed in an
Agilent Technologies 16500, 1660series, or 16600A/700A-series
mainframe.
Male-to-male Header A board
assembly that makes point-to-point
connections between the female pins
of a flexible adapter or transition
board and the female pins of an
analysis probe.
Preprocessor See Analysis Probe.
Preprocessor Interface See
Analysis Probe.
Probe adapter See Elastomeric
Probe Adapter.
Processor Probe See Emulation
Probe.
284
Prototype Analyzer The Agilent
Technologies 16505A prototype
analyzer acts as an analysis and
display processor for the Agilent
Technologies 16500B/C logic analysis
system. It provides a windowed
interface and powerful analysis
capabilities. Replaced by Agilent
Technologies 16600A/700A-series
logic analysis systems.
Run Control Probe See Emulation
Probe and Emulation Module.
Setup Assistant A software
program that guides a user through
the process of connecting and
configuring a logic analyzer to make
measurements on a specific
microcontroller.
Shunt Connector. See Jumper.
Software Probe See Emulation
Probe.
Solution Agilent Technologies’ term
for a set of tools for debugging your
target system. A solution includes
probing, inverse assembly, the
Agilent Technologies B4620B Source
Correlation Tool Set, and an
emulation module.
Stand-alone Logic Analyzer A
stand-alone logic analyzer has a
predefined set of hardware
Solutions for the Motorola 68360
Glossary
components which provide a specific
set of capabilities. It is designed to
perform logic analysis. A stand-alone
logic analyzer differs from a
mainframe logic analyzer in that it
does not offer card slots for
installation of additional capabilities,
and its specifications are not
modified based upon selection from a
set of optional hardware boards that
might be installed within its frame.
different order for delivery at the
other side of the board.
1/4-Flexible Adapter An adapter
that obtains one-quarter of the
signals from an elastomeric probe
adapter (one side of a target
microcontroller) and makes them
available for probing.
Target Control Port An 8-bit, TTL
port on a logic analysis system that
you can use to send signals to your
target system. It does not function
like a pattern generator or emulation
module, but more like a remote
control for the target’s switches.
Target Interface Module A small
circuit board which connects the 50pin cable from an emulation module
or emulation probe to signals from
the debug port on a target system.
TIM See Target Interface Module.
Trigger Specification A set of
conditions that must be true before
the instrument triggers. See the
printed or online documentation for
your logic analyzer for details.
Transition Board A board assembly
that obtains signals connected to one
side and rearranges them in a
Solutions for the Motorola 68360
285
286
Solutions for the Motorola 68360
Index
A
ADDR label, modifying, 87
addresses
mask, 103
offset, 119
PC label, 116
reconstruction, 72
type, 89
analysis probe
additional equipment supported,
24
clocking, 220
connecting to, 141
connection overview, 44
definition, 283
dimensions, 41
equipment required, 24
equipment supplied, 22
inverse assembly, 95
microprocessors supported, 217
modes of operation, 85
operating characteristics, 217
overview, 2
power on/power off sequence, 42
processors supported, 4
product numbers, 4
target system requirements, 40
theory of operation, 220
analysis probe problems, 252
erratic trace measurements, 253
target system will not boot, 252
analyzer problems, 249
capacitive loading, 253
intermittent data errors, 249
unwanted triggers, 250
analyzing the processor, 83
ASCII format (GPA), 238
assistant
See setup assistant
B
BDM port
See debug port
bits
labels, 87
LSB and MSB, 87
STAT, 89
BKG light, 268
branches, displaying, 103
breakpoints
tracing until, 213
built-in commands
configuration, 146
list of commands, 269
bus cycle termination, 128
C
cables
BDM, 139
emulator, 138
high-density, 51
replacing, 263
CD-ROM, installing software from,
34
cf commands, 146
characteristics
analysis probe, 217
emulation module, 235
checklist
setup, 19
circuit board, dimensions, 41
cleaning, 264, 282
clearance, analysis probe, 40
clock speed
configuring, 149
clocks
logic analyzer, 85
qualified, and emulator, 206
slow, 212, 214, 260
comments, in GPA files, 246
compilers, 110
configuration
checklist, 19
emulation module, 144, 147
Solutions for the Motorola 68360
logic analyzers, 77, 87
configuration files
installing, 31
loading, 77, 79
names of, 80
connection
analysis probe, 37
emulation module, 121, 122
problems, LAN, 275
setup checklist, 19
connector
BDM, 139
debug port, 128
connector board, 283
creating GPA symbol files, 238
D
DATA label, modifying, 87
debug port
connecting to, 138
connections, 128
debuggers
configuration, 147
Green Hills, 182
SDS, 191
writing, 271
development port
See debug port
Diab Data
compiler, 111
dimensions of analysis probe, 41
directories
configuration files, 78
source code, 117
display filtering, 103
E
elastomeric probe adapter
definition, 283
EMSIM registers, 157
configuring analysis probe, 72
displaying, 158
287
Index
example with debugger, 187
purpose of, 158
Emulation Control Interface
configuration, 145
introduction, 123
when to use, 202
emulation module
Agilent
Technologies
16600
installation, 135
Agilent Technologies 16700A
installation, 133
configuration, 147
connecting, 122, 137
definition, 283
description of, 2
product numbers, 4
target system design, 128
using debugger, 147
emulation probe
definition, 283
emulation solution
See solution
emulator
definition, 283
enhanced inverse assembler
logic analyzer requirements, 26
environmental characteristics
emulation module, 234
equipment required
analysis probe, 24
emulation module, 28
equipment supplied, 22
analysis probe, 22
emulation module, 27
ordering information, 4
overview, 4
erratic behavior, 272
error messages
inverse assembler, 257
examples, measurement, 203
extender, 283
288
F
files
loading vs. installing, 32
filtering, display, 103
firmware
emulation module, 143
updating, 142, 143
version, 143
flash ROM
updating emulator, 142
flexible adapter
definition, 283
floppy disks
duplicating, 79
flowchart
setup, 19
format menu, 87
full solution, 3
FUNCTIONS in GPA format, 243
G
General-Purpose ASCII format, 238
address format, 238
comments, 246
FUNCTIONS, 243
record format summary, 240
record headers, 238
SECTIONS, 242
simple form, 238
SOURCE LINES, 245
START ADDRESS, 246
VARIABLES, 244
general-purpose flexible adapter
definition, 283
Green Hills
compiler, 112
debugger, 182
H
high-density adapter cable
definition, 283
high-density termination adapter
definition, 284
HRESET signal, 128
I
information sources, 30
installation, software, 31
intermodule measurement
creating, 205
intermodule measurement
problems, 256
an event wasn’t captured, 256
analyzer doesn’t stop, 206
internal cycles, 108
internal registers, 157
inverse assembler
configuration file names, 80
loading files, 78, 79
output format, 100
requirements for, 95
requirements for enhanced, 26
inverse assembler problems, 254
failure to load or run, 255
incorrect inverse assembly, 254
no inverse assembly, 254
inverse assembly, 95
displays, 202
pods required, 25
J
jumper, definition, 284
K
keep-out area, 40
L
LAN
problems, 275
lights
See status lights
listing
incorrect, 254
Solutions for the Motorola 68360
Index
Listing menu, 95
listing windows, 202
Load menu, 103
loading configurations
logic analyzer, 77
vs. installing, 31
logic analyzers
Agilent Technologies 16550A
connections, 58
Agilent Technologies 16554/55/56
connections, 60, 62
Agilent Technologies 1660 series
connections, 65
Agilent Technologies 16600A and
16700A-series, 21
Agilent Technologies 16600A
connections, 53
Agilent Technologies 16601A
connections, 54
Agilent Technologies 16602A
connections, 56
Agilent Technologies 1661 series
connections, 66
Agilent Technologies 1670 series
connections, 68
Agilent Technologies 1671 series
connections, 69
configuration, 87
configuring, 78, 79
loading configuration files, 77
software version requirements,
26
supported, 25
LSB, 87
M
mainframe logic analyzer
definition, 284
male-to-male header
definition, 284
mask, subnet, 275
MCR
SHEN configuration, 108
measurement examples, 203
memory banks, 103
microprocessors supported, 4
Microtec Research Inc.
compiler, 113
mode of operation, 85
modes
operating, 85
modifying, 87
MSB, 87
MULTI debugger, 182
O
object module file symbols, 108
offset, address, 119
online configuration help, 21
operating characteristics
analysis probe, 217
emulation module, 234
Options menu, 103, 104
orientation, socket, 45, 47
overview, 144
P
parts supplied, 22
path, source file, 117
PC label, 116
PGA socket, 45
pods, labels on, 51
port number, emulation module,
269
power on/power off sequence, 42
preprocessor
See analysis probe
problems
analysis probe, 247
processor support package, 34
processor type
configuring, 148
effect on EMSIM registers, 160
processors supported, 4
Solutions for the Motorola 68360
program symbols, 108
prompts, 271
list of, 271
prototype analyzer
definition, 284
PV
See performance verification
Q
QFP socket, 47
R
real-time runs, configuring, 154
record format, General-Purpose
ASCII, 240
record headers, 238
references, 30
registers
initializing, 273
internal, 157
problems displaying, 273, 274
unknown values, 274
repair
analysis probe, 262
emulation module, 280
requirements
target system, 40, 128
RESET
light, 268
reset
effects of, SDS debugger, 192
effects on SIM registers, 163
run control tool
See emulation control interface
S
SDS debugger, 191
Section Format, 238
SECTIONS in GPA format, 242
service, how to obtain, 262, 280
setup
See configuration
289
Index
setup assistant, 21
definition, 284
setup checklist, 19
SHEN (in MCR), 108
signals
debug port, 128
logic analyzer, 222
SIM registers
configuring, 163
configuring analysis probe, 72
displaying, 158
introduction, 158
SingleStep debugger, 191
skid, reducing, 206
slow clock message, 212, 214, 267
socket, PGA, 45
socket, QFP, 47
software
installing, 31
list of installed, 35
requirements, 26
software ,emulation module
firmware, 143
software addresses, 116
software probe
See emulation probe
software requirements, 26
solution
at a glance, 2
definition, 284
solutions
description of, 2
equipment required, 29
product numbers, 4
source code, 105
displays, 202
source correlation, 24
data display, 96
in analyzer, 105
using, 114
source file search path, 117
SOURCE LINES in GPA format,
245
290
specifications
See characteristics
SRESET signal, 128
START ADDRESS in GPA format,
246
STAT, 87
encoding, 89
label, 89
state-per-ack
mode of operation, 85
State-per-clock, 85
status bits, 89
status encoding, 89
status lights, 268
subnet mask, 275
symbol files
creating, 238
symbols
in analyzer, 105
object file, 108
object module file, 108
predefined, 91, 107
program, 108
user-defined, 107
synchronous mode, 85
T
target control port
definition, 285
target interface module (TIM)
connecting, 138
definition, 285
target system
boot failure, 252
connecting to, 122
keep-out area, 40
power sequence, 42
requirements for analysis probe,
40
requirements for emulation, 128
telnet, 269
terminal interface
See also built-in commands
tests, emulation module, 276
The, 21
timing
mode of operation, 86
trace, 208
erratic, 253
missing display, 250
transition board
definition, 285
trigger
emulation module, 204
on break, 209
source code, 118
specification, 87
unwanted, 250
troubleshooting, 267
analysis probe, 247, 248
U
until processor halts, 208
USER light, 268
V
VARIABLES in GPA format, 244
versions
emulation module firmware, 143
logic analyzer software, 26
voltage
emulation module, 235
W
web sites
Agilent
Technologies
logic
analyzers, 30
See Also under debugger names
wizard
See setup assistant
Solutions for the Motorola 68360
DECLARATION OF CONFORMITY
according to ISO/IEC Guide 22 and EN 45014
Manufacturer’s Name:
Agilent Technologies
Manufacturer’s Address:
Digital Design Product Generation Unit
1900 Garden of the Gods Road
Colorado Springs, CO 80907 USA
declares, that the product
Product Name:
Preprocessor
Model Number(s):
Agilent Technologies E2448B
Product Option(s):
All
conforms to the following Product Specifications:
Safety:
IEC 1010-1:1990+A1 / EN 61010-1:1993
UL3111
CSA-C22.2 No. 1010.1:1993
EMC:
CISPR 11:1990 / EN 55011:1991
Group 1, Class A
IEC 555-2:1982 + A1:1985 / EN 60555-2:1987
IEC 555-3:1982 + A1:1990 / EN 60555-3:1987 + A1:1991
IEC 801-2:1991 / EN 50082-1:1992
4 kV CD, 8 kV AD
IEC 801-3:1984 / EN 50082-1:1992
3 V/m, {1kHz 80% AM, 27-1000 MHz}
IEC 801-4:1998 / EN 50082-1:1992
0.5 kV Sig. Lines, 1 kV Power Lines
Supplementary Information:
The product herewith complies with the requirements of the Low Voltage Directive 73/23/EEC and the EMC
Directive 89/336/EEC and carries the CE marking accordingly.
This product was tested in a typical configuration with Agilent Technologies test systems.
Colorado Springs, 02/26/97
John Strathman, Quality Manager
European Contact: Your local Agilent Technologies Sales and Service Office or Agilent Technologies GmbH, Department ZQ /
Standards Europe, Herrenberger Strasse 130, D-71034 Böblingen Germany (FAX: +49-7031-14-3143)
Product Regulations
Safety
IEC 1010-1:1990+A1 / EN 61010-1:1993
UL3111
CSA-C22.2 No. 1010.1:1993
EMC
This Product meets the requirement of the European Communities (EC) EMC
Directive 89/336/EEC.
Emissions
EN55011/CISPR 11 (ISM, Group 1, Class A equipment),
Immunity
EN50082-1
Code1
Notes2
IEC 801-2 (ESD) 8kV AD
IEC 801-3 (Rad.) 3 V/m
IEC 801-4 (EFT) 1kV
IEC 801-6 (Conducted)
3
3
3
3
1
1
Performance Codes:
1 PASS - Normal operation, no effect.
2 PASS - Temporary degradation, self recoverable.
3 PASS - Temporary degradation, operator intervention required.
4 FAIL - Not recoverable, component damage.
2
Notes:
1 The target cable assembly is sensitive to ESD events. Use standard ESD
preventative practices to avoid component damage.
Sound Pressure
Level
N/A
DECLARATION OF CONFORMITY
according to ISO/IEC Guide 22 and EN 45014
Manufacturer’s Name:
Agilent Technologies
Manufacturer’s Address:
Digital Design Product Generation Unit
1900 Garden of the Gods Road
Colorado Springs, CO 80907 USA
declares, that the product
Product Name:
Logic Analyzer
Model Number(s):
Agilent Technologies 16600A, 16601A, 16602A, 16603A
Product Option(s):
All
conforms to the following Product Specifications:
Safety:
IEC 1010-1:1990+A1 / EN 61010-1:1993
UL3111
CSA-C22.2 No. 1010.1:1993
EMC:
CISPR 11:1990 / EN 55011:1991
Group 1 Class A
IEC 555-2:1982 + A1:1985 / EN 60555-2:1987
IEC 555-3:1982 + A1:1990 / EN 60555-3:1987 + A1:1991
IEC 801-2:1991 / EN 50082-1:1992
4 kV CD, 8 kV AD
IEC 801-3:1984 / EN 50082-1:1992
3 V/m, {1kHz 80% AM, 27-1000 MHz}
IEC 801-4:1998 / EN 50082-1:1992
0.5 kV Sig. Lines, 1 kV Power Lines
Supplementary Information:
The product herewith complies with the requirements of the Low Voltage Directive 73/23/EEC and the
EMC Directive 89/336/EEC and carries the CE marking accordingly.
This product was tested in a typical configuration with Agilent Technologies test systems.
Colorado Springs, 08/18/97
John Strathman, Quality Manager
European Contact: Your local Agilent Technologies Sales and Service Office or Agilent Technologies GmbH, Department ZQ /
Standards Europe, Herrenberger Strasse 130, D-71034 Böblingen Germany (FAX: +49-7031-14-3143)
Product Regulations
Safety
EMC
IEC 1010-1:1990+A1 / EN 61010-1:1993
UL3111
CSA-C22.2 No. 1010.1:1993
This Product meets the requirement of the European Communities (EC) EMC
Directive 89/336/EEC.
Emissions
EN55011/CISPR 11 (ISM, Group 1, Class A equipment),
IEC 555-1 and IEC 555-2
Immunity
EN50082-1
Code1
IEC 801-2 (ESD) 4kV CD, 8kV AD
IEC 801-3 (Rad.) 3 V/m
IEC 801-4 (EFT) 0.5 kV, 1kV
3
1
3
1
Notes2
Performance Codes:
1 PASS - Normal operation, no effect.
2 PASS - Temporary degradation, self recoverable.
3 PASS - Temporary degradation, operator intervention required.
4 FAIL - Not recoverable, component damage.
2
Sound Pressure
Level
Notes: (none)
Less than 60 dBA
DECLARATION OF CONFORMITY
according to ISO/IEC Guide 22 and EN 45014
Manufacturer’s Name:
Agilent Technologies
Manufacturer’s Address:
Digital Design Product Generation Unit
1900 Garden of the Gods Road
Colorado Springs, CO 80907 USA
declares, that the product
Product Name:
Logic Analyzer Mainframe
Model Number(s):
Agilent Technologies 16700A
Product Option(s):
All
conforms to the following Product Specifications:
Safety:
IEC 1010-1:1990+A1 / EN 61010-1:1993
UL3111
CSA-C22.2 No. 1010.1:1993
EMC:
CISPR 11:1990 / EN 55011:1991
Group 1 Class A
IEC 555-2:1982 + A1:1985 / EN 60555-2:1987
IEC 555-3:1982 + A1:1990 / EN 60555-3:1987 + A1:1991
IEC 801-2:1991 / EN 50082-1:1992
4 kV CD, 8 kV AD
IEC 801-3:1984 / EN 50082-1:1992
3 V/m, {1kHz 80% AM, 27-1000 MHz}
IEC 801-4:1998 / EN 50082-1:1992
0.5 kV Sig. Lines, 1 kV Power Lines
Supplementary Information:
The product herewith complies with the requirements of the Low Voltage Directive 73/23/EEC and the EMC
Directive 89/336/EEC and carries the CE marking accordingly.
This product was tested in a typical configuration with Agilent Technologies test systems.
Colorado Springs, 09/22/97
John Strathman, Quality Manager
European Contact: Your local Agilent Technologies Sales and Service Office or Agilent Technologies GmbH, Department ZQ /
Standards Europe, Herrenberger Strasse 130, D-71034 Böblingen Germany (FAX: +49-7031-14-3143)
Product Regulations
Safety
IEC 1010-1:1990+A1 / EN 61010-1:1993
UL3111
CSA-C22.2 No. 1010.1:1993
EMC
This Product meets the requirement of the European Communities (EC) EMC
Directive 89/336/EEC.
Emissions
EN55011/CISPR 11 (ISM, Group 1, Class A equipment),
IEC 555-2 and IEC 555-3
Immunity
EN50082-1
Code1
IEC 801-2 (ESD) 4kV CD, 8kV AD
IEC 801-3 (Rad.) 3 V/m
IEC 801-4 (EFT) 0.5 kV, 1kV
3
1
3
1
Notes2
Performance Codes:
1 PASS - Normal operation, no effect.
2 PASS - Temporary degradation, self recoverable.
3 PASS - Temporary degradation, operator intervention required.
4 FAIL - Not recoverable, component damage.
2
Sound Pressure
Level
Notes: (none)
Less than 60 dBA
© Copyright Agilent Technologies
1994-2000
All Rights Reserved.
Reproduction, adaptation, or
translation without prior written
permission is prohibited, except
as allowed under the copyright
laws.
Restricted Rights Legend
Use, duplication, or disclosure by
the U.S. Government is subject to
restrictions set forth in
subparagraph (C) (1) (ii) of the
Rights in Technical Data and
Computer Software Clause in
DFARS 252.227-7013. Agilent
Technologies, 3000 Hanover
Street, Palo Alto, CA 94304 U.S.A.
Rights for non-DOD U.S.
Government Departments and
Agencies are set forth in FAR
52.227-19 (c) (1,2).
Document Warranty
The information contained in this
document is subject to change
without notice.
Agilent Technologies makes
no warranty of any kind with
regard to this material,
including, but not limited to,
the implied warranties of
merchantability or fitness for
a particular purpose.
Agilent Technologies shall not be
liable for errors contained herein
or for damages in connection with
the furnishing, performance, or
use of this material.
Safety
This apparatus has been designed
and tested in accordance with
IEC Publication 1010, Safety
Requirements for Measuring
Apparatus, and has been supplied
in a safe condition. This is a
Safety Class I instrument
(provided with terminal for
protective earthing). Before
applying power, verify that the
correct safety precautions are
taken (see the following
warnings). In addition, note the
external markings on the
instrument that are described
under "Safety Symbols."
Warning
• Before turning on the
instrument, you must connect the
protective earth terminal of the
instrument to the protective
conductor of the (mains) power
cord. The mains plug shall only be
inserted in a socket outlet
provided with a protective earth
contact. You must not negate the
protective action by using an
extension cord (power cable)
without a protective conductor
(grounding). Grounding one
conductor of a two-conductor
outlet is not sufficient protection.
• Only fuses with the required
rated current, voltage, and
specified type (normal blow, time
delay, etc.) should be used. Do
not use repaired fuses or shortcircuited fuseholders. To do so
could cause a shock of fire hazard.
Agilent Technologies
P.O. Box 2197
1900 Garden of the Gods Road
Colorado Springs, CO 80901-2197, U.S.A.
• Service instructions are for
trained service personnel. To
avoid dangerous electric shock,
do not perform any service unless
qualified to do so. Do not attempt
internal service or adjustment
unless another person, capable of
rendering first aid and
resuscitation, is present.
• If you energize this instrument
by an auto transformer (for
voltage reduction), make sure the
common terminal is connected to
the earth terminal of the power
source.
• Whenever it is likely that the
ground protection is impaired,
you must make the instrument
inoperative and secure it against
any unintended operation.
• Do not operate the instrument
in the presence of flammable
gasses or fumes. Operation of any
electrical instrument in such an
environment constitutes a definite
safety hazard.
• Do not install substitute parts or
perform any unauthorized
modification to the instrument.
• Capacitors inside the
instrument may retain a charge
even if the instrument is
disconnected from its source of
supply.
Safety Symbols
!
Instruction manual symbol: the
product is marked with this
symbol when it is necessary for
you to refer to the instruction
manual in order to protect against
damage to the product.
Hazardous voltage symbol.
Earth terminal symbol: Used to
indicate a circuit common
connected to grounded chassis.
WARNING
The Warning sign denotes a
hazard. It calls attention to a
procedure, practice, or the like,
which, if not correctly performed
or adhered to, could result in
personal injury. Do not proceed
beyond a Warning sign until the
indicated conditions are fully
understood and met.
CAUTION
The Caution sign denotes a
hazard. It calls attention to an
operating procedure, practice, or
the like, which, if not correctly
performed or adhered to, could
result in damage to or destruction
of part or all of the product. Do
not proceed beyond a Caution
symbol until the indicated
conditions are fully understood or
met.
Product Warranty
This Agilent Technologies
product has a warranty against
defects in material and
workmanship for a period of one
year from date of shipment.
During the warranty period,
Agilent Technologies will, at its
option, either repair or replace
products that prove to be
defective.
For warranty service or repair,
this product must be returned to
a service facility designated by
Agilent Technologies.
For products returned to Agilent
Technologies for warranty
service, the Buyer shall prepay
shipping charges to Agilent
Technologies and Agilent
Technologies shall pay shipping
charges to return the product to
the Buyer. However, the Buyer
shall pay all shipping charges,
duties, and taxes for products
returned to Agilent Technologies
from another country.
Agilent Technologies warrants
that its software and firmware
designated by Agilent
Technologies for use with an
instrument will execute its
programming instructions when
properly installed on that
instrument. Agilent Technologies
does not warrant that the
operation of the instrument
software, or firmware will be
uninterrupted or error free.
Limitation of Warranty
The foregoing warranty shall not
apply to defects resulting from
improper or inadequate
maintenance by the Buyer,
Buyer- supplied software or
interfacing, unauthorized
modification or misuse, operation
outside of the environmental
specifications for the product, or
improper site preparation or
maintenance.
No other warranty is
expressed or implied. Agilent
Technologies specifically
disclaims the implied
warranties of merchantability
or fitness for a particular
purpose.
Exclusive Remedies
The remedies provided herein are
the buyer’s sole and exclusive
remedies. Agilent Technologies
shall not be liable for any direct,
indirect, special, incidental, or
consequential damages, whether
based on contract, tort, or any
other legal theory.
Assistance
Product maintenance agreements
and other customer assistance
agreements are available for
Agilent Technologies products.
For any assistance, contact your
nearest Agilent Technologies
Sales Office.
Certification
Agilent Technologies certifies that
this product met its published
specifications at the time of
shipment from the factory.
Agilent Technologies further
certifies that its calibration
measurements are traceable to
the United States National
Institute of Standards and
Technology, to the extent allowed
by the Institute’s calibration
facility, and to the calibration
facilities of other International
Standards Organization members.
About this edition
This is the Solutions for
Motorola 68360 User’s Guide.
Reflection 1 is a U.S. trademark of
Walker, Richer & Quinn, Inc.
Publication number
E2448-97008, June 2000
Printed in USA.
Windows, MS Windows, Windows
NT, and MS-DOS are U.S.
registered trademarks of
Microsoft Corporation.
The information in this manual
previously appeared in:
E3458-97000, Feb 1997
E2448-97001, May 1997
E2448-97007, August 1998
Many product updates do not
require manual changes, and
manual corrections may be done
without accompanying product
changes. Therefore, do not expect
a one-to-one correspondence
between product updates and
manual updates.
UNIX is a registered trademark of
The Open Group.
X/Open is a registered trademark,
and the X device is a trademark of
X/Open Company Ltd. in the UK
and other countries.