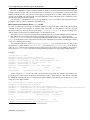
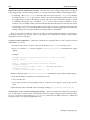
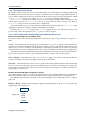
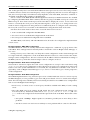
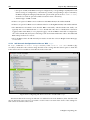
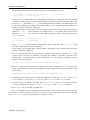
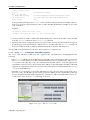
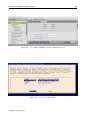
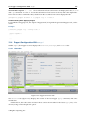
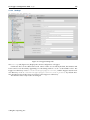
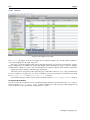
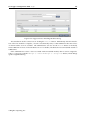
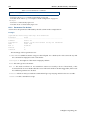
1
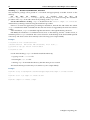
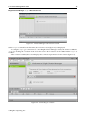
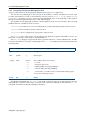
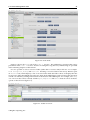
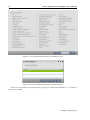
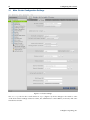
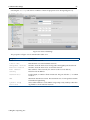
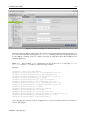
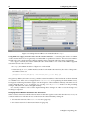
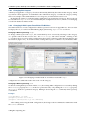
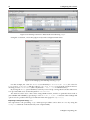
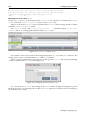
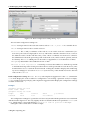
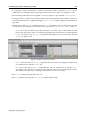
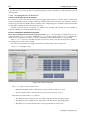
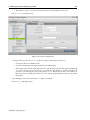
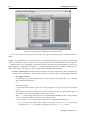
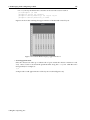
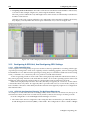
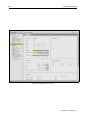
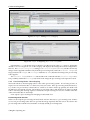
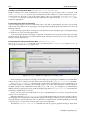
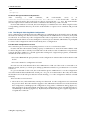
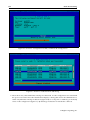
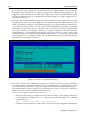
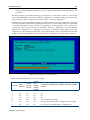
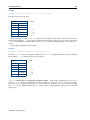
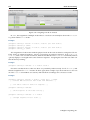
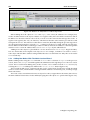
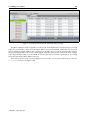
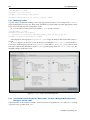
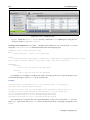
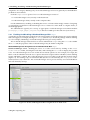
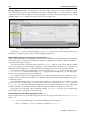
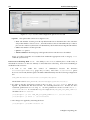
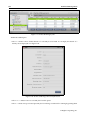
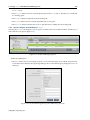
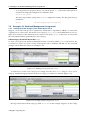
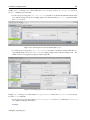
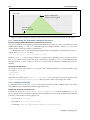
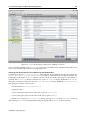
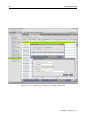
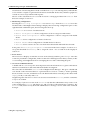
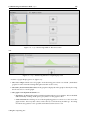
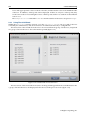
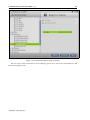
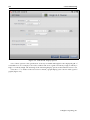
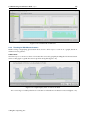
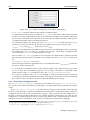
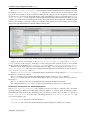
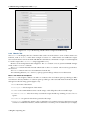
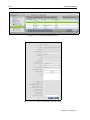
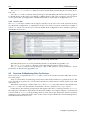
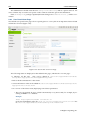
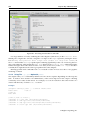
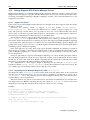
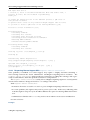
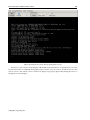
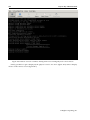
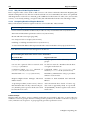
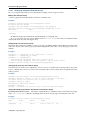
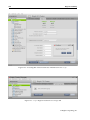
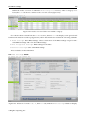
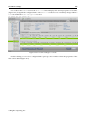
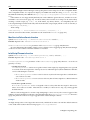
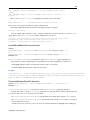
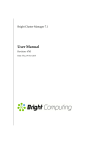
332
Cluster Monitoring
lower and upper quartile values are the box borders, and the median value is the middle divider
of the box. In addition, outlier points can be displayed. If there are only two outlier points, they
are the same as the lowest and highest values. Outlier points and how to set them are described in
section 9.3.5.
The dumpstatistics command in cmsh is somewhat similar in function to boxplots in cmgui.
9.3.3 Using The Grid Wizard
Within the Monitoring window (section 9.3.1), the Grid plot wizard sets up a grid for devices
selected by the administrator, and allows metrics to be added automatically to each grid unit.
The first screen of the wizard allows devices to be selected from the group of all devices, and placed
in a group of devices that are to have their metrics plotted (figure 9.12).
Figure 9.12: Grid Wizard: Devices Selection
The next screen of the wizard allows metrics to be drag-and-dropped from the available metrics into
a group of metrics that are to be displayed for the devices in the previous screen (figure 9.13).
© Bright Computing, Inc.