1
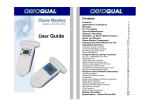
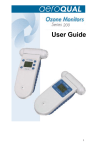
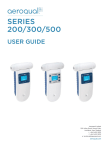
Series 300, 305, 500 & 505 Monitor User Guide Quick Start Guide 1. 2. 3. 4. Unpack monitor and check supplied components are correct Insert Battery (see page 6) Insert Sensor When new, plug in the power adaptor and turn on your monitor (with sensor head installed) for 24hrs. Note: The Ni-MH battery requires 15hrs from full discharge and Lithium 3 hrs. The sensor requires a run in period. Thereafter, the normal warm up takes only 10 minutes. If your unit is new or unused for a long period, a warm up message may display for several hours, then will disappear. Follow the operating instructions to understand how to make the most of your monitor 5. 1. 2. 3. 4. 5. 6. 7. 8. Sensor Head Power and Stand By Display Alarm Mute Enter Scroll up, or hold down for data logging (S500 only) Scroll down, or hold down for max/min average Battery case. For battery installation, see page 10 of your user guide adjust the time, use the arCLOCK SETUP: To rows , pressing to alternate between hours, minutes, seconds, and the date. For more information see page 13 of your user guide. LOGGING SETUP: To adjust the logging frequency, use the arrows , then press to return to the main menu. For more information see page 18 of your user guide. ALARM POINTS: To adjust the alarm points, use the arrows , pressing to alternate between alarm high, alarm low, and buzzer enable / disable. For more information see page 14 of your user guide. CONTROL POINTS: To adjust the control points, use the arrows , pressing to alternate between control high and control low. For more information see page 17 of your user guide. UNITS: To change the units of measurement, use the arrows , then press to return to the main menu. See page 19 of your user guide for more information MAX / MIN AV: To adjust the max / min av, press to alternate between start and stop. See page 25 of your user guide for more information Warning: Do not expose the monitor to gas concentrations above the recommended maximum range Do not place the sensor head in a gas stream – the monitor is designed to measure ambient levels of ozone and uses „active sampling‟ to achieve this. 1 Contents 1. Monitor components 2. About your monitor 3. Assembly and installation 3 4 6 3.1 Installing the battery pack 3.2 Sensor warm up 3.3 Monitor and sensor versions 6 9 9 4. Operating instructions 10 4.1 Turning the monitor on and off 4.2 Turning standby mode on and off 4.3 Operating under battery power 4.4 Sensor head failure 4.5 Using the menus and key functions 4.6 Calibration 4.61 Zero calibration 4.62 Span calibration 4.7 Setting the clock 4.8 Setting the high and low alarms 4.9 Setting the control points 4.10 Setting up data logging time intervals 4.11 Changing the units of measurement 4.12 The max / min / average measurement cycle 4.13 Starting and stopping data logging 10 11 11 11 12 12 12 12 13 14 17 18 19 19 20 5.0 Aeroqual monitor software instructions 21 5.1 5.2 5.3 5.4 5.5 5.6 5.7 23 24 25 26 27 28 35 Setting up the software and monitor parameters Gas Sensor Properties Configuration Communications Port Configuration Setting the Graph Default Style Setting Data Logging Functions Datalogging directly to a PC Advanced Data Management 6.0 External control wiring 7.0 Troubleshooting 8.0 Diagnostic features 9.0 Care and maintenance 10.Specifications 11. Appendix 37 40 42 43 44 46 11.1 Using the RS232 serial to USB adaptor 11.2 Installing the R52 drivers 11.3 Selecting the COM port 11.4 Copyright 11.5 Warranty 11.6 Terms and conditions 11.7 Statements of compliance 11.8 Guidelines on how to measure ozone 11.9 Zero calibration additional information 11.10 Accessories 46 46 47 50 50 51 52 53 54 56 11.11.2011 V2.1 1. Monitor Components Series 300 and 305 Monitor The following components are supplied with the Series 300 and 305 Monitor: Series 300 or 305* monitor base Sensor head 12 VDC AC/DC adaptor or Lithium Smart Charger User guide Battery pack – 9.6V Ni-MH or 11.1V Lithium Polymer Series 500 and 505 Monitor The following components are supplied with the Series 500 and 505 Monitor: Series 500 or 505* monitor base Sensor head Data logging software on CD Serial cable and USB to Serial adapter (with instructions) 12 VDC AC/DC adaptor or Lithium Smart Charger User guide Battery pack – 9.6V Ni-MH or 11.1V Lithium Polymer * Series 305 and 505 monitor base is supplied with a separate temperature and relative humidity probe that is plugged in as shown below. Please check that all these components have been supplied and contact your dealer or Aeroqual on email at: [email protected] if any of the components are missing. Replacements Replacement batteries, sensor heads and other accessories can be purchased separately. Note: All sensors deteriorate over time. It will be necessary to replace your sensor head with either a new or refurbished head. This must be done on a scheduled basis or when the “sensor aging” or sensor failure” diagnostic appears. Bump tests, zero and span calibration can be performed under specified conditions with appropriate tools. 3 2. About Your Monitor The Aeroqual Series 300, 305, 500 and 505 Monitors have been specifically designed to incorporate Aeroqual‟s in-depth knowledge of accurate ambient gas measurement. Different sensor heads are used for specific gases or depending upon whether high or low concentrations are to be measured. All the sensor heads are interchangeable on the same base unit. The following information details the operation and features of the monitors: 1. The monitors are modular in design and are comprised of two main components, a Series 300, 305, 500 or 505 monitor, and a sensor head. This affords the user the ability to replace faulty sensor heads without having to replace the monitor. The monitors can be mains and/or battery powered and either permanently mounted or used as portable units. 2. The sensor head is calibrated prior to delivery and does not normally need to be re-calibrated during its life. (Specific user guides are supplied for the special operations of particular sensor heads). 3. The Aeroqual Series 300, 305, 500 and 505 Monitors come with on-board diagnostics, which will inform the user if the sensor is not operating correctly. 4. High and low alarms. The high alarm is indicated by flashing arrows pointing upwards accompanied by a fast beeping sound. Similarly the low alarm is indicated by flashing arrows pointing downwards accompanied by a slow beeping sound. This sets both the monitor and external alarms. 5. Alarm mute. Two alarm mute functions are available, temporary and permanent mute. Temporary mute is only active during the specific alarm condition, while permanent mute will remain on until reset by the user. The alarm arrow indications remain active during both temporary and permanent mute. 6. Control. This enables external equipment to be controlled by the monitor using the high and low control settings, which can be used to control an external device. 7. Concentration unit selection. The concentration can be displayed in either ppm or mg/m3. 8. Min / max / average measurement cycle. The monitor will display the minimum, maximum, average and 15-minute average gas concentrations over the measurement period. The Series 305 & 505 will also show temperature and relative humidity in addition to gas concentration. 9. 0-5V Analogue signal. A proportional voltage output is available from the external output. The voltage relates to the gas concentration, with 0 V representing 0 concentration and 5 V represent- ing the maximum concentration specified by the range. For example, 0 V represents 0 ppm and 5 V representing 0.500 ppm for the Low Concentration Ozone Sensor Head. Note: See “Diagnostic Features” on page 42 for output status conditions. The Series 500 & 505 Monitors offer the following additional features: 1. Data logging (on either the Series 500 or 505 Monitor or directly to a PC). The monitor is able to log up to 8000 data points. The data can be downloaded to a PC for analysis and record purposes. Data can also be logged directly to a PC via a serial connection while displaying real time data on the PC. The data logging interval can be set in one minute increments from either the monitor or the PC. The Series 505 monitor also measures and data logs temperature and relative humidity. 2. Real time clock (24 hr). The clock has a back up clock battery which will maintain the real time even when all power is lost to the monitor. Once power is restored data logging will continue if t he unit was data logging at the time power was lost. 3. PC setup of monitor parameters. All the monitor parameters, i.e. clock setup, alarm setup, external control setup, logging setup and concentration units can be set up from the PC. 5 3.0 Assembly and Installation Assembly The following needs to be completed before the Monitor is ready for use: Insert the sensor head into the top of the monitor. The sensor head is keyed to ensure the head is inserted correctly. If the monitor is a mains only unit it is ready for use. If the monitor is to be used as a portable unit with batteries then the batteries must be installed and charged prior to use. 3.1 Installing the Battery Pack Remove the battery cover from the monitor. Insert the battery power connector into the monitor power socket in the back of the monitor. Lay the battery cable into the slot on the back of the monitor and insert the tail end of the battery pack into the hinge points at the bottom of the monitor back cover. Clip the top end of the battery pack into the top clips, taking note to orientate the battery pack per the instructions on the battery pack. Replace the battery cover on the monitor. Notes on the battery pack For more information on the correct use of the Ni-MH battery pack, please refer to ‘Battery Information’ on Page 8. Removing the Battery Pack Remove the battery cover from the monitor. Insert your thumb under the top left hand side of the battery pack and carefully lever the battery pack out from the retaining clips. Unclip the connector from the monitor. Replace the battery cover. Rechargeable Batteries The Ni-MH (Nickel Metal Hydride) or optional Lithium Polymer battery pack is used to power the monitor as a portable unit. Please read the following information carefully before using the battery pack to operate the Aeroqual monitor. Safety Do not use the battery pack for any other purpose than operating the Aeroqual monitor Do not disassemble or mutilate the batteries as this may cause burns Do not incinerate or heat as this may cause burns, the batteries may burst or cause the release of toxic materials Do not short circuit as this may cause burns Use only batteries approved by Aeroqual and recharge your battery only with the AC/DC adaptors supplied by Aeroqual. Never use any charger or battery that is damaged or worn out. Batteries must be recycled or disposed of properly. They must not be disposed of in municipal waste. Never charge the battery in a hermitically sealed container. Using the battery pack The life of the battery pack will be affected by the way it is handled. Take good care of the battery pack and follow the guidelines suggested in the following section. 7 Charging and Discharging the Batteries Ni-MH batteries Ni-MH batteries must be fully charged prior to first-time use. A new Ni-MH battery's full performance is achieved only after a number of complete charge and discharge cycles. A fully charged battery will run for approximately 4-6 hours depending on the sensor head being used. Charging Instructions With the adaptor plugged in allow 15 hours for the battery to fully charge. Note 1: During charging the battery symbol on the display flashes slowly. The battery can be charged with the sensor head installed or removed from the base. (Remember to switch off the monitor before removing the sensor head). Unplugging the main power will reset the above charging conditions. The batteries can be charged and discharged many times but will eventually wear out. When the operating time is noticeably shorter than normal, it is time to replace the batteries. It is not necessary to fully discharge the batteries. When not using the Series 300, 305, 500 or 505 Monitor as a portable unit, always plug in the mains adaptor to recharge the batteries. If left unused a fully charged battery will discharge itself over time. Note 2: If you have difficulty charging the battery, either: A) Replace the battery B) Contact Aeroqual with the software version number (see section 3.3 to locate the version number.) Additional Information for Lithium Polymer Batteries A new battery's full performance is achieved only after a number of complete charge and discharge cycles. A fully charged battery will run for approximately 10 hours depending on the sensor head being used. Charging Instructions With the adaptor plugged in allow 3 hours for the battery to fully charge. There is no battery symbol on the display when using a lithium battery. The battery can be charged with the sensor head installed or removed from the base. (Remember to switch off the monitor before removing the sensor head). The Lithium Smart Charger displays a red LED light when charging and a green LED light when the battery is charged. Installing the AC/DC adaptor Connect the AC/DC adaptor to the mains supply. Ensure that the adaptor is correctly rated for the power supply. Plug the adaptor into the monitor. The monitor can now be used as a mains unit. If the monitor is to be used as a portable unit the batteries will need to be charged. 3.2 Sensor warm up Prior to operation the monitor must be warmed up to burn off contaminants on the sensor. When the monitor is first switched on it will warm up for 3 minutes. Then the reading will flash for the next 7 minutes to indicate that the sensor is still in the warm up phase. It is recommended that the monitor is kept in Stand By mode when not being used to keep the sensor heated and prevent the build up of contaminants. If the sensor is new (or unused for long periods) it can take up to 24 hours for the message “sensor warming up” (or “sensor failure” in older models) to disappear. Should the message remain after this time, a genuine sensor failure may have occurred. See the troubleshooting guide. 24hrs is a conservative time for an ozone sensor to burn off contaminants and achieve its stated performance specification. In most instances this will be achieved well within 24hrs. Since O3 is an oxidising gas the warm up period can be reduced by subjecting the sensor to elevated O3 levels for a short period. For example, 100 ppb of O3 for 5 minutes typically reduces the warm up time to 30 minutes. Warning: Do not remove the sensor head while the monitor is switched on. This may damage the unit. If the sensor head is removed under these conditions, the unit will automatically shut down. 3.3 Monitor and Sensor Versions Turning the monitor on will display “AEROQUAL MONITOR S300 / S305 / S500 / S505 V x.x”, where "V x.x" represents the version of the monitor base. The display will then show “SV6.0” or similar, which indicates the software version installed on the sensor head 9 4. Operating Instructions The following instructions detail the operation and set up of the monitor. Enter Power button Scroll up Alarm mute Scroll down 4.1 Turning the monitor on and off To turn the monitor on, press & hold the power button until the screen activates. The monitor will turn on and the display will show “AEROQUAL MONITOR S300 / S305 / S500 / S505 Vx.x”,. After 5 seconds the display will change to indicate the type of sensor head. The monitor will warm up as described in “Warm up” in section 3.2. Once warm up is complete the main display will appear (for example): O3 LOW 0.009 Series 300 & 500 RH TEMP 35.5% 21.6C O3 LOW 0.009 Series 305 & 505 To turn the monitor off, press and hold the power button for 2 seconds until the monitor beeps. The display will now be blank and operation of the monitor will cease. 4.2 Turning Standby Mode on and off To activate Standby Mode with the monitor on, press the power button once. This will stop operation of the monitor; however the sensor will be kept warm. This mode is used to conserve power between operations but keep the sensor ready to measure the gas concentration with only a short warm up phase as described in “Warm up” in section 3.2. In this mode the display will be as shown below: NH3 To return the monitor to operational mode press the power button once. NOTE: When using a Carbon Dioxide sensor head in standby mode, the sensor runs at full power and the fan remains on. 4.3 Operating under Battery power A battery indicator will appear at the bottom of the display when the monitor is operating under battery power only. The indicator shows the battery life remaining. O3 LOW 0.080 ppm 4.4 Sensor Head Failure There are two possible Sensor failure modes, which will be indicated by one of the following messages on the display: “Sensor Failure, Replace sensor” – The sensor head should be replaced as this indicates that there has been component failure. “Sensor aging”: - This indicates that the sensor has reached the end of its usable life and the sensor head should be replaced as soon as possible. The measurement readings can no longer be relied upon to be within specification. 11 4.5 Using the Menus and Key Functions To enter the setup menu press EXIT ALARM POINTS CONTROL POINTS UNITS MAX MIN AV ZERO CAL . The following menus will appear: EXIT CLOCK SETUP LOGGING SETUP ALARM POINTS CONTROL POINTS UNITS MAX MIN AV CALIBRATE Series 300 & 305 Menu Series 500 & 505 Menu (V5.5 and above) Press or to scroll to the desired menu. 4.6 Calibration To access the calibration menu, scroll down and hold and simultaneously for approximately 2 seconds. Once the calibration menu has been entered, users can select „ZERO CAL‟ or „SPAN CAL‟. 4.61 Zero Calibration The “ZERO CAL” routine resets the zero point of the monitor. This routine must be conducted under controlled conditions: Minimum 24 hours warm up Clean air (charcoal filtered is best), no cross-sensitive gases Stable and low air flow around the monitor No vibration or movement of the monitor Temperature at 20°C ± 2°C (68°F ± 3.5°F) Relative Humidity of 50% ± 5% An incorrect "ZERO CAL" does not cause permanent damage. The process should be repeated under the above conditions. NOTE: Carbon Dioxide sensors MUST be calibrated in a certified Zero Air environment. If in doubt contact Aeroqual Limited. Press and hold until the word GO appears next to Reset Routine. The routine will run for up to ten minutes (depending on the gas sensor installed) and then beep to indicate completion. Talk to your supplier or distributor if you have questions. See section 11.9 for more information 4.62 Span Calibration Span calibration, located in the ‟CALIBRATION‟ menu, provides an option to adjust the span of Aeroqual sensor heads. Once entered, users can adjust the gain factor of their sensor. 4.7 Setting the Clock *Series 500 & 505 Monitor Only To enter Clock Setup press appear: 14:30:12 Oct 07 02 The following display will (Hours: Minutes: Seconds) (Month Day Year) Changing Clock Hours To change Hours, press or Press to confirm hours. Note: the clock is a 24-hour clock. Once the change is confirmed the cursor will automatically scroll to the next parameter. Changing Clock Minutes To change Minutes press Press or to confirm minutes. Changing Clock Seconds To change Seconds press or Press to confirm minutes. Changing the Month To change the Month press Press or to confirm the month. Changing the Day To change the Day press Press to confirm the day. 13 or Changing the Year To change the Year press or Press to confirm the year. Press to scroll down to the next Menu choice. 4.8 Setting High and Low Alarms To enter the Alarm Setup menu press . Setting the High Alarm After entering the Alarm Setup Menu, the „Alarm Hi‟ will display. ALARM HI 35 ppm Press or to increase or de- crease the setting. Press to confirm change. Setting the Low Alarm Once the High Alarm setting has been confirmed, the cursor will automatically scroll to the „Alarm Lo‟ display. ALARM LO 0.040 ppm Press or to increase or decrease setting Press to confirm change. Note: This sets both the monitor alarm and the external alarm. Enabling or Disabling the Alarm Once the Low Alarm setting has been confirmed, the cursor will automatically scroll to the "Buzzer" display. BUZZER ENABLE (or) DISABLE Press or to scroll between Enable or Disable. Press to confirm choice. Note: If the Disable option is selected, the Alarm will be permanently muted. A „P‟ on the right hand side of the Alarm Mute symbol will be displayed to indicate Permanent Mute. Screen Display of High Alarm Condition O3 HIGH 8.00 ppm Two flashing arrow symbols pointing upwards will appear on the left hand side of the display, accompanied by a fast beeping sound when the Ozone concentration rises above 8.00 ppm. Screen Display of Low Alarm Condition O3 LOW 0.015 ppm Two flashing arrow symbols pointing downwards will appear on the left hand side of the display, accompanied by a slow beeping sound when the Ozone concentration rises above 0.015 ppm. 15 Screen Display of Alarm Mute CO 35 This is activated by pressing the alarm mute button, . Muting the high and low alarms using this button only mutes the alarm during that specific alarm condition. Once the concentration returns to within alarm limits, the alarm will reset. A speaker symbol with a cross through the middle of it will appear on the right hand side of the display when an alarm condition exists and has been muted from the key pad. Once the alarm condition is removed and the alarm has reset the symbol will disappear from the screen. Screen Display of Permanent Alarm Mute CO 35 The Alarm mute symbol, as above, will be permanently displayed on the screen until the alarm is once again re-enabled via the Alarm Setup Menu. If an alarm condition arises when permanent mute has been activated, flashing arrows will appear on the display as described in the previous sections, however no sound will accompany the flashing arrows. Press to scroll down to the next Menu choice. 4.9 Setting the Control Points To enter the Control menu press . Setting the Control High After entering the Control Points menu, the „Control Hi‟ display will appear. CONTROL HI 0.080 ppm Press or to increase or decrease the setting Press to confirm change. Setting the Control Low Once the change has been confirmed, the cursor will automatically scroll to the „Control Lo‟ display. CONTROL LO 0.040 ppm Press or to increase or decrease the setting Press to confirm the change. Press to scroll down to the next Menu choice Note: Once the control settings have been set the monitor must be either put into “Standby” or switched off for the new settings to become effective. Once the monitor is put back into normal operating mode the new settings will become effective. 17 4.10 Setting up Data Logging Time Intervals *500&505 Series Only To enter the Logging Setup menu press display will appear. . The Log Freq LOG FREQ: 1 MIN Press or minute increments to change the logging frequency in one- Press to confirm change and following screen will be displayed. CLEAR LOG NO You can now elect to clear any logged data by selecting YES or NO if you wish to retain the data. Press screen. fol- to toggle between NO and YES on the CLEAR LOG LOGGING OFF Press screen. Press to confirm your selection and lowing screen will be displayed. to toggle between OFF and ON on the LOGGING Press to confirm your selection and you will be returned to the main menu. Press to scroll down to the next Menu choice 4.11 Changing Units of Measurement To enter the „UNITS‟ menu press once for the concentration unit and again for temperature unit – see displays below. CONC UNIT: ppm (or) mg/m3 TEMP UNIT: ºC (or) ºF S305 & S505 only to scroll between „ppm‟ &„mg/m 3‟ or „ºC & ºF‟ Press or Press to confirm the unit selection Press to scroll down to the next Menu choice 4.12 The Max/Min/Average Measurement Cycle Pressing Press scrolls between Start and Stop to scroll to „EXIT‟ Press to Exit out of Menu Setup. This will also Start or Stop the measurement cycle, depending on your menu selection. Note: There is a quick key option to Start or Stop the „Max Min Average‟ measurement cycle, as follows: From the Display Screen O3 LOW 0.024 Press and hold for two seconds until the monitor beeps. This will start the measurement cycle, and the following display will appear: O3 LOW MIN MAX AVE ST S300 and S500 19 O3 LOW TEM RH PPM MIN 0.005 MAX 0.024 AVE 0.015 ST 0.013 0.005 0.024 0.015 0.013 C % 22 25 24 50 56 54 S305 and S505 Similarly to stop the measurement cycle, press and hold seconds until the monitor beeps. for two Note: The MIN, MAX and AVE readings are the minimum, maximum and average readings over the period from the start of the cycle. The ST value is the average over the last 15 minutes. 4.13 Starting and Stopping Data Logging *500&505 Series Only Press and hold for two seconds until the monitor beeps. This will start the data logging, and a triangle icon will appear on the bottom of the display: O3 LOW 0.024 ppm Similarly, to stop data logging, press and hold for two seconds until the monitor beeps. Once data logging has stopped the triangle icon will disappear. Data logging Indicator: The triangle is an indication that data logging is active, and is also used as an indication of the presence of data, as described below: -An empty triangle indicates that no data is stored -A half full triangle indicates that some data is stored in the memory -A full triangle indicates that the memory is full and needs downloading to the PC. Clearing the Data Memory In order to clear the data memory, data logging must firstly be stopped as described above. The memory can then be cleared by pressing and holding the alarm mute button for two seconds until the monitor beeps or use the CLEAR LOG function under LOGGING SETUP menu. 5.0 Aeroqual Monitor Software Instructions The Aeroqual Monitor software for MS Windows comes bundled with Java™ 1.5.0 runtime virtual machine, a Java database, and all components necessary to run Aeroqual Monitor software in conjunction with the Series 500 and 505 monitor. (NOTE: The Series 505 datalogs gas concentration as well as temperature and relative humidity) Software Installation Software License: The Series 500 and 505 monitor comes supplied with Aeroqual data logging software. Aeroqual will retain ownership of all intellectual property in the Software. The buyer acknowledges that they are granted a perpetual, non-exclusive, non transferable license for the right to use the Software for the buyer‟s exclusive use and only in conjunction with Aeroqual Products (Intended use). The buyer will strictly adhere to the Intended Use of the Software and will not translate, adapt, reverse compile or otherwise alter the Software. The buyer undertakes not to disclose, assign, sell, rent, lend, sub license or otherwise transfer the Software. Software features: 1. 2. Real time gas monitoring and data logging. Event logging. When the gas concentration exceeds a userdefined level, an event will be generated and stored in the database. Logged Data Analysis with graphics view. Graphics view can be configured by the user. Average gas concentration level can be shown on both Real Time gas monitoring and Logged Data Analysis graphs. Gas concentration graphics views can be saved as JPG images. Logged Data can be exported in other file formats such as plain text and MS Excel™ files. Configuration of monitor settings and PC communication port settings from a PC. Backup and restoration of logged data. The Aeroqual sensor can be given a name or ID. This name can be changed. 3. 4. 5. 6. 7. 8. 9. 21 10. 11. 12. 13. The conversion factor for the unit of measurement [parts per million (ppm)] or [milligrams per cubic metre (mg/m 3)] can be changed on S300 and S500 monitors as well as the temperature unit (ºC or ºF) on S305 and S505 monitors. Data that is logged onto the Series 500 and 505 monitor can be downloaded to a personal computer using the Aeroqual software provided. Data from different Aeroqual sensor heads can be saved in the same database. However, the data from each sensor head has to be downloaded separately – see Setting Data Logging Functions on page 31. Monitor version V5.0 and above are not compatible with previous versions of software. System requirements: Operating system: Processor: RAM: Disk space: Communications Port: Windows™ 2000, XP. 600MHZ or above recommended 256MB (minimum) 90MB (minimum) Serial (or USB-to-serial adaptor) CD-ROM Files: S500 – x– x . exe The Aeroqual Monitor software Windows installation file. Installation of the Software: Step 1: Step 2: Insert CD-ROM into CD driver Browse CD-ROM and double click the installation file “S500 –x– x . exe”, and then follow the instruction wizard until finished. (For Windows Vista, unzip the Vista software which should then self-install). Running the Software Program Connect the Aeroqual Series 500 or 505 monitor to the COM port of your computer using the cable supplied (The default COM port setting is COM1. If COM2 is to be used, the COM port setting will need to be configured. Refer to page 29 “Configuration”). Turn the monitor on. Start the program by either: Selecting Start -> Programs -> Aeroqual -> S500 Vx.x or: if the program shortcut has been placed on desktop, by double clicking the shortcut. The following window will appear: Figure 1: Aeroqual Monitor software main window 5.1 Setting up the Software and Monitor Parameters This section of the manual will describe how to use the Software to set up the Alarms, External Control Limits, Logging Times, Concentration Units of measurement and Sensor Properties. Click menu Monitor -> Setup (or Ctrl P). The monitor setup dialog box will appear (figure 2). Type in the required values or scroll up or down to set the desired values. Click the Upload button to synchronise the monitor values with those on the PC. Once the upload is complete the monitor will beep. Click OK to confirm the settings for the software. In order to data log it is essential that you set the clock on the monitor to real time. This can be done from the key pad on the monitor (refer to page 17) or via the PC using the “Update Clock” button in the configuration menu. 23 Figure 2: Monitor Configuration Dialog box Monitor “Configuration” Dialog When using a Series 505, ensure “S505 base with Temp/RH sensor” box is checked. This configures the PC software for the S505 and displays a “Temperature Unit” field. If the S500 monitor is used, do not select this box. (The software default is for the S500) Note: Monitor settings can be loaded onto the PC by selecting the download button in the configuration dialog box. It is recommended that the required settings are entered via the PC using the Aeroqual Series 500 software and then uploaded to the monitor. 5.2 Gas Sensor Properties Configuration To enter the gas sensor configuration menu, Click Monitor -> Setup (or Ctrl P) Select the “Gas Sensor” tab: Figure 3: Gas Sensor Configuration Dialogue Box The sensor name field will always be in UPPER CASE with a maximum of 7 letters. The ppm to mg/m 3 conversion factor can be altered to accommodate the various sensors that can be connected to the series 500 Monitor base. By clicking the Update button, the current settings will be stored on the sensor head. The View button is used to view the current settings stored on the sensor head. 5.3 Communications Port Configuration (Serial Port*) [* if you do not have a serial port then a USB -to-Serial adaptor is required – contact Aeroqual for details.] Check the communication port into which the monitor serial cable has been plugged. If it is not COM1 (default) the configuration will need to be changed to COM2 or other user specified port. Click Monitor -> Com Port (or Ctrl M) (figure 4). Select COM2 or other user specified port. The other settings should not be changed. Click OK to confirm the setting. 25 Figure 4: Com Port Settings 5.4 Setting the Graph Default Style The Real Time View graph and Logged Data View graph properties can be configured from the graph style dialogue box. These include: the gas concentration upper and lower scales scale & time units graph line & background colours alarm set & control point line colours graph type (line or points) whether to show the average line or not To enter the Graph Properties menu:Click Data -> Graph -> Default Style. To change colours on the graph lines, click on the line colour. A colour chart will appear. Click on the desired colour. Click OK to accept – see Figure 5 on the next page. Figure 5 Graph Style Dialogue Box 5.5 Setting Data Logging Functions Data Logging on the Series 500 and 505 monitors The Series 500 monitor can log up to 4300 data points (3400 for Series 505). Data is logged to the onboard flash memory. View Sensor Properties This function is used to update sensor information in the data base and test connections. Click Monitor -> View Sensor Properties (see Figure 3). The monitor must be on and connected with the PC software running). To update the data base sensor information, click “Save” after making the required changes. To collect data from different gas sensors using the same Series 500 or 505 monitor, the sensor properties on PC data logging software must be updated each time a different gas sensor is used. If the sensor information is not stored in the data base click Monitor 27 -> View Sensor Properties (monitor must be on and connected with the PC software running), update the information and click “Save”. To download logged data from memory, click File -> Download Logged Data (Ctrl D) or, click the toolbar shortcut button . A data download progress bar will appear while the data is downloading. Once that data download to the PC is complete, the monitor will beep and ask the user whether they wish to clear the logged data on the monitor. Data logged on the monitor must always be cleared manually otherwise the data will continue to be stored in a data base in the Aeroqual Monitor‟s memory. If for any reason, the data download does not complete, is terminated or stops: turn off the monitor to prevent any data loss. delete the data that has been downloaded to the PC close the PC software program repeat the downloading process with the monitor on, connected and with the PC software running. 5.6 Data Logging directly to a PC To data log directly to a PC ensure that the serial cable is connected to the monitor and to the PC. Click the File -> Start PC Data Logging or use the on the toolbar. button The data will be logged directly to the database on the PC. No data will be stored in the monitor memory in this mode of operation. However, if PC data logging is stopped (by clicking the Stop button on the toolbar), the data from this point onwards will be stored in the Series 500/505 monitor memory. While logging directly to a PC, the Real Time View Graph as shown on the next page will appear on the PC screen. Figure 6 Real Time Graph View Note: Temperature & humidity graphs will appear only when the PC software has been configured for a Series 505 monitor. Figure 7 Real Time Table View Note: As new data is received in Figure 7, it will be added to the bottom of the table. The maximum number of rows in the table view is 50. 29 Graphing and Data Analysis Functions To View Logged Data as a graph Ensure that all data has been downloaded from the monitor to the PC as per the Data Logging section on page 34. To view the downloaded or logged data as a graph, click Data -> Graph-> Logged Data (or Ctrl G) to launch the Logged Data Graph View (see figure 8 below). Select the date and time range of the data to be viewed as well as the desired time units* and sensor. (* Note: In the Time Unit drop-down box “Quarters” refers to 15 minute time periods) Click the Apply button to load the data. Figure 8 Logged Data Graph View To print a Logged Data Graphics View To print the Logged Data Graph View click Print. A data graph title input window will appear “Concentration for …”. Input the required title to identify the location from which the data was recorded. Click OK to confirm and follow the remaining instructions to print the graph. To Save Graph as an Image Click the Save button (Figure 8), then give it a name and it will be saved as a JPG file. To Change the Graph Style Click the Style button (Figure 8) and the graph style dialog box will appear. Select the appropriate value and click OK to confirm. To expand a selected area of the Graph With Figure 8 displayed, using your mouse, drag to select an area of the graph. Then release the mouse and the selected area will be expanded. To reset the Graph to the Default Style With Figure 8 displayed, simply click the Reset button To View Logged Data in a Table To view logged data in a table format, click Data -> Table -> Logged Data (or Ctrl E). The Logged Data Table window will be launched (figure 9). Select the desired date and time ranges and sensor. Press Apply to confirm the selection and load the data. The data table can also be sorted by clicking a column header. 31 Figure 9 Logged Data Table View When this data is no longer needed it can be deleted by clicking the Delete button on the Logged Data Table window (Figure 9). This will delete the individual data points from the database. To print a table of logged data To print a table of logged data, click the Print button on the Logged Data Table window (Figure 9). A data table title input window will appear “Gas Concentration Logged Data for ….”. Input the required title to identify the location from which the data was recorded. Click OK to confirm and follow the remaining instructions to print the table. To Export Data To export data, click File -> Export Logged Data To export the data to a file, click the Export button on the Logged Data Table window (Figure 9), then select a directory and choose a file format – either plain text or MS Excel file and type in a file name. Click Save to export the data. Daily Summary Analysis The Daily Summary Analysis is a summary for each day, from midnight to midnight, of the Minimum, Maximum and Average (Gas) reading over the 24 hour period. To Create and view the “daily analysis” To view the created daily summary: Click menu Data -> Analysis -> Daily Analysis. The daily summary view window will be launched (see figure10). Select the data range and sensor. Press Apply to create the daily analysis and load it into the view window. Note: This process can take up to 10 minutes or longer to complete and must not be interrupted (the time taken is dependant on the volume of data that needs to be processed. The summary data files can be exported to files such as MS Excel (click the Export button). The data can also be deleted by clicking the Delete button. This will not delete the individual data points from the database, only the daily summary data. Figure 10 Daily Analysis Summary View 33 Viewing Logged Events An event will be generated when the gas concentration exceeds the alarm setpoints. A warning dialog box as shown in figure 11 will appear once an alarm setpoint has been exceeded. The event dialog can be used to record how the problem was handled and by whom. By clicking the OK button, the event will be stored into the database. To view these logged events, click menu Data -> Table -> Logged Events (Ctrl L). The Logged Event View window will be launched, figure 12. The event data can be exported to an MS Excel or plain text file by clicking the Export button in the Logged Event View window. This data can also be deleted by clicking the Delete button in figure 12. Figure 11 Event Log Dialogue Figure 12 Logged Event view 5.7 Advanced Data Management To Archive the database as a zipped format file Archive logged data by: click File -> Zip Database Select a directory and input a file name to backup all the current stored data to a zipped file. Viewing archived data To view an archived database it is important that any existing data logging function is not interrupted. It is recommended that you do not view archived data on the same PC being used for data logging, as when data is restored, the current data in the database will be lost unless it has been zipped. 35 To view an archived database on a different PC Install the Aeroqual Monitor Software to the PC if not already installed Copy the zipped file to the PC Click File-->unzip Database Select the zipped file and click OK View and analyze data as required To view an archived database on the same PC Stop PC data logging (data logging will now be performed by the monitor) Zip existing database Unzip archived database (File -> Unzip Database) View and analyze data as required (Data -> Table -> Logged) Zip archive database Unzip existing database Get logged data from the monitor (Downloads data from monitor that was logged while you viewed the archive database) Start PC data logging (This will resume the data logging without loss of data). 6. External Control Wiring The pin numbers for the external output connector are numbered from 1 to 6. Pin 1 is the closest pin to the power jack. The pin designations are as follows: 1. 12 V DC 2. Analogue output 0-5 V 3. Control 4. High alarm 5. Low alarm 6. Ground The RJ12 connector offers two possibilities for wiring, either a switch to GND or a 12V output. If the 12V output is used, the power for the relay coil is supplied by the Aeroqual AC/DC adaptor. In this case, ensure that the relay coil does not draw more than 150mA and that a protection diode is inserted across the relay coil. If the switch to GND output is used, ensure that the relay coil does not draw more than 150mA, that the voltage does not exceed 24V and that a protection diode is inserted across the relay coil. Wiring for alarm The high alarm and low alarm pins can be wired to supply simple on / off switching to operate equipment which requires only an on or off signal, such as an alarm. To switch to GND use pins 4, 5 and 6. For a 12V output wire to pins 4, 5 and 1 (see the following diagram for typical wiring for high alarm). This feature will only operate while powered by the AC adaptor. The factory default settings are based on the gas sensor head selected at time of purchase. 37 High gas level alarm AC RELAY 1 2 3 4 5 6 +12V Nom. -from Plugpack RJ12 12V COIL 150mA max BELL SUPPLY BELL ETC MINIATURE RELAY WARNING Failure to insert a circuit protection diode, shown as above, will result in damage to the monitor if a voltage spike is created by the relay. Wiring for control The control pin can be wired to supply control of a gas concentration between upper and lower concentration limits. The upper and lower limits can be set by the user, thus affording the user the opportunity to customise the control. The factory default settings are dependent on the gas sensor head selected at time of purchase. To switch to GND use pins 3 and 6. For a 12V output wire to pins 3 and 1 (see following diagram for typical wiring). This feature will only operate while powered by the AC adaptor. Control is achieved by using a software latch. If power is lost to the monitor, the switch will open and therefore turn off the external device connected to the monitor external output. The following wiring diagram demonstrates the typical wiring to achieve the required control. Gas Concentration Control +12V Nom. -from Plugpack 1 2 3 4 5 6 12V COIL 150mA max CONTROL CIRCUIT MINIATURE RELAY RJ12 WARNING Failure to insert a circuit protection diode, shown as above, will result in damage to the monitor if a voltage spike is created by the relay. Wiring the 0-5 V analogue output (wire between Pins 2 & 6) The 0 to 5 V signal is a proportional signal based on the concentration of gas. The voltage out spans the specified gas sensor concentration range, for example: with the low concentration ozone sensor head: 0 V represents 0 ppm Ozone and 5 V represents 0.500 ppm Ozone. Note: See “Diagnostic Features” on page 42 for output status conditions. 39 7. Troubleshooting Series 300 / 305 / 500 / 505 Fault Description Possible cause Remedy No power Lead connection broken Reconnect power lead Power supply failure Replace 12V DC power supply Battery flat Recharge battery S300,305,500 & 505 damaged Replace unit Sensor head damaged Replace sensor head Incorrect RJ12 pins used Check pins and wire correctly No diode across external relay coil Fit diode across external relay coil Diode polarity incorrect Fit diode correctly Insufficient warm up Run the sensor on full power for 24-48 hours. External alarm and control doesn't work correctly Sensor failure when the sensor is new If an O3 source is available, exposure to 100 ppb for 5 minutes will speed up the decontamination process (approximately 30 minutes) Reading high under zero gas conditions Air contaminated Move the sensor to cleaner environment and check reading Sensor damaged Replace sensor Background gas level higher than normal Move sensor to clean air and check reading is zero or close to zero Interferent gas present Move sensor to clean air and check reading is zero or close to zero Sensor zero drift ZERO CAL sensor in a clean, stable background Sensor damaged Replace sensor Fault Description Possible cause Remedy Reading lower than expected reading in the presence of sensor gas Sensor correct Check calibration of gas generator. Sensor inlet contaminated Clean sensor inlet filter and mesh Sensor fan failed Replace sensor Interferent gas present Move sensor to clean air and check reading upon exposure to known gas concentration Gas reactive and decomposing before detection Move the monitor closer to the source of the gas Local air flow too high (ozone sensors) or too low (VOC and ammonia sensors) Modify the airflow into and around sensor head. Sensor calibration lost Sensor correct Replace /refurbish sensor Reading higher than expected in the presence of sensor gas Interferent gas present Check calibration of gas generator. Move sensor to clean air and check reading upon exposure to known gas concentration Replace /refurbish sensor Reading unstable RS232 communications unstable (S500 & 505 only) Sensor calibration lost Power supply unstable Install stable power supply Power supply current rating incorrect Install power supply with correct rating Local air flow too high Reduce air flow Environmental conditions fluctuating Reduce fluctuations EMI noise picked up via RS232 cable (S500/505 unit only) and PC Unplug cable to determine if this reduces the instability. If this solves the problem then isolate the power on PC. Connections broken Reconnect leads COM Port settings incorrect Setup COM port correctly Clock setting incorrect 41 Synchronise clock with PC. If this does not work then the Monitor clock battery may be flat. Return monitor to Aeroqual for battery replacement. 8. Diagnostic Features Sensor Failure The S300, 305, 500 & 505 monitors have inbuilt diagnostics to detect sensor faults. If the sensor fails it can be easily replaced by simply removing and installing a new one. The failed sensor can be sent back to Aeroqual for refurbishment or disposal. Table of monitor status conditions Fault description LCD screen 0-5 V output Control output No fault Valid gas reading As set by user Sensor failed fault Sensor aging fault Sensor failure Valid gas Reading + Sensor aging Unit will turn off Reading proportional to gas reading 5V Low alarm output As set by user open closed closed 9999 Reading proportional to gas reading As set by user As set by user As set by user valid gas reading 0V open open open No output 0V open open open No output Communications failure Sensor standby Standby symbol High alarm output As set by user Data logging (S500 only) valid gas reading 9. Care and Maintenance Your Aeroqual Monitor is a product of superior design and quality and should be treated with care. When using your Aeroqual Monitor: Keep it and all its parts and accessories out of the reach of small children. Keep it dry. Avoid water and/or condensation as humidity and liquids containing minerals may corrode electronic circuits. Do not use or store in dusty, dirty areas. Do not store the monitor in temperatures below 10°C or above 35°C. This unit is designed for use at temperatures between -5°C and +45°C (23°F and 115°F). Sudden changes in temperature will cause condensation that may damage the electronic componentry. Do not attempt to open. Non-expert handling of the device may cause damage. Do not drop, knock or shake as this could lead to internal damage. Do not use harsh chemicals, cleaning solvents or strong detergents for cleaning. Wipe with a soft cloth slightly dampened with a mild soap-and-water solution In order to maintain measurement accuracy, Aeroqual recommends that user‟s replace or refurbish their sensor heads on a yearly basis. Please contact your dealer or Aeroqual to discuss your options. Disposal / Recycling Please note that this is an electronic product and disposal should be in line with your local or country legislation. The plastic casing of the product is made from a Polycarbonate / ABS blended material (PC + ABS) and is marked accordingly. 43 10. Specifications Series 300, 305, 500 and 505 Monitor Bases Measurement units ppm or mg/m3 Removable / replaceable sensor head Yes On-board alarm Yes Alarm status displayed Yes Low battery indication Yes Alarm mute function Yes Sensor condition status Yes Stand-by mode Yes External signal for alarms & control * 12 VDC or switch to (see note below) GND (150 mA max) External signal functions LoALM, HiALM & Control Analogue output 0-5V Power supply 12 VDC or Lithium Smart Charger Rechargeable battery pack 9.6V Ni-MH or 11.1V Lithium Polymer Portable (with optional battery pack) Yes Permanently fixable Screw fix Remote Sensor Capability Yes * Series 500 & 505 only: Data interface with PC Serial RS232 On Board Data Logging 4,300 data points on S500 3,400 data points on S505 Data logging independent of PC Yes Data logging direct to PC Yes On-board real-time clock Yes Data logging software supplied Yes * Series 305 & 505 only: Temperature & Relative Humidity Sensor Yes NOTE: All of the transistor outputs (those shown asterisked above *) are open collector current sink. The maximum rating of these transistor outputs is 12VDC at 150mA Should you connect a relay or any other inductive load to the transistor outputs, a back EMF suppression diode must be fitted across the load. Aeroqual accepts no responsibility for damage to this product or any other issues arising from the noncompliance with the above directives. Failure to implement these directives will invalidate the warranty on this product Draw- ings Depressions in the battery cover demarcating the screw-hole positions for fixing the unit to the wall. 45 11. Appendix 11.1 Using the RS232 serial to USB adaptor cable (R52 / UC232R-10): 1. 2. 3. 4. 5. 6. Follow Technical Note 1: Installing the driver (for an RS232 to USB converter cable) If unsuccessful, you will need to download a suitable driver from the internet here: www.ftdichip/support/documents/installguides.htm Select your computer‟s operating system Follow the instructions on how to install the appropriate driver for your operating system Plug the S500 into your PC with the RS232 to USB cable supplied If you are unsure which COM port the USB to RS232 device has allocated the follow the instructions on Technical note 2: Selecting the COM port. 11.2 Technical Note 1: Installing the drivers. Windows XP: 1. Download the VCP Drivers from: http://www.ftdichip.com/Drivers/CDM/CDM20602.zip 2. Unzip the file to a folder on your computer 3. Plug the R52 into a USB port 4. XP will recognise the R52 and begin installing. 5. XP will request the drivers – use the browse button and point to the folder that contains the unzipped driver files. 6. XP will self install the drivers. Windows Vista & Windows 7: 1. Plug in the R52 into a USB port 2. Vista will register the R52 and self install the correct drivers without you needing to download anything. 3. Check your device properties for the com port number Note: If an extra COM port is not available after installing the latest CDM driver with the R52, please connect the device and run http://www.ftdichip.com/Resources/Utilities/VCP.exe. Select the device and click "Make VCP". Alternatively, this can be done manually by opening Control Panel > System > Device Manager then select the USB Serial Converter under USB. Right click on this and select properties, then the ad- 11.3 Technical Note 2: Selecting the COM port 1. Right-click on my Computer, select properties 2. Select the Hardware tab, click on Device Manager 3. 47 Plug in the USB to serial cable and expand the Ports (COM & LPT) node and the Universal Serial Bus controllers node. You should have a USB Serial Port present under Ports and a FDTI FT8U2XX Device present under Universal Serial Bus controllers OR you should have USB Serial Port present under Ports, and a USB Serial Controller present under Universal Serial Bus 4. Select the advanced button under the Port Settings tab 5. 6. 7. Select the port number to be a port you choose. For example COM1 providing COM1 is not in use. In this example I have left my COM port as COM8. Start Aeroqual S500 V5.1 monitoring software Click OK. Aeroqual S500 V5.1 monitoring software starts 8. 49 Select Monitor: COM Port 9. Choose the COM port which you have got configured. In this example, COM8 is selected. 10. Your system should be configured and working correctly. 11.4 Copyright Copyright Aeroqual Limited. All rights reserved. Reproduction, transfer, distribution or storage of part or all of the contents of this document in any form without the prior written permission of Aeroqual Limited is prohibited. “Aeroqual” and “Aeroqual Limited – Making the Invisible Visible” are registered trademarks of Aeroqual Limited. Other product and company names mentioned herein may also be trademarks or trade names. Aeroqual operates a policy of continuous development. Aeroqual reserves the right to make changes and improvements to any of the products described in this document without prior notice. Under no circumstances shall Aeroqual be responsible for any loss of data or income or any special, incidental, consequential or indirect damages howsoever caused. The contents of this document are provided "as is". Except as required by applicable law, no warranties of any kind, either express or implied, including, but not limited to, the implied warranties of merchantability and fitness for a particular purpose, are made in relation to the accuracy, reliability or contents of this document. Aeroqual reserves the right to revise this document or withdraw it at any time without prior notice. The availability of particular products may vary by region. Please check with the Aeroqual dealer nearest to you. 11.5 Warranty Aeroqual warrants this product to be free from defects in material and workmanship at the time of its original purchase by a consumer, and for Products Warranty Period Series 300/500 Base One year from the date of purchase Sensor heads Six months from the date of purchase Accessories One year from the date of purchase a subsequent period as stated in the following table: If, during the warranty period, this product fails to operate under normal use and service, due to improper materials or workmanship, Aeroqual subsidiaries, authorized distributors or authorized service partners will, at their option, either repair or replace the product in accordance with the terms and conditions stipulated herein. 11.6 Terms and Conditions 1. 2. 3. 4. 5. 6. 7. 8. 9. 10. The warranty is valid only if the original receipt issued to the original purchaser by the dealer, specifying the date of purchase, is presented with the product to be repaired or replaced. Aeroqual reserves the right to refuse warranty service if this information has been removed or changed after the original purchase of the product from the dealer. If Aeroqual repairs or replaces the product, the repaired or replaced product shall be warranted for the remaining time of the original warranty period or for ninety (90) days from the date of repair, whichever is longer. Repair or replacement may be via functionally equivalent reconditioned units. Replaced faulty parts or components will become the property of Aeroqual. This warranty does not cover any failure of the product due to normal wear and tear, damage, misuse, including but not limited to use in any other than the normal and customary manner, in accordance with Aeroqual‟s user guide for use, faulty installation, calibration and maintenance of the product, accident, modification or adjustment, events beyond human control, improper ventilation and damage resulting from liquid or corrosion. This warranty does not cover product failures due to repairs, modifications or improper service performed by a non-Aeroqual authorized service workshop or opening of the product by non-Aeroqual authorized persons. The warranty does not cover product failures which have been caused by use of non-Aeroqual original accessories. This warranty becomes void if a non-Aeroqual approved AC/DC adaptor or battery is used. Tampering with any part of the product will void the warranty. Damage to the sensors can occur through exposure to certain sensor poisons such as silicones, tetraethyl lead, paints and adhesives. Use of Aeroqual sensors in these environments containing these materials may (at the discretion of Aeroqual) void the warranty on the sensor head. Exposure to gas concentrations outside of the design range of a specific Aeroqual sensor head can adversely affect the calibration of that sensor head and will also void this warranty as it applies to the replacement of sensor heads. Aeroqual makes no other express warranties, whether written or oral, other than contained within this printed limited warranty. To the fullest extent allowable by law all warranties implied by law, including without limitation the implied warranties of merchantability and fitness for a particular purpose, are expressly excluded, and in no event shall Aeroqual be liable for incidental or consequential damages of any nature whatsoever, however they arise, from the purchase or use of the product, and including but not limited to lost profits or business loss. Some countries restrict or do not allow the exclusion or limitation of incidental or consequential damage, or limitation of the duration of implied warranties, so the preceding limitations or exclusions may not apply to you. This warranty gives you specific legal rights, and you may also have other rights, which may vary from country to country. 51 11.7 Statements of Compliance 1. 2. 3. The Aeroqual Series 300, 305, 500 & 505 Monitors and Remote Adaptor Kit comply with EN 50082-1:1997 The Aeroqual Series 300, 305, 500 & 505 Monitors and Remote Adaptor Kit comply with EN 50081-1:1992 The Aeroqual Series 300, 305, 500 & 505 Monitors and Remote Adaptor Kit comply with Part 15 of the FCC Rules. Operation is subject to the following two conditions: (1) these devices may not cause harmful interference, and (2) these devices must accept any interference received, including interference that may cause undesired operation. NOTE: This equipment has been tested and found to comply with the limits for a Class B digital device, pursuant to Part 15 of the FCC Rules. These limits are designed to provide reasonable protection against harmful interference in a residential installation. This equipment generates, uses and can radiate radio frequency energy and, if not installed and used in accordance with the instructions, may cause harmful interference to radio communications. However, there is no guarantee that interference will not occur in a particular installation. If this equipment does cause harmful interference to radio or television reception, which can be determined by turning the equipment off and on, the user is encouraged to try to correct the interference by one or more of the following measures: Reorient or relocate the receiving antenna. Increase the separation between the equipment and receiver. Connect the equipment into an outlet on a circuit different from that to which the receiver is connected. Consult the dealer or an experienced radio/TV technician for help. 11.8 Guidelines on How to Measure Ozone The following information is presented to help users operate their Aeroqual monitor with an ozone sensor installed in the most effective and efficient manner. General Ozone is heavier than air and tends to sink. Thus detection of leaks from ozone generating equipment should be performed at the most appropriate position. Ozone will react and decompose on surfaces such as walls, furniture etc. Smell is not a reliable test for the presence or concentration of ozone as the odour threshold varies widely between people and is affected by local ambient conditions. Permanent Controller Placement The Aeroqual Ozone Controller has been designed to meas- ure the ambient concentration of ozone. The controller must not be placed directly in an ozone stream. For indoor local area monitoring attach the controller to an inert surface with the inlet unobstructed. For leak detection mount the unit near the ozone equipment. Ensure that the controller is protected from excessive water splashing, dust, vibration, excessive heat or cold, high concentrations of ozone and excessive swings in humidity. False Readings The Aeroqual Ozone Controller has been designed to respond selectively to ozone, however other oxidizing gases such as chlorine and nitrogen dioxide can generate false readings if they are at high concentrations. High concentrations of hydrocarbon gases such as vapours of alcohol, oils and solvents can reduce and mask the concentration of ozone. 53 11.9 Zero calibration additional Information A zero calibration menu routine is included in the Series 300 and Series 500 monitors, however it is important to understand when this should be used. All Aeroqual sensors are supplied pre-calibrated and zero calibration is performed in the factory in an atmosphere containing < 0.5 ppm hydrocarbons, 50% relative humidity and 25 oC. Zero baseline reading checks should be performed ideally under the same conditions. Why is the baseline not zero when no sensor gas is present ? Under some circumstances the sensors may exhibit a baseline reading higher than zero. This will be due to one of the following: The sensor has not warmed up sufficiently. The sensor should be left to run in clean air for 24 hours if it is new or has not been used in the past week. There are trace levels of gases present in the air to which the sensor is cross-sensitive. In many cases, the non-zero baseline reading occurs in an environment which is supposed to be "clean" but for which no analysis has been carried out, such as, an office or urban outdoor air. Re-check the baseline reading in clean air from a known source such as a zero air cylinder or clean outdoor air. The humidity of the air is significantly different to 50 % RH. Under this condition the sensor may display a small shift in the baseline reading (<1% of fullscale). There has been some drift in the baseline. When should I perform a Zero Calibration ? If the sensor has been warmed up in a clean air environment and it still displays a small positive after 24 hours then a zero calibration can be performed. This process takes only a few minutes and can be performed repeatedly without problems. 11.10 Sensors and Accessories Gases Ranges Ammonia (NH3) 0 - 100 ppm 0 - 1000 ppm Carbon monoxide (CO) 0 - 100 ppm 0 - 1000 ppm Carbon dioxide (CO2) 0 - 2000 ppm 0 - 5000 ppm 0 - 5% Hydrogen (H2) 0 - 2000 ppm Hydrogen sulphide (H2S) 0 - 10 ppm 0 - 50 ppm Methane (CH4) 0 - 10000 ppm Nitrogen dioxide (NO2) 0 - 0.200 ppm Non-methane hydrocarbon (NMHC) (Isobutylene standard) 0 - 25 ppm Ozone (O3) 0 - 0.150 ppm 0 - 0.5 ppm 0 - 10 ppm Leak detector Perchloroethylene (C2Cl4) 0 - 200 ppm Sulphur dioxide (SO 2) 0 - 10 ppm 0 - 100 ppm Volatile Organic Compounds (VOC) (Isobutylene standard) 0 - 25 ppm 0 - 500 ppm Other gases and calibrations available on request – contact Sensors heads are interchangeable Aeroqual R33 Wall Bracket R10 Remote Sensor Kit R40 Carry Case R32 Cigarette Lighter Adaptor 55 R52 USB to Serial Adaptor