1
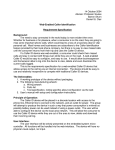
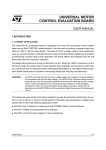
Final Draft Report
1
iLights Senior Design Project
Jose D. Figueroa, Matthew C. Ryder, Nicholas Wittemen, and Chris Merola, Team Soules
Abstract— People listen to music using iTunes more than any
other media player currently available. Most media players have
visualizers that can be placed on the screen to give the music more
excitement. The problem with this is that visualizer software
limits lighting effects simply to the screen and no where else.
Light controllers exist, but for a high price and with no easy-touse interface. We propose a plug-in for iTunes that gives the user
an easy-to-use interface that controls incandescent lights of
various colors to bring the visualizer out of the screen and bring
color and excitement to the user’s environment.
A. Requirement Specifications
1. Deliver up to 500W X 4 output channels, 2000W max.
2. Go from off to fully illuminated and back off again in
under 75ms (800bpm).
3. Lights to be fully illuminated within 80ms of audio
input (Human sync detection range).
4. iTunes plug-in that allows users to select frequency
band between 20 - 20,000Hz as trigger for each
channel.
5. USB 1.0 link to Arduino microcontroller.
6. Documented source code + user manual
I. INTRODUCTION
ur design moves music visualizations constrained to the
iTunes window out into the room in terms of actually
realizing an external light visualization through the
control of incandescent lights. This solution will provide an
appropriate visual stimulation to complement the audio
experience of iTunes users. Users would like to be able to
bring life to their music and do away with the isolation of the
computer screen. While devices already exist to dim lights in
response to music, they do not give the user a GUI (Graphical
User Interface) from which they can control what audible
frequency ranges the lights will interact with. iLights allows
users the ability to plug-in four incandescent lights and have
them interact with the beat of the song playing in real time.
Users can select which range of the audible spectrum they want
each channel to react to through the iTunes plug-in. The user
sees a display of the frequency spectrum output of the song to
allow band selection to be done in a straightforward manner.
The user is supplied with four selectable ranges for four
different channels of lights to react in response to treble, bass,
mid-range, or any other variation of the audible spectrum.
O
Manuscript received May 7, 2009. This work was supported in part by SDP
2009.
Jose D. Figueroa is a senior in Electrical Engineering at UMASS Amherst
Nicholas Wittemen is a senior in Electrical Engineering at UMASS Amherst
Chris Merola is a senior in Electrical Engineering at UMASS Amherst
Matthew C. Ryder is a senior in Electrical Engineering at UMASS Amherst
II. DESIGN
A. System Overview
Our basic system design includes a computer with the iTunes
program and our GUI along with a frequency analyzer. The
software communicates with our hardware via serial port
communication from a USB 2.0 output on the computer to a
USB 1.0 connection that will tie into the input of the iLights
Hardware Box. The hardware box contains two
microcontrollers, 120VAC/5VDC power supply, and the Triac
control circuitry, all needed to use the frequency information
provided by our GUI to obtain control of the four channels
where the incandescent lights will be connected. Each channel
will be capable of safely handling 500W.
Final Draft Report
B. Block Diagram
2
OpenGL is used to display this data graphically. Our display is
built on “VizKit”, an open source framework for building an
iTunes visualizer [9]. This code took care of initializing an
OpenGL window inside of the iTunes provided frame, and had
features similar to what we were interested in. Or visualizer
displays a spectrograph in the center of the screen with some
debug info (such as frame rate) in the upper left hand corner.
Fig. 1: System Block Diagram - Through the GUI the user selects
frequency ranges which are then communicated through the two
Arduinos leading to the controlling of the four power triacs controlling
each channel.
C. System Specification
iTunes interface
Our software is able to communicate with iTunes in order to
control lights based on the music being played. The software
also allows the user to select frequency ranges that will control
each iLights electrical outlet. From data extracted from iTunes
we determine the power contained in each of four user selected
frequency bands and use this to set the amplitude of the
connected lights. Due to the physical properties of triacs, the
fastest we can adjust the power sent to our lights is 120 times
per second. This is more than adequate for reacting to music.
This data is updated, packaged and sent via USB at the fastest
frame rate available. Our monitor can only update at 60
frames per second, but debug info tells us that we are able to
update our lights at up to 75 frames per second when there is
little other CPU load.
To extract frequency data we use the software development kit
released by apple for visualization development. Using this we
implement a Dynamic Link Library, call a *.dll file. Once
iTunes is displaying the visualizer it sends messages to update
the frame at the desired frame rate. With these messages it
passes a pointer to information about the song playing which
includes frequency data. iTunes does a FFT (Fast Fourier
Transform) of the audio being played and makes available the
power contained in 512 samples spaced linearly from 20 Hz to
20kHz. The data provided is amplitude as an 8 bit integer at
each step.
Fig 2: iLights Visualizer Window
We added to this framework CSerial [10], an open source
project that makes it easier to set up and transmit via the COM
port in Windows. Using this class we are able to write to the
port in the same way as outputting to the terminal. We have a
method, called iLightsSerial, which is called every time we
receive a renderframe message from iTunes and passed the
frequency information. This function finds the power average
in each of the 4 selected bands, stores them as 2 char ANSI
string values, and transmits the values via the COM port. The
averages are scaled to be between 0 and 63 in order to fit in 6
bit parallel ports used by our microcontrollers. The final
transmitted data is a 9 byte char array. Each channel receives a
2 byte message, and there is one additional character for ANSI
string termination.
The user interface is implemented inside of the visualizer
options menu. When the user selects visualizer options iTunes
send our plug-in a message and we open a windows created
using Microsoft Foundation Classes (MFC). These include the
standard user interface libraries for Windows. The initial
windows is an “about” tab, crediting team Soules of Umass
SDP 2009. The next tab contains the actual user options.
Here the user is presented with 8 sliders, a low and high
frequency cut for each channel. The value the slider position
corresponds to in Hertz is displayed next to each slider. The
user interface is kept to this minimal slider selection for
simplicity. To turn of a channel completely the user just
Final Draft Report
moves the high slider above the low cut slider. The average
power can never be greater than 0 on this range. There is also
a save button on this page which, when clicked, backs up the
user selected values to a text file. This way the values will
remain even after iTunes is closed.
Fig 3: iLights Visualizer Options GUI
Serial Port Communication Link
The link from the pc to the microcontroller that triggers the
switching circuitry is composed of two parts: one Arduino
prototyping board with an Atmega168 that has been
programmed to read the serial port data and another which has
been programmed for triggering the triac circuits. The first part
consists of C++ code written with Microsoft Visual Studio
Professional which translates and transmits the extracted
frequency data over the serial port; this code interprets the
frequency data so that we can send a simple string to the first
Arduino board which will be used as an index for a lookup
table. The Serial.Read() function allows us to read a byte from
the serial port for each of the four channels. We use two pins
on each microcontroller to flag when we have data ready to be
sent and when we are ready to receive data. Once we flag that
we have data ready we wait until we get a response that it is ok
to send the data before transmitting. This provides a simple
handshaking protocol that ensures the data flow is always in
control.
The task of providing control signals for the hardware is
accomplished using a second Arduino. The reason for this is
that receiving serial data hinders our ability to simultaneously
transmit control signals because there is simply too much
computation involved for the microcontrollers. The first
microcontroller receives a string, at 38400 baud, which
contains 6 bit values for each of the four channels. These
values represent the average power across the particular
frequency band. This data is stored until the second Arduino
requests new values. At this point the data is transmitted over
ports B and C of the Atmega168 used as parallel ports.
3
Parallel data is sent extremely fast since only bitwise data is
needed, and this allows for efficient communication of our
signals. Using two ports allows us to send update data for two
channels simultaneously, meaning it only takes two
transmissions to send all four values.
The second microcontroller receives our parallel data and
converts it into dimming delays using a lookup table. This
table is scaled in a logarithmic manner in order to match
human perception of brightness.
The dimming is
accomplished using a critically timed loop to properly set the
phase delay at which to trigger each channel. This loop is run
approximately 1300 times over every full 120Hz AC signal,
which was discovered empirically. To dim the lights to the
specified level we simply run this loop a certain number of
times, determined by the proper value from the lookup table,
before sending the signal to trigger the power for that channel.
This gives us a very consistent way to maintain phase control.
Communicating with our pc in this way has allowed us to
continuously send updating signals to each of the four lights at
around 80 times a second without any visual delay between the
music and the properly dimmed lighting.
Light Control Circuitry
The idea for controlling the light is to use a type of phase
control. AC mains are rated at 120VAC at 60Hz. The amount
of power provided to an incandescent light is essentially the
area under the sinusoidal wave. If we are able to supply half
the amount of power during every half-cycle then we
essentially deliver half the power to the incandescent bulb
which in return creates an affect on the incandescent light bulb
being half as bright as usual. The use of a power triac is ideal
for this. This is demonstrated in the figure below:
Fig. 4: Graph of AC mains (GREEN) and supply of half of each halfcycle to the load (RED). Graph also represents triggering the triac on to
dim the bulb at half of its full brightness (RED).
The power triac is a device of the Thrysistor family which
allows for switching of AC loads either resistive or inductive.
The triac of choice is the BTA20-700CW snubberless triac
from ST Microelectronics. The way the device works is by
attaching the mains (120VAC) to pins A1 and A2. Pin G is a
Final Draft Report
gate triggering pin which will activate the triac and allow
current to flow through pins A2 and A1. The uniqueness of this
device is its capability to block the current flow when the AC
main voltage crosses zero. In order to allow current to flow the
triac need to be triggered after every zero crossing of the AC
mains. This property makes the device ideal for phase control
of our lights. The triac is capable of withstanding 700V at 20 A
which exceeds our design requirements of 500W. Each channel
contains its own power triac for individual control of each
channel.
The second device used to control the lights and interface with
the microcontroller is a Triac Driver IC. This device is needed
to isolate the sensitive microcontroller from the AC main lines
that the power triac will be controlling. The device of we chose
is the MOC3012, Opto-isolated Triac Driver. This device is a
random phase opto-isolated triac driver. Within the device
there is an infrared light emitting diode which optically triggers
an infrared sensitive triac. When this triac is triggered it will
supply an output trigger for the power triac therefore safely
preventing any current from entering the microcontroller.
Fig. 5: Basic structure of design for controlling a single incandescent
light bulb or channel.
The last major component of the light control circuitry is a
zero cross detection circuit. This is needed in our design so
that the system knows when the AC mains cross zero and
therefore calculate a delay after the zero crossing to switch the
power triac to its on state. This has been achieved easily with
the use of an Atmega168. Atmel released a bulletin that the
Atmega can be directly connected to the AC mains with 1Meg
resistors at the input pins and due to the internal clamping
diodes it was possible to achieve a zero cross detection circuit.
The clamping diodes keep the input pins between Vcc + 0.5V
and Vg – 0.5V. The 1Meg resistors limit the current below its
1mA max up to 1000V. This allows our system to recognize
when the AC main crosses zero in order to set-up a delay
trigger to the power triac. With this trigger to the power triac
we can control where within the half cycle we trigger the
power triac depending on the delay from that zero cross. This,
in return, gives us the ability to control the power to the
incandescent light bulb and vary its brightness with the
4
microcontroller.
Both triacs in our design are snubberless meaning that there is
no need for external components such as RC or RLC circuits to
suppress transient spikes from the mains or the load.
Electromagnetic Interference and Compatibility
Since our project involves switching large amounts of AC
current very quickly, electromagnetic interference (EMI) is an
issue we are going to have to address. When large amounts of
current are switched in close proximity to other circuits, they
can induce a current in those circuits which will have a
detrimental effect on performance. For example, in our circuit
we are counting zero-crossings of the AC main line and also
triggering the triacs with digital circuitry. The Electromagnetic
(EM) fields produced by the triac output lines could induce a
current in the zero-cross circuit and produce a fake zero
crossing or it could induce a current in the triac triggering
circuit and trigger the triac when it is not supposed to be
triggered. The Federal Communications Commission (FCC)
has passed many restrictions on the amount of EMI consumer
electronics are allowed to produce. A product which produces
too much EMI will degrade the performance of other
products/appliances nearby.
To help reduce EMI in our circuit, we are going to first use
capacitors to couple the ac lines with the ground lines. This
will prevent sharp and sudden voltage spikes due to ground
noise. Y-type capacitors are ideal for this because they are
double insulated and designed for this purpose. X-type
capacitors can be used between ac line and neutral together to
further reduce interference. We will also arrange our circuit in
such a way that minimizes EMI. The best way to do this is to
have small loops on the PCB and to have lines carrying large
amounts of current going in opposite directions. When two
lines with equal current go in opposite directions, they each
produce an EM field equal but opposite to the other. This will
dramatically reduce our emissions. Large loops in a path
amplify the ability of that path to conduct and radiate noise.
Prevention of this type of noise will be done by keeping highcurrent loops far away from low-current loops and by keeping
loops as small as possible.
PCB Design
This PCB design posed a particular challenge because of the
high power requirements of iLights. The average PCB you
encounter everyday consists of a variety of resistors,
Final Draft Report
capacitors, and integrated circuits. Integrated circuits, such as
the Atmega 168, operate at a very low pin current of 40mA.
PCB traces of minimal thickness will suffice for carrying this
amount of current. The vast majority of PCBs also use DC
current or small AC currents because it is safer, easier to build
and more cost efficient. The iLights PCB, however, is required
to switch up to 2kW of power at 20 amps and 120VAC. The
reason this is a special case is because standard PCB traces are
1 oz/ft2 thick; nowhere near thick enough to carry so much
current without burning up. Based on calculations it was
determined that the iLights PCB required a trace thickness of 4
oz/ft2. 1oz/ft2 is the thickness of copper achieved by stretching
1oz of copper uniformly over an area of 1 ft2; it is roughly
1.38 mils.
To calculate minimum trace width, a few parameters had to be
taken under consideration. First, the maximum current
expected in the trace must be known. For iLights, an output of
500W at 120VAC per channel results in a total of 4.66A (5A
used in calculations to be on the safe side) required per
channel. With four output channels this is a total of
approximately 20A going into the PCB. The second parameter
needed to calculate trace width is the maximum permissible
temperature rise of the trace. Since this PCB is going to be
surrounded by four heat sinks at a temperature of 140°F (more
on this in the next section) and in an enclosure, a maximum
temperature rise of 70°F was selected. This value was selected
based on a 70°F ambient room temperature. The final
parameter needed is the thickness of the copper. Values of 1-3
oz/ft2 were used in the calculation and trace width could not be
brought below 108 mils for traces in open air. Traces in open
air are on an outer layer of the PCB and can therefore dissipate
more of their heat into the air than a trace on an inner layer
would be able to. This allows them to be thinner and carry the
same amount of current without burning up. When a copper
thickness of 4 oz/ft2 (5.5 mils) was selected, the minimum
trace width dropped to 80 mils; a much more practical value. A
thickness of more than 100 mils would not work because it
would not be able to pass under the triacs without connecting
two of the triac pins. The same parameters as outlined above
were used to calculate the minimum trace thickness of the 5A
lines. They are 40 mils thick although a value of 14 mils is all
that was required. In case of an accidental power surge, each
output will be able to handle 12A before being destroyed. This
is a useful protection feature in case the 5A fuse on each output
does not trip fast enough to protect the PCB trace from
burning.
To connect external power to the board and distribute power to
the output channels, arrays of plastic screw terminals were
selected. These are the ideal way to connect a PCB to high-
5
current inputs and outputs because they have high ratings
(700V/60A) and are easy to use and service. They do not wear
out from excessive use and they pose no risk of accidental
electrocution. They are also much easier to connect and
reconnect than soldering leads directly onto the board.
Also, since the traces are carrying 120VAC, sharp turns greater
than 45 degrees were avoided. When alternating currents are
redirected to quickly, they produce large amounts of EMI. This
occurs because as traces bend more and more, their properties
change from that of a wire to that of an antennae. This is
undesirable because not only will iLights produce large
amounts of EMI and interfere with other electronics, but it will
act as a receiver for other signals and can have signals injected
into the line. This phenomenon also occurs at “T” junctions so
they were avoided. Highly current-sensitive devices, such as
the two Atmega168 ICs and triac opto-isolators, were placed
on the opposite end of the board to minimize the risk of
induced currents in the pins.
Heat Control Design
Closely related to the design of the PCB itself is the design of
the thermal management system for the PCB. An overheating
PCB causes two main issues: First, if the copper traces get too
hot they will melt and not conduct anymore. Second, the triacs
used in iLights have a maximum operating temperature of
125°C. If this is exceeded, currents can be arbitrarily induced
in the doped materials and the triac may trigger when it is not
supposed to or may not trigger when it is supposed to. It can
also melt if it gets too hot. Initial tests with a small aluminum
heat sink showed that switching 500W of power per channel
produces a lot of heat. Within minutes of being operated at
450W one of the triacs heated up to over 93°C. This triac was
only operating at 90% load and was in the open air; larger heat
sinks were needed to prevent overheating.
The first and easiest method employed for cooling the triacs
and PCB was to spread large sheets of copper over the top and
bottom layers of the PCB. To do this, copper rectangles were
placed over the high-voltage traces on the board, allowing
them to act as heat sinks and dissipate small amounts of heat.
This method works to prevent overheating of smaller
components quite well, but was not enough for this project. In
conjunction with the traces acting as heat sinks, large
aluminum heat sinks were attached to the triacs to replace the
smaller ones used during testing. To calculate the size of the
heat sinks, the thermal properties of the triac and heat sink had
to be looked at and the following equation had to be used:
Final Draft Report
Where:
RHA = thermal resistance of the heat sink
RJC = thermal resistance of triac junction to case = 2.1 °C/W
(from triac datasheet)
RCH = thermal resistance of triac case to heat sink = 1 °C/W
(worst-case value for thermal epoxy)
TJ = maximum allowed temperature of heat sink = 140°F =
60°C (low temperature of computer)
TA = ambient temperature of air around heat sink = 75°F =
24°C (high room temperature)
P = heat energy dissipated by triac = 5.1W (from triac
datasheet and explained below)
Figure 1 shows heat dissipation vs. operating current for the
BTA-20 triac we selected. The maximum current each triac
will be handling is 5A since each output will be limited by a
5A fuse. A phase angle of 180° is a full power cycle and
therefore will dissipate the most heat, so to find heat
dissipation we look at the top plot in the figure (α = 180°.
From the figure it is evident that when operated at 5A, the triac
will dissipate roughly 5.1W of heat.
6
Since the triacs and heat sinks described earlier are in a sealed
enclosure, a fan was needed to circulate the air and keep the air
in the box as close to ambient as realistically possible. If there
were no fan, the air in the enclosure would heat up until it
eventually got to the same temperature as the heat sinks. As the
temperature difference between the air inside the enclosure and
heat sinks got smaller, the rate of heat exchange would slow
and the heat sinks themselves would get hotter. After a long
time, the air inside the enclosure would be the same
temperature as the triacs with no heat sinks on them; over
125°C. The important parameters for a fan are the air flow rate,
and the noise it produces. An AC fan was selected as opposed
to a DC fan because we already have 120VAC lines in the
enclosure and adding a separate 12VDC supply solely for the
fan was not practical. To calculate the minimum airflow
needed, the following equation was used:
Where:
V = airflow rate [m3/hr]
f = altitude factor (for altitudes less than 1000m, f = 3.5
QV= heat radiated in enclosure = 25W (four heat sinks at 5.1W
and a little overhead)
Ti = highest allowed temperature inside enclosure
To = highest anticipated temperature outside enclosure
Ti-To = ∆T = 2°C
A somewhat arbitrary selection of ∆T = 2°C was made to
ensure the air in the enclosure was as close to the outside
(ambient) air as possible. Solving the equation for the above
values gives a minimum required airflow of
m3/hr. Converting this to the more standard unit of CFM (cubic
feet per minute) gives V
25.75 CFM. The fan selected for
this project has a flow rate of 27 CFM and a noise rating of
22dB. Standard laptop fans operate at around 30dB and are not
too loud, so a noise rating of less than 30dB was the goal.
Figure 1: Heat dissipation vs. operating current for BTA20 triac for different duty cycles
Evaluating the above equation for the values shown produces a
result of
3.96 °C/W. This means the heat sink
must heat up less than 3.96°C for every Watt of heat released
into it. The heat sink selected for use in iLights has a thermal
resistance of 2.6°C/W. The actual thermal resistance value of
a heat sink is a function of airflow, and that will be addressed
next.
As mentioned earlier, the thermal resistance of a heat sink is a
function of the air flow over it. The calculated thermal
resistance of the triac heat sinks assumes no airflow, so it is an
absolute maximum resistance. Thermal resistances lower than
the calculated 3.96 °C/W would result in lower heat sink
temperatures. Now that an airflow rate has been determined, a
slightly different version of the heat sink equation will be used
to calculate the actual temperature of the heat sink.
Final Draft Report
7
Note Figure 2 shows how the thermal resistance of the heat
sink changes with airflow. Converting between air velocity and
feet per minute is a function of the radius of the fan. The
selected fan has a radius of 1.3” and an airflow of 27 CFM,
which translates to a velocity of roughly 732 ft/min. Figure 2
shows that with this air velocity, the thermal resistance of the
heat sink will drop from 2.6°C/W to 1.2°C/W. This will be the
value used to calculate the operating temperature of the heat
sinks.
Using the above numbers, the operating temperature of the
heat sinks can be calculated by using the heat sink equation:
TJ = 44.91°C (113°F)
The above calculation assumes an ambient temperature in the
room of 24°C (75°F). In a room at 24°C with the heat sink and
fan selected, the maximum temperature of the heat sinks will
Figure 2: Thermal resistance vs. air velocity and mounting
surface temperature rise vs. heat dissipated.
be 45°C (113°F). This value is an acceptable value because
laptop heat sinks routinely reach temperatures of 180°F before
they start to malfunction, and these are considered safe for
consumers. Of course the final temperature of the heat sink is
dependent upon the ambient temperature, but with the flow rate
and heat sinks selected the air inside the enclosure will be 2°C
(3.6°F) warmer than room temperature ambient and the heat
sink will be 21°C (38°F) warmer than the air inside the
enclosure (this value of 21°C was calculated by hand, however
Figure 2 shows it is correct because when 5.1W are dissipated
by the heat sink there is expected to be a 21°C raise above
ambient). This means that at all times the heat sink will be
23°C (41.6°F) warmer than the air in the room. This relatively
small temperature difference will ensure the triacs stay cool
and operate reliably all the time. It will also stop the plastic
enclosure from melting.
design for the project. Receiving the serial communication
from the iTunes plug-in and implementing the phase delay
timing in software on Arduino boards. He is also the team
coordinator.
Jose D. Figueroa designed the zero crossing circuit along
with the triac circuit which handles 4 channels at 500W each
for 2000W total max power, and taking all safety precautions
when interfacing with a live AC source. He is also the
webmaster responsible for updating and maintaining Teams
Soules’ website.
Matthew C. Ryder as worked on reducing EMI
(Electromagnetic Interference) so that our product functions
properly within its contained environment. He also designed
the printed circuit board and derived solutions to heating issues
for the final enclosure.
ACKNOWLEDGMENT
Team iLights would like to extend our thanks to professor T.
Baird Soules for his guidance and the insight he contributed to
our research.
We would also like to thank Paul Badger, owner of
ModernDevice.com, for his timely and considerate assistance
for handling our requests for assistance.
Our greatest thanks go to Heiko Wichmann for providing
VizKit, a basic visualizer plug-in for iTunes using OpenGL,
and for his kind assistance.
REFERENCES
[1]
[2]
[3]
[4]
III. PROJECT MANAGEMENT
[5]
A. System Overview
Our team as split the project up into four main areas:
Chris Merola is responsible for designing the easy-to-use
GUI along with the iTunes plug-in with iTunes SDK to extract
frequency information and transmit via COM port. He is also
lead engineer for overall project.
Nicholas Wittemen has developed the embedded systems
[6]
[7]
[8]
[9]
Shreiner, Dave, Mason Woo, and Jackie Neider. OpenGL Programming
Guide : The Official Guide to Learning OpenGL, Version 2. New York:
Addison Wesley Professional, 2005.
"The World Famous Index of Arduino & Freeduino Knowledge."
<http://www.freeduino.org/>.
"Arduino Home." <http://www.arduino.cc/>.
Curcio, Igor D., and Miikka Lundan. Human Perception of Lip
Synchronization in Mobile Environment. Tech.No. Research Center,
Nokia Corporation. IEEE Xplore, 2007. 1-7.
Benhard, Ryan G. "EMI Considerations in Selecting AC/DC Switching
Power Supplies." Power Supplies. Oct.-Nov. 2005. Elpac Electronics,
Inc.
3
Dec.
2008
<http://www.devicelink.com/mem/archive/05/10/007.html>.
Fairchild Semiconductors: Datasheet: FOD410, FOD4108, FOD4116,
FOD4118 Rev. 1.1.4
Fairchild Semiconductors: Datasheet: Application Note AN-3004
ST Microelectronics: Datasheet: BTA20 BW/CW
Wichmann, Heiko. "Open Source iTunes Visualizer: VizKit." Imagomat.
1 Apr. 2009. 3 May 2009 <http://www.imagomat.de/>.
Final Draft Report
[10] Archer, Tom, and Rick Leinecker. "CSerial - A C++ Class for Serial
Communications." CodeGuru. 7 Aug. 1999. 3 May 2009
<http://www.codeguru.com/>.
8