1
4.
5.
6.
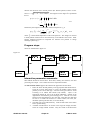
by donor which is usually neutral but not necessarily so (eg. qef93#h).
The individual members are identified by the subdirectory name, a code
and then fully ionised receiver (eg. qef93#h_be4.dat). The data sets
generally contain many individual spectrum lines. Scroll bars appear if
the number of entries exceed the file display window size. Such data is
generally stored by year number (eg. 93 ) with the most recent data to
be preferred. Click on a name to select it. The selected name appears
in the smaller selection window above the file display window. Then
its sub-directories in turn are displayed in the file display window.
Ultimately the individual datafiles are presented for selection. Datafiles
all have the termination .dat.
Once a data file is selected, the set of buttons at the bottom of the main
window become active.
Clicking on the Browse Comments button displays any information
stored with the selected datafile. It is important to use this facility to
find out what is broadly available in the dataset. The possibility of
browsing the comments appears in the subsequent main window also.
Clicking the Done button moves you forward to the next window.
Clicking the Cancel button takes you back to the previous window
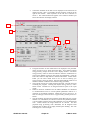
1
2
3
4
6
5
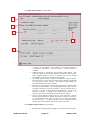
The processing options window is shown below:
1. An arbitrary title may be given for the case being processed. For
information the full pathway to the dataset being analysed is also
shown. The button Browse comments again allows display of the
information field section at the foot of the selected dataset, if it exists.
2. The output data extracted from the datafile may be fitted with a
polynomial. Clicking the Fit Polynomial button activates this. The
accuracy of the fitting required may be specified in the editable box.
The value in the box is editable only if the Fit Polynomial button is
active.
ADAS User manual
Chap4-03
17 March 2003