1
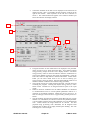
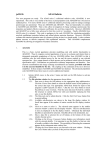
The output options window is shown below
1
2
3
4
5
1.
2.
3.
4.
5.
As in the previous window, the full pathway to the file being analysed
is shown for information. Also the Browse comments button is
available.
Graphical display is activated by the Graphical Output button. This
will cause a graph to be displayed following completion of this window.
When graphical display is active, an arbitrary title may be entered
which appears on the top line of the displayed graph.
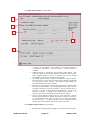
By default, graph scaling is adjusted to match the required outputs.
Press the Explicit Scaling button to allow explicit minima and maxima
for the graph axes to be inserted. Activating this button makes the
minimum and maximum boxes editable.
Hard copy is activated by the Enable Hard Copy button. The File name
box then becomes editable. If the output graphic file already exits and
the Replace button has not been activated, a ‘pop-up’ window issues a
warning. A choice of output graph plotting devices is given in the
Device list window. Clicking on the required device selects it. It
appears in the selection window above the Device list window.
The Text Output button activates writing to a text output file. The file
name may be entered in the editable File name box when Text Output is
on. The default file name ‘paper.txt’ may be set by pressing the button
Default file name. A ‘pop-up’ window issues a warning if the file
already exists and the Replace button has not been activated.
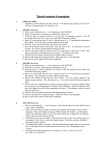
The Graphical output window is shown below
1. Printing of the currently displayed graph is activated by the Print button.
ADAS User manual
Chap4-03
17 March 2003