1
Chapter 9. Analysis of results using VisGUI
32
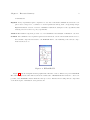
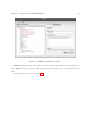
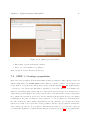
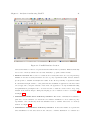
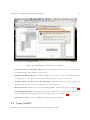
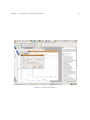
Figure 9.2: Parallel Database Creation
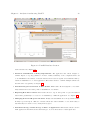
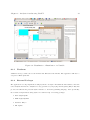
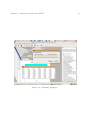
desired iteration.See Figure 9.4.
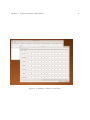
• Advanced Visualization of Policy Experiments: The application also allows designer to
examine impact of a policy parameter on macro results, sensitivity of the computational model
to an initialization and effects of random interactions in between agents across different runs by
advanced visualization tool of the application. The feature allows to examine multiple variables at
the same time very quickly. See Figure 9.5.
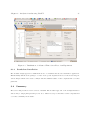
• Automatic Report Generation of Data Points: This feature allows designers to view summary statistics and exact data points of visualization of a variable.
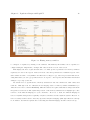
• Exporting Raw Data of Plots: The feature allows to export data points of a plot in standard
data format, presumably to be tested or re-visualized by a different application. See Figure 9.6.
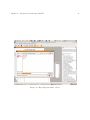
• Managing Generated Reports and Plots: Analyses and visualizations of an experiment results
in many reports and plots. This set of feature allows user either visualize or close them easily or
automatically store them on a secondary memory space.
• Automatic Storage and Re-storage of State of Application: This feature allows both the
main application and all interactive GUI dialogs to store its latest state for subsequent uses.