1
Figure 3-2 Conceptual drawing of a persistent mode superconducting magnet ........................... 19
Figure 3-3 Heater Switch Front Panel (part of system control instrument rack).......................... 19
Figure 3-5 Hand Held Controller (HCC) ...................................................................................... 23
Figure 3-6 Liquid helium level meter block-diagram................................................................... 24
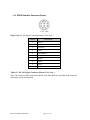
Figure 3-7 Helium level meter connector ..................................................................................... 25
Figure 4-1 Detection Coil Assembly ............................................................................................ 28
Figure 4-2 SQUID input Schematic.............................................................................................. 29
Figure 4-3 Magnet Schematic....................................................................................................... 29
Figure 4-4 Magnetic Field Profile................................................................................................. 30
Figure 6-1 Software Introduction Screen...................................................................................... 32
Figure 6-2 Subject Data Input Screen........................................................................................... 33
Figure 6-3 Subject Location.......................................................................................................... 34
Figure 6-4 Input Screen and Locator Loops ................................................................................. 35
Figure 6-5 Main Console and Strip Chart Screen (FP Monitor)................................................... 36
Figure 6-6 Strip Chart Panel ......................................................................................................... 36
Figure 6-7 Measurement timeout.................................................................................................. 37
Figure 6-8 SQUID V vs. Z Raw Data........................................................................................... 37
Figure 6-9 Locator Loop Volts vs. Z Data.................................................................................... 38
Figure 6-10 Measurement Results Panel ...................................................................................... 38
Figure 6-11 Measurement Results Several Panel ......................................................................... 39
Figure 6-12 Subject Analysis Printout.......................................................................................... 42
Figure 8-1 Software Schematic..................................................................................................... 44
Figure 8-2 SYSDAT_FF.asc......................................................................................................... 45
Figure 8-3 MACHPARyy.asc....................................................................................................... 45
Figure 8-4 SYSPARmmyy.asc ..................................................................................................... 47
Figure 8-5 Sample Data File ......................................................................................................... 48
Figure 8-6 Code Compile List ...................................................................................................... 52
Figure 8-7 SQUID Test Panel (high frequency) ........................................................................... 52
Figure 8-8 Locator Loop vs. Time................................................................................................ 53
Figure 8-9 Position Transducer vs. Time...................................................................................... 53
Figure 8-10 Water Pressure vs. time............................................................................................. 53
Figure 8-11HHC Test Panel.......................................................................................................... 54
Figure 8-12 Bed Cycle Test Panel ................................................................................................ 54
Figure 8-13 SQUID Range Test Panel.......................................................................................... 54
Figure 8-14 Locator Loop Test Panel ........................................................................................... 55
Figure 8-15 SQUID Low Frequency Test Panel........................................................................... 55
Figure 8-16 Helium Transfer Panel .............................................................................................. 56
Figure 8-17 Helium Set Panel....................................................................................................... 56
Figure 8-18 Locator Loop Calibration.......................................................................................... 57
Figure 8-19 Locator Loop Calculation Panel................................................................................ 58
Figure 8-20 Susceptibility Background Input Panel..................................................................... 59
Figure 8-21 Susceptibility Calculation Result Panel .................................................................... 59
Figure 9-1 System Safety Schematic ............................................................................................ 60
Figure 11-1 Water Bag Setup Screen (WBC_STARTER) ........................................................... 69
Figure 11-2 Program Load Screen WBC (response to IN 2.021)................................................. 70
Figure 11-3 Status Command (? And ? VAR).............................................................................. 72
Model 5700 Biosusceptometer
page vii of 76