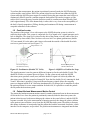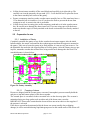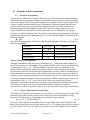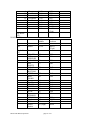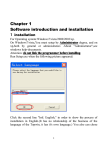
1
Operating Guide for Model 5700 3-Channel SQUID BioSusceptometer System By: TRISTAN TECHNOLOGIES, Inc. San Diego, California USA copyright 2002 CAUTION - Investigational Device. Limited to investigational use only. Model 5700 Biosusceptometer page i of 76 Revision Record Date Revision Description January 5, 2000 Version 0.8 Initial Release February 1, 2000 Version 1.0 Preliminary Release February 11, 2002 Version 1.1 Oakland 2000-2 by Tristan Technologies All rights reserved. No part of this manual may be reproduced, stored in a retrieval system, or transmitted in any form or by any means, electronic, mechanical, photocopying, recording, or otherwise, without prior written permission of TRISTAN TECHNOLOGIES Inc. TRISTAN TECHNOLOGIES Inc. reserves the right to change the functions, features, or specifications of its products at any time, without notice. Any questions or comments in regard to this product and other products from Tristan Technologies. Inc., please contact: Tristan Technologies, Inc. 6185 Cornerstone Court East Suite 107 San Diego, CA 92121 U. S. A. Technical Support: (858) 550 - 2700 Fax: (858) 550 - 2799 [email protected] www.tristantech.com Model 5700 Biosusceptometer page ii of 76 WARRANTY TRISTAN TECHNOLOGIES Limited Warranty TRISTAN TECHNOLOGIES Inc. warrants this product for a period of twelve (12) months from date of original shipment to the customer. Any part found to be defective in material or workmanship during the warranty period will be repaired or replaced without charge to the owner. Prior to returning the instrument for repair, authorization must be obtained from TRISTAN TECHNOLOGIES Inc. or an authorized TRISTAN TECHNOLOGIES service agent. All repairs will be warranted for only the unexpired portion of the original warranty, plus the time between receipt of the instrument at TRISTAN TECHNOLOGIES and its return to the owner. This warranty is limited to TRISTAN TECHNOLOGIES’ products that are purchased directly from TRISTAN TECHNOLOGIES, its OEM suppliers, or its authorized sales representatives. It does not apply to damage caused by accident, misuse, fire, flood or acts of God, or from failure to properly install, operate, or maintain the product in accordance with the printed instructions provided. This warranty does not cover any unauthorized modifications to the model 5700 biosusceptometer system. Unauthorized modifications may damage the system, interfere with its measurement capabilities and/or permit injury or death to occur. Tristan will not be responsible for misuse of this system. This Warranty Is In Lieu Of Any Other Warranties, Expressed Or Implied, Including Merchantability Or Fitness For Purpose, Which Are Expressly Excluded. The Owner Agrees That TRISTAN TECHNOLOGIES’ Liability With Respect To This Product Shall Be As Set Forth In This Warranty, And Incidental Or Consequential Damages Are Expressly Excluded. Model 5700 Biosusceptometer page iii of 76 Table of Contents: 1 Introduction............................................................................................................................. 1 1.1 Purpose of the Manual ........................................................................................................ 1 1.2 Overview of Components and the System.......................................................................... 1 1.3 The SQUID Detection System and Electronics .................................................................. 2 1.4 The Water Bellows and Controls........................................................................................ 2 1.5 Position Locator .................................................................................................................. 3 1.6 Patient Bed and Measurement Motion Control .................................................................. 3 1.7 Gantry and Vibration Isolation System............................................................................... 4 1.8 Computer Control and Data Collection System.................................................................. 4 1.8.1 Component Item Overview......................................................................................... 4 1.8.2 The SQUID Detection System & Electronics............................................................. 5 1.8.3 The Water Bellows & Controls................................................................................... 5 1.8.4 Position Locator .......................................................................................................... 5 1.8.5 Patient Bed & Measurement Motion Control ............................................................. 5 1.8.6 Gantry & Vibration Isolation System ......................................................................... 6 1.8.7 Computer Control and Data Collection System.......................................................... 6 1.9 Schematic............................................................................................................................ 6 2 Preparation for Use or Return ................................................................................................. 7 2.1 Site Requirements ............................................................................................................... 7 2.1.1 Site Selection .............................................................................................................. 7 2.1.2 Space Requirements.................................................................................................... 9 2.1.3 Power Requirements ................................................................................................... 9 2.2 Items Supplied in the model 5700 Biosusceptometer......................................................... 9 2.3 Initial Inspection ............................................................................................................... 10 2.4 Unpacking ......................................................................................................................... 11 2.5 Preparation for use ............................................................................................................ 12 2.5.1 Installation of Gantry ................................................................................................ 12 2.5.2 Installation of water bag............................................................................................ 14 2.5.3 Preparation of subject bed......................................................................................... 15 2.5.4 Interconnects ............................................................................................................. 16 2.6 Reshipment ....................................................................................................................... 16 2.6.1 Repackaging for return shipment.............................................................................. 16 2.6.2 Return from Customers outside the U.S ................................................................... 16 3 Operation............................................................................................................................... 16 3.1 Introduction....................................................................................................................... 16 3.2 Initial Operation ................................................................................................................ 16 3.2.1 Initial Cooldown ....................................................................................................... 16 1.1.2 System Calibration.................................................................................................... 20 1.1.3 Ongoing Maintenance............................................................................................... 20 1.1.4 Safety Precautions for handling cryogenic liquids ................................................... 21 1.3 Normal Operation ............................................................................................................. 22 1.3.1 SQUID Electronics ................................................................................................... 22 1.3.2 Handheld Controller.................................................................................................. 22 1.3.3 Magnet Power Supply............................................................................................... 23 1.3.4 Dewar and Sensor Assembly .................................................................................... 23 Model 5700 Biosusceptometer page iv of 76 4 5 6 7 8 1.3.5 Patient Bed ................................................................................................................ 23 1.3.6 Water Bag ................................................................................................................. 24 1.3.7 Computers ................................................................................................................. 24 1.4 Liquid Helium Level Meter .............................................................................................. 24 1.5 Taking the System Out of Service .................................................................................... 25 1.5.1 Removing field from the magnet .............................................................................. 25 1.5.2 Warming up the dewar.............................................................................................. 25 1.5.3 Removing dewar from Gantry .................................................................................. 25 Theory of Operation.............................................................................................................. 25 4.1 Principles of biosusceptometry ......................................................................................... 26 4.1.1 Magnetic Susceptibility ............................................................................................ 26 1.1.2 Theory of Biomagnetic Susceptibility ...................................................................... 26 1.1.3 Calibration................................................................................................................. 28 1.1.4 Detection Coils.......................................................................................................... 28 1.1.5 SQUID Circuitry....................................................................................................... 28 1.1.6 Magnet Field Plots .................................................................................................... 29 Principle of the clinical method (BLS) ................................................................................. 30 1.1.1 Typical Applications................................................................................................. 31 1.1.2 What type of patients can be measured..................................................................... 31 1.1.3 Clinical data needed for evaluation of body iron stores ........................................... 31 Patient Measurements ........................................................................................................... 32 6.1 Introduction....................................................................................................................... 32 6.2 The Method of Patient Measurement................................................................................ 32 6.2.1 Patient pre-information ............................................................................................. 32 6.2.2 Positioning and Measurement................................................................................... 33 6.2.3 Patient Preparation .................................................................................................... 33 6.2.4 Data needed directly prior to the measurement ........................................................ 33 6.2.5 Positioning of the patient .......................................................................................... 33 6.2.6 Assessment of geometry parameters by sonography ................................................ 34 6.2.7 Positioning of the patient under the biomagnetometer ............................................. 35 6.2.8 Execution of biomagnetometer measurements by process control and data acquisition with LabWindows CVI program........................................................................ 36 1.1.9 Determination of the effective thorax geometry by measurements .......................... 40 1.3 Data Storage, organ volume estimation, and on-line analysis .......................................... 40 1.3.1 Finalization of the measurement............................................................................... 40 1.3.2 Volume estimation by sonography (Ultrasound)...................................................... 40 1.3.3 On-line analysis ........................................................................................................ 41 Final analysis ........................................................................................................................ 42 7.1 Simultaneous determination of iron concentration and tissue susceptibility.................... 42 1.2 Precision of SQUID biosusceptometry............................................................................. 42 1.3 Total body iron stores and other related calculations ....................................................... 43 System Software ................................................................................................................... 43 8.1 Introduction: Biosusceptometer Software Functionality and Flow Control ..................... 43 8.2 Software File Structure ..................................................................................................... 44 8.3 Code required for a compile ............................................................................................. 51 8.4 Utility Screens................................................................................................................... 52 Model 5700 Biosusceptometer page v of 76 8.5 Utilities for Locator Loop and Background Susceptibility Calibration............................ 56 8.5.1 Calibrate Locator Loop ............................................................................................. 56 8.5.2 Background Susceptibility Calibration ..................................................................... 58 8.5.3 Subtraction of Tissue and locator signal................................................................... 59 8.5.4 Computation and errors............................................................................................. 60 9 Safety Issues.......................................................................................................................... 60 9.1 Bed Motion: ...................................................................................................................... 60 9.2 Water Bag ......................................................................................................................... 61 9.3 Dewar Safety..................................................................................................................... 61 9.3.1 If the flow indicator indicates low flow (< 200 SCCM),.......................................... 61 9.3.2 If the flow indicator indicates high flow (> 2000 SCCM),....................................... 62 9.3.3 General comments about dewar safety ..................................................................... 62 9.4 Magnetic field concerns.................................................................................................... 63 9.5 Other items to be guarded against..................................................................................... 63 10 Service and Maintenance ...................................................................................................... 63 10.1 Inspection and Cleaning.................................................................................................... 63 10.2 Cryogenic Dewar Maintenance......................................................................................... 63 10.2.1 Vacuum ..................................................................................................................... 63 10.2.2 Sensor Maintenance .................................................................................................. 64 10.3 Bed Maintenance .............................................................................................................. 64 10.4 Water Bag Maintenance.................................................................................................... 64 10.5 Mechanical Pump Maintenance........................................................................................ 64 10.6 Transfer Tube Maintenance .............................................................................................. 64 11 Appendices............................................................................................................................ 64 11.1 Hardware PC and National cards setup ............................................................................ 64 11.2 Water Bag Microcontroller (WBC) .................................................................................. 69 11.3 SQUID Interface Connector Pinout .................................................................................. 73 11.4 Dewar Interface Pin Connectors ....................................................................................... 74 Table of Figures: Figure 1-1 System dewar, gantry, bed, and electronics photo. ....................................................... 1 Figure 1-2 Water Bellows and SQUID Detection System ............................................................. 2 Figure 1-3 Gradiometer (Double "D" Coils) Figure 1-4 SQUID vs. Position for Loop...... 3 Figure 1-5 System Schematic ......................................................................................................... 7 Figure 2-1 Poor Site ........................................................................................................................ 8 Figure 2-2 Good Site....................................................................................................................... 8 Figure 2-3 Room Layout................................................................................................................. 9 Figure 2-4 Gantry Assembly......................................................................................................... 12 Figure 2-5 Dewar cross-section .................................................................................................... 13 Figure 2-6 Dewar in Gantry.......................................................................................................... 14 Figure 2-7 Water Bag assembly.................................................................................................... 14 Figure 2-8 Water bag flow schematic........................................................................................... 15 Figure 2-9 Bed assembly .............................................................................................................. 15 Figure 3-1 Dewar Initial cooling................................................................................................... 18 Model 5700 Biosusceptometer page vi of 76 Figure 3-2 Conceptual drawing of a persistent mode superconducting magnet ........................... 19 Figure 3-3 Heater Switch Front Panel (part of system control instrument rack).......................... 19 Figure 3-5 Hand Held Controller (HCC) ...................................................................................... 23 Figure 3-6 Liquid helium level meter block-diagram................................................................... 24 Figure 3-7 Helium level meter connector ..................................................................................... 25 Figure 4-1 Detection Coil Assembly ............................................................................................ 28 Figure 4-2 SQUID input Schematic.............................................................................................. 29 Figure 4-3 Magnet Schematic....................................................................................................... 29 Figure 4-4 Magnetic Field Profile................................................................................................. 30 Figure 6-1 Software Introduction Screen...................................................................................... 32 Figure 6-2 Subject Data Input Screen........................................................................................... 33 Figure 6-3 Subject Location.......................................................................................................... 34 Figure 6-4 Input Screen and Locator Loops ................................................................................. 35 Figure 6-5 Main Console and Strip Chart Screen (FP Monitor)................................................... 36 Figure 6-6 Strip Chart Panel ......................................................................................................... 36 Figure 6-7 Measurement timeout.................................................................................................. 37 Figure 6-8 SQUID V vs. Z Raw Data........................................................................................... 37 Figure 6-9 Locator Loop Volts vs. Z Data.................................................................................... 38 Figure 6-10 Measurement Results Panel ...................................................................................... 38 Figure 6-11 Measurement Results Several Panel ......................................................................... 39 Figure 6-12 Subject Analysis Printout.......................................................................................... 42 Figure 8-1 Software Schematic..................................................................................................... 44 Figure 8-2 SYSDAT_FF.asc......................................................................................................... 45 Figure 8-3 MACHPARyy.asc....................................................................................................... 45 Figure 8-4 SYSPARmmyy.asc ..................................................................................................... 47 Figure 8-5 Sample Data File ......................................................................................................... 48 Figure 8-6 Code Compile List ...................................................................................................... 52 Figure 8-7 SQUID Test Panel (high frequency) ........................................................................... 52 Figure 8-8 Locator Loop vs. Time................................................................................................ 53 Figure 8-9 Position Transducer vs. Time...................................................................................... 53 Figure 8-10 Water Pressure vs. time............................................................................................. 53 Figure 8-11HHC Test Panel.......................................................................................................... 54 Figure 8-12 Bed Cycle Test Panel ................................................................................................ 54 Figure 8-13 SQUID Range Test Panel.......................................................................................... 54 Figure 8-14 Locator Loop Test Panel ........................................................................................... 55 Figure 8-15 SQUID Low Frequency Test Panel........................................................................... 55 Figure 8-16 Helium Transfer Panel .............................................................................................. 56 Figure 8-17 Helium Set Panel....................................................................................................... 56 Figure 8-18 Locator Loop Calibration.......................................................................................... 57 Figure 8-19 Locator Loop Calculation Panel................................................................................ 58 Figure 8-20 Susceptibility Background Input Panel..................................................................... 59 Figure 8-21 Susceptibility Calculation Result Panel .................................................................... 59 Figure 9-1 System Safety Schematic ............................................................................................ 60 Figure 11-1 Water Bag Setup Screen (WBC_STARTER) ........................................................... 69 Figure 11-2 Program Load Screen WBC (response to IN 2.021)................................................. 70 Figure 11-3 Status Command (? And ? VAR).............................................................................. 72 Model 5700 Biosusceptometer page vii of 76 Figure 11-4 iFL-301 Pigtail Connector Pinout ( Face View ) ...................................................... 73 Figure 11-5 Dewar Cable A1........................................................................................................ 74 Figure 11-6 Dewar cable A2......................................................................................................... 75 Figure 11-7 Dewar Cable B .......................................................................................................... 76 Tables: Table 3-1 SQUID Tune Parameters.............................................................................................. 18 Table 4-1 Table of Susceptibilities ............................................................................................... 26 Table 10-1 iFL-301 Pigtail Connector Pinout ( Face View )........................................................ 73 Model 5700 Biosusceptometer page viii of 76 1 Introduction 1.1 Purpose of the Manual This manual is designed to provide operating instructions necessary for the user to operate the Tristan Technologies model 5700 biosusceptometer. The procedures in the manual make no attempt to instruct the user in methods or techniques of iron overload or anemia measurement. The necessary methods and techniques may vary according to the user's needs and are to be determined by the user. The operating procedures are given to provide the user with the information necessary to operate the model 5700 in a safe and efficient manner. If there are any concerns about instructions contained within this manual, the user is encouraged to contact Tristan Technologies. 1.2 Overview of Components and the System The Tristan model 5700 biosusceptometer is designed for measuring magnetic fields from paramagnetic materials in the body such as hepatic iron stores in the liver. Details on the measurement technique can be found in “Biomagnetic susceptometer with SQUID instrumentation”, D. N. Paulson, R. L. Fagaly, R. M. Toussaint and R. Fischer, IEEE Transactions on Magnetics, MAG-27, pp. 3249 - 3253 (1991). The system pieces are shown in the photo below. The major physical subsystems are the gantry, bed, dewar/sensor assembly (attached to the gantry), data acquisition equipment rack, water bag system/equipment rack, and data analysis station (not shown). Figure 1-1 System dewar, gantry, bed, and electronics photo. Model 5700 Biosusceptometer page 1 of 76 1.3 The SQUID Detection System and Electronics SQUID detection systems are extremely sensitive detectors of magnetic flux. They operate at cryogenic temperatures and utilize the Josephson Effect to achieve the ability to detect changes in magnetic field smaller than 10-14 tesla. The SQUID system in the model 5700 biosusceptometer is comprised of three channels of liquid helium SQUIDs with a highly stable integrated superconducting magnet system for applying a static dc magnetic field. The entire structure is integrated into a (magnetically clean) dewar and cooled by a liquid helium bath. The electronics portion consists of the Tristan three channel iMAG® model iMC-303 SQUID controller and Flux-Locked-Loops (FLLs). There is a liquid helium level meter and electronics, with a computer interface. The final piece of the electronics is the magnet power supply. A block diagram view is shown in Figure 1-5. Dewar SQUIDs Port to Reservoir SQUID Detection System Water Bag Liver Patient Patient Bed Figure 1-2 Water Bellows and SQUID Detection System The dewar has a small diameter tail to more easily make pediatric measurements. It is designed to have a one week operational time between refills of liquid helium. Typical spacing (“tail gap”) between the cryogenic environment and room temperature for the model is 1.8 cm. 1.4 The Water Bellows and Controls Because the magnetic susceptibility of the human body is non-zero, it is necessary to provide a magnetically uniform “background” as the patient is lowered beneath the detection system. A water bellows assembly (Figure 1-2) is attached to the bottom of the dewar. This water bellows simulates the background of the body, since the magnetic susceptibility of water is within a few percent of the body’s susceptibility (χtissue ≈ -9·10-6). The water bellows (or water bag) system consists of the bellows (water bag), low magnetic signature mounting hardware for the dewar, fill/drain lines, water reservoir and hydrostatic control hardware and electronics (for draining and filling the water bellows.) The water bag electronics include a computer interface and are integrated into the system control software. The water bag system is fit with pressure valves to insure that the bag could not be over-filled (pressurized). In addition, a heater assembly is integrated into the reservoir and bag to keep the water at body temperature (37° C). Model 5700 Biosusceptometer page 2 of 76 To perform the measurement, the patient is positioned (centered) under the SQUID detection system and the water bellows filled. The patient is then lowered down from under the SQUID system while the SQUID system output is recorded. During this movement the water bellows is continuously filled to provide a uniform magnetic background. This makes it appear as if the subject (liver) is moving away from the detection system in a uniform medium of bodily fluid (since approximately 70% of the human body is water, this is very close to the susceptibility of the body’s liquid composition.) Filling, draining and continuous fill during a measurement is computer controlled via the software. 1.5 Position Locator The position of the patient’s liver with respect to the SQUID detection system is critical to achieving ideal results. This system is comprised of a set of signal coils, a signal generator and a lock-in amplifier. The signal coil is placed on the skin of the patient, over the center of the liver (determined by ultra-sound). There are three coils over-laid - two planar gradiometers (double “D”) one rotated 90° to the other, and a larger coil around the outside of the double-Ds which serves as a gross locator coil (see Figure 1-3). - + Double “D” Coils + - Voltage Output (SQUID) “Magnetometer” coil Coil shown displaced one diameter for clarity. Figure 1-3 Gradiometer (Double "D" Coils) Position Detector system passes over one coil to the other coil. Figure 1-4 SQUID vs. Position for Loop The signal generator is used to generate different frequencies for the each double-D coils. The double-D coils have a response shown in Figure 1-4 that, when moved under the SQUID detection system, produces a null (zero) when the double-D signal coil is directly under the detection system. With the second coil turned 90° from the first double-D coil, centering for both X and Y directions is possible. Using two different frequency signals allows the centering process to happen in both X & Y direction simultaneously. By using a lock-in amplifier to adjust the patient position for a zero output condition for both coils, it is possible to center the patient directly under the detection system. 1.6 Patient Bed and Measurement Motion Control The patient bed and measurement motion control is another important factor in the measurement of Iron in the Liver. Once the patient is positioned (centered) under the detection system, the patient is then lowered (with water taking up the volume in the water bellows), and the SQUID response recorded. Key to the measurement is knowing precisely the change in relative position as the patient is moved below (away from) the SQUID detection system. The ability to measure this change in distance is incorporated into the patient bed, and the associated electronics, which interfaces to the computer, are provided. The position measurements are integrated into the data Model 5700 Biosusceptometer page 3 of 76 file as the measurement is made on the patient. Additionally, during the measurement sequence, the signal generated (at a third frequency) by the larger “Magnetometer” coil (Figure 1-3) is used to determine the distance between the patient and the SQUID detection coils. The patient bed is made of materials with low magnetic moments. It can roll in both X & Y directions allowing for the patient to be centered under the detection system. Once in position, a floor brake system is latched so the bed will not move horizontally under the detection system. The patient lies on the bed table top which also allows X & Y movement when positioning the patient beneath the sensor array prior to measurement. A brake allows the table top to be locked in position. Vertical motion is integrated into the bed, and has a total vertical travel of (nominally) 25 cm, while the measurement is made with a patient vertical motion of 15 cm. The extra 10 cm is provided to account for the variable size of patients that might be studied. Nominal bed speed during the measurement sequence is 0.7 - 1 cm/sec. 1.7 Gantry and Vibration Isolation System The dewar & probe assembly along with some of the plumbing for the water bag is held in the gantry. The structure is design to minimize vibrations from the floor. The gantry is constructed of materials having a low magnetic moment, and is design to offer easy access to the patient and the water bellows system. The gantry is design to provide easy access to the dewar for re-filling the system with liquid helium. The vibration isolation sub-system of the gantry consist of vibration mounts to decouple the natural vibrational modes of the structure (the gantry, floor and building). Features of the gantry include: • Esthetic design with all wood construction with durable laminate surface. • Multiple access panels to provide easy access for maintenance. • Internal routing of cabling and water piping. • Multi-section construction to allow easy transport of subsections. If additional vibration dampening is needed, some of these sections can be filled with sand. 1.8 Computer Control and Data Collection System 1.8.1 Component Item Overview The Computer Controller and Data Collection System allows the user to modify the system configuration from the computer and collect data. This includes a desk and electronics rack for the SQUID electronics, and magnet power supply. It controls the following functions: • SQUID System - gain, range, filters, tuning and other miscellaneous settings. • Helium Level meter - determines the amount of liquid helium in the dewar. • Magnet Control System – manually charges the magnet with a dc bias field. • Water Bellows Control - empty and fill the water bellows. • The Position Locator System - control of the Signal Generator and the Lock-in amplifier functions, as well as a visual read-out of the feedback of the signals used while centering a patient. • Patient Bed and Motion System - manual X & Y position adjustment, computer controlled Z position adjustment), electronic readout of Z position. • Hand Held Controller - bed-height/water bag fill & empty/measurement control • The computer system is comprised of a desktop computer with interface and A/D or D/A cards required for the above. Model 5700 Biosusceptometer page 4 of 76 Software is provided for setup, control and collecting data (including patient motion) and is written in National Instrument LabWindows® CVI application language. An on-line analysis routine gives a 1st approximation to the susceptibility. It is assumed that final data analysis will take place off-line from the system computer, which will be dedicated to system setup, control and data collection. Data collection will allow specific patient information to be recorded in a data file (in addition to multiple patient measurements). The header block will contain the SQUID electronics and other system information as required to define the experimental setup. The SQUID output is voltage (both channels) and vertical position. The data file must be post processed by the user to complete the analysis of liver iron content. It should be noted that liver location and depth are important parameters in calculating the iron concentration [Fe]. • • • • • • 1.8.2 The SQUID Detection System & Electronics Three channel iMAG® LTS SQUID Electronics (model iMC-303 SQUID control electronics, three model iFL-301-H flux-locked loops, three model CC-6 fiber-optic composite cables and three model LSQ/20M niobium dc SQUID sensors) Model BMD-35M liquid helium dewar with detection coils, SQUIDs and superconducting magnet system integrated into the vacuum section. Liquid helium level detector on insert to helium storage region of the dewar. Liquid helium level meter read-back electronics. Liquid helium flow meter. Magnet Power Supply and control electronics suitable for computer integration. • 1.8.3 The Water Bellows & Controls Microprocessor control system, located in an EMC protected enclosure. Water reservoir with analog pressure and vacuum indicators, also in the EMC protected enclosure. Water bag assembly for mounting on the dewar. Safety valve system to protect from an over-pressure condition, including a feedback line for motion control reversal. All lines and miscellaneous components required for operation. • • • 1.8.4 Position Locator 3-coil Locator assembly (see Figure 1-3). Signal generator and software generated lock-in amplifiers (3). Cabling and interconnects. • • • • • • 1.8.5 Patient Bed & Measurement Motion Control Patient Bed - low magnetic signature Vacuum evacuated air mattress 25 cm of total vertical travel Manual X-Y horizontal positioning Vertical location measurement system with electronics readout. Computer controlled Z-position controller • • • • Model 5700 Biosusceptometer page 5 of 76 • • • • • 1.8.6 Gantry & Vibration Isolation System Gantry Structure Vibration Isolation System Mounts for water bellows reservoir Helium Transfer access region Liquid helium transfer tube 1.8.7 Computer Control and Data Collection System An operator desk and two separate electronics racks are supplied. The keyboard, mouse, 17" color monitor (1024 x 768 resolution) and Hewlett-Packard Color DeskJet Printer reside on the top of the desk. The first rack houses the computer and most of the electronics and is EMC shielded. The computer system includes an IBM compatible computer (400 MHz Pentium microprocessor, 6 GB hard disk, CD ROM Drive), 17” color monitor, with a second flat panel display for use during the measurement process. The computer also contains National Instruments data acquisition cards, RS-232 communication ports, a Centronics compatible parallel port, Windows 98 Operating System, National Instruments LabWindows CVI Development Software. The electronics housed in the rack are described in §2.2 The second electronics rack houses the water bag electronics (§1.8.3). A second flat panel display for use during the measurement process should be located near the patient bed or mounted on the gantry A second off-line computer is supplied for off-line post processing. This system can be used for final data analysis. This computer has the ability to share files via either networking or via "superdrive" format. 1.9 Schematic The system block diagram is shown below. It consists of many integrated subsystems described earlier. Model 5700 Biosusceptometer page 6 of 76 System Schematic Data Analysis PC 2nd Monitor SQUID Controller LHe level Meter Ch. 1 Ch. 2 Ch. 3 Helium Flow Meter Ne tw ork Magnet Controller Co nn ec . Liver RS-232 Waterbag System -----------flow control ---------------temperature control DAC 16-Bit 100kS/sec, SQUID Signals SQUID Sensors (3) Detection Coils and Magnet Flow Control Locator Loops Analog Reference signals Water Bag Hydrostatic Control, Flow control Liver Motorized Patient Bed Waveform Generators Travel On/Off Switch Position Transducer Handheld Controller (Bed motion Up and Down, Waterbag Fill and Empty, Reset, Measurement Control) Motion Limits Position Motor Controller Digital I/O Figure 1-5 System Schematic 2 Preparation for Use or Return 2.1 Site Requirements 2.1.1 Site Selection The model 5700 biosusceptometer is a detector of magnetic flux that that is amplified and transformed by the SQUID system into a room temperature output voltage. This voltage is directly related to the iron stores in the liver. Signals can also be induced from sources other than the liver, in particular electromagnetic interference. Examples include power distribution panels, autoclaves, telephone switching equipment and cellular base stations. The model 5700 biosusceptometer can detect signals as small as 10-13 tesla. Because of this, attention must be paid to external noise sources. The goal of a site survey is to determine the optimum site to place an instrument. Hospitals and other facilities in urban environments can be extremely noisy due to electromagnetic radiation (rfi), low-frequency magnetic noise, and noise at intermediate frequencies contributed by machinery and power lines. The use of gradient configuration detection coils in the model 5700 biosusceptometer can overcome much of this noise in a normal laboratory setting; but greater noise reduction may be needed for routine clinical applications. Environmental noise can be particularly severe at low frequencies. A site survey prior to system installation must be performed to determine the ambient noise and the level of shielding required. An extremely sensitive (e.g., SQUID or flux-gate) magnetometer should be used for the site survey. Tristan Technologies can not be responsible for substandard system performance if the model 5700 Model 5700 Biosusceptometer page 7 of 76 biosusceptometer is sited in a noisy environment. If you need assistance in performing a site survey, contact your local Tristan Representative. Shown below are representative measurements of measurements made at a poor site (Figure 2-1) and one at a better site (Figure 2-2). In terms of magnetic fields, one large division is equivalent to 2½ mGauss or 250 nanotesla. You should also ignore the thickness of the field plot as that is due to the high bias frequency of the flux-gate magnetometer used to make the measurements. What is important is the average movement of the line. As can be seen in Figure 2-1, there are two structures to consider. The first is a lower frequency drift that occurs over tens of seconds with variations on the order of 250 – 500 nanotesla. The second is the much more rapid ~ 750 nanotesla spikes that occur multiple times over the 500 second measurement cycle. Figure 2-2 shows the measured field noise in a better location. As can be seen (removing the flux-gate high frequency signals), there is significantly less low frequency drift (≤ 250 nanotesla) and no observable spiking. Clearly, the second site is superior to the first. Figure 2-1 Poor Site Figure 2-2 Good Site In general, what you want to avoid—when siting any SQUID magnetometer—are elevators, subways and trains, automobiles, and any other large metal (especially containing iron or steel) objects. Anything that gives a low frequency signal may cause the model 5700 biosusceptometer to give inaccurate results. Powerline (mains) fields at 50 Hz should be below 1 microTesla (0.01 gauss). To avoid ground loops (and subsequent 50 Hz pickup), the system requires an electrical Model 5700 Biosusceptometer page 8 of 76 ground spike attached at a single point. Radiated rfi levels of 0.1 volts/meter may impare the ability of the SQUID electronics to track signal changes. Basically, you should look for a location where there are no ferrous materials within a 15' perimeter of the instrument and a 30' perimeter where there are minimal metallic structures (e.g., gurneys, wheeled chairs and steel desk draws, etc.). Moving an interference source at 15’ to 30’ will reduce its influence by 20 dB. Obviously, a ground floor is preferred to a location on a upper floor. In any case, the floor beneath the model 5700 must have no iron rebar in the concrete. To reduce motion induced artifacts, the pad on which the model 5700 sits should be vibrationally isolated from the rest of the building. 2.1.2 Space Requirements Sufficient space must be allocated to the model 5700 biosusceptometer, not only to allow safe and proper operation of the system, but also to prevent claustrophobic reactions from the patients being measured. The Site layout is shown in Figure 2-3. The water bag rack is in a different room from that of the rest of the equipment. The water bag system should be operated floating from that of the main system in order to avoid ground loops. N Figure 2-3 Room Layout 2.1.3 Power Requirements • 200V 4.5VA for Main Rack and computers • 200V 2.4VA for water bag assembly An electrical ground to good earth ground (via spike) must be provided near the data acquisition rack. For safety purposes, an interruptible circuit breaker should be provided at the wall power. This will connect to a single button (Red Button) on the side of the gantry that makes a contact closure when activated. 2.2 Items Supplied in the model 5700 Biosusceptometer Rack Instruments Model 5700 Biosusceptometer page 9 of 76 Knurr 19” Rack model MR19696C Hewlett-Packard Signal Generator model HP33120A Hewlett-Packard Power Supply #1 (magnet) model HP6541A Hewlett-Packard Power Supply #2 (z-transducer, flow meter) model HPE3630A Power Supply #3 Power supply #4 Kollmorgen Motor Controller (single-axis) model KXA-80-10-20 Tristan iMAG® SQUID Controller model iMC-303 (R 4.01 Chksum 0AD5) American Magnetics Level Meter model 135 Sierra Instruments Helium Flow Meter model 824-CE-13-OV1 Computer system: Dell CPU model Optiplex (in rack) Xpert graphics cards & superdrive Dell CPU model Optiplex & superdrive Dell Monitor #1a model M991 Dell Monitor #1b model FPD 1701 FP analog Dell Monitor #2 model M991 National Instruments DAC card #1 model PCI-6023E (in rack) National Instruments DAC card #2 model PCI-6031E (in rack) National Instruments Isolated Serial card (in rack) Hewlett-Packard Printer model Laserjet 1200 Knurr Desk model 0.302.803.4 Sensor System Tristan model BMD-35M liquid helium dewar American Magnetics model 135 liquid helium level sensor Tristan model iFL-301-L flux-locked loops (3) Tristan model LSQ/20M dc SQUID sensors (3) Lakeshore Silicon diode temperature sensors model DT-470-SD-13 (3) Motorized Patient Bed Gantry Water bag system including pump and microprocessor controller (in second rack) Vacuum mattress (including pump) Locator loops Cross Plane lasers Transfer line Phantoms 2.3 Initial Inspection All Tristan instruments and equipment are carefully inspected and packaged at Tristan prior to shipment. However, if a unit is received mechanically damaged, notify the carrier and the nearest Tristan representative, or the factory in San Diego, California. Keep the shipping container and packing material for the carrier and insurance inspections. Even if there is no apparent damage, we recommend you keep all packing materials until the system is fully operational. WARNING Model 5700 Biosusceptometer page 10 of 76 DO NOT INVERT THE PROBE WITHOUT USING CARE TO AVOID DAMAGE TO THE RF SHUNT SHIELDS. THESE SHIELDS ARE TAPED AND GREASED IN PLACE ONLY. If the unit does not appear to be damaged but does not operate to specifications, contact the nearest Tristan representative or the Tristan factory and describe the problem in detail. Please be prepared to discuss all surrounding circumstances, including installation and connection detail. After obtaining authorization from the Tristan representative, return the unit for repair along with a tag to it identifying yourself as the owner. Please enclose a letter describing the problem in as much detail as possible. 2.4 Unpacking The model 5700 and accessories is shipped in several crates. Before opening any of the crates, inspect the crates for obvious shipping damage. If damage is observed, immediately notify the freight carrier (and Tristan) prior to opening the crate(s). Open all shipping containers and carefully remove all supports, cushioning and tape (where applicable) being careful to secure any movable or loose parts. Carefully inspect all components for signs of damage (dents, scratches, punctures, broken controls or indicators, etc.). If damage is observed, immediately notify the freight carrier, your local Tristan representative and Tristan. NOTE KEEP THE SHIPPING CRATES UNTIL THE SYSTEM IS FULLY OPERATIONAL If the system or any part must be returned to Tristan, the original crates must be used to properly pack the system and avoid shipping damage. If the crates have been discarded, it is the responsibility of the user to supply equivalent crating to ensure safe return of the shipped items. CAUTION THE DEWAR (Figure 2-5 & Figure 2-7) TAIL IS VERY FRAGILE. DO NOT REST IT ON THE TAIL SECTION. The model 5700 is very sensitive of magnetic fields and magnetic contaminants. The tail section of the dewar must be kept clean of contaminants. Handle and store the dewar section accordingly. The dewar/sensor assembly is shipped upside down. When removing the dewar/sensor assembly from its crate, first inspect it to ensure that it is still under vacuum. If the bottom plate (to which is attached the tail piece) appears loose, contact Tristan immediately. Assuming that the bottom plate is firmly attached to the dewar belly (i.e., the interior vacuum is good), follow the following steps: • Prepare wood blocks to rest the dewar top plate on. Be sure that the top plate connectors will not rest on any of the blocks. • Remove the dewar/sensor assembly from its crate and rest it on the wood blocks. • Remove the wooden sensor box from its crate. • Prepare a temporary stand to rest the dewar on after it has been turned right side up. The stand should be at least 50 cm above the floor to prevent the dewar from resting on its tail. Model 5700 Biosusceptometer page 11 of 76 • • • Lift the dewar/sensor assembly off the wood blocks and carefully tip it right side up. The carefully rest it on the temporary dewar stand. §2.5.1.2 will describe how to place the dewar in the sensor assembly box section of the gantry. Prepare a temporary stand to rest the wooden sensor assembly box on. This stand must have a 15 cm diameter hole in it and be at least 45 cm above the floor to prevent the dewar from resting on its tail. A cutout in the side is preferable. Lift the dewar from its resting place on the temporary stand and set it in the wooden sensor box. Be careful not to damage the dewar/sensor tail. If you are using rope to lift the dewar, make sure that the rope(s) is firmly attached to the dewar section and is not directly attached to the tail. 2.5 Preparation for use 2.5.1 Installation of Gantry Completely assemble the gantry except for the wooden dewar/sensor support; after the initial helium transfer, the sensor is mounted in the wooden support and then the support is mounted to the gantry. Take care to locate the gantry in its final position; it is not an easy item to move. Use the adjustable feet under the side support pillars to level the gantry. After the Gantry piers are put in place, mount the wooden dewar/sensor box, being careful not to damage the dewar tail. The assembled gantry is shown below. Figure 2-4 Gantry Assembly 2.5.1.1 Pumping of dewar Dewars are shipped with the vacuum space evacuated. Atmospheric pressure actually holds the end pieces (top and bottom plates) of the dewar together. The vacuum space is evacuated via the evacuation valve on the dewar top plate. The vacuum is maintained using two large gasket seals on either end of the dewar outer case tube. IMPORTANT: Please make certain that the dewar tail does not twist relative to the top plate if the pressure is released. If the dewar vacuum has deteriorated while the dewar was warm (usually due to shipping damage) it will be noticeable during liquid nitrogen precool as the outside walls of the dewar will Model 5700 Biosusceptometer page 12 of 76 get cold and perhaps even condense water. Any attempt to transfer helium under these conditions will be futile. The outside walls will get quite cold but no helium will collect in the dewar. If this occurs, contact your local Tristan representative before proceeding. Since helium can diffuse through warm fiberglass, do not let helium gas remain in a warm dewar for extended periods. The elements in the dewar vacuum space may "outgas", particularly at room temperature. For this reason, an air getter material is in the vacuum space to adsorb air and even helium when cold. The vacuum should hold for a long period of time, a year or more. 2.5.1.2 Placement of dewar in Gantry Figure 2-5 shows the cross section of the dewar. The dewar "belly" has a volume of about 35 liters. This structure should not be tipped when full. Care must be taken to not freeze the O-ring at the top of the dewar or the O-rings at the connectors. Care should be taken for the connectors for the SQUIDs in particular since they could collect cryogenic liquid during a transfer. Make sure there is a safety mechanism for the lifting of the dewar (separate safety straps) and that there are multiple personnel (spotters) present when lifting the dewar. A fall will destroy the dewar. Damage to the dewar due to improper handling is not covered by the warranty or service contract. Figure 2-5 Dewar cross-section This dewar must be installed in the gantry box and then installed in the gantry. The final assembly is shown below. The preferred method is to install straps on the side of the dewar. The dewar is lifted into the gantry box via the external straps and then placed on a rubber vibration isolation on the inside bottom of the gantry box. If the straps do not interfere with the measurement process, they may be left in place. Otherwise the straps should be removed. The gantry box may then be placed on an electric lift. This structure is then lifted into place into the gantry. Model 5700 Biosusceptometer page 13 of 76 Figure 2-6 Dewar in Gantry 2.5.2 Installation of water bag See the separate documentation for the installation and filling of the water bag subsystem (Figure 2-7). It is important to note that the air must be removed from all the lines for the system to function. Small amounts of air will prevent the bag from rising. Always used clean, iron-free distilled water. Figure 2-7 Water Bag assembly A block diagram of the water bag fill assembly is shown below. This structure must be filled with water without leaks so that the entire assembly is hydraulic (and not pneumatic). All air must be removed. The most effective technique is to bleed from the top points and to use the pump to flush water plus air through the system and that the air collects at the high points. Model 5700 Biosusceptometer page 14 of 76 Figure 2-8 Water bag flow schematic 2.5.3 Preparation of subject bed The patient bed may now be brought into position. There is a strap which holds the top of the bed snug against the base; this fastening is to prevent damage to the bed lifting mechanism during shipment. This strap should be released so that the bed is free to rise. CAUTION Once the strap has been released, DO NOT try to lift upper bed surface. The height of this surface must ONLY be varied using the electrical motor (via the Hand Held Control unit and software). Once the turnbuckle has been removed and all the system electrical connections have been made, the bed should be tested for function. Verify that the tape switch, the counterclockwise (CCW) limits and the clockwise (CW) limits all function. Verify that the position transducer is read by the software. Figure 2-9 Bed assembly Model 5700 Biosusceptometer page 15 of 76 2.5.4 Interconnects 2.6 Reshipment 2.6.1 Repackaging for return shipment If it is necessary to return the system, you should repack the unit in its original container (if available). For this reason, it is advisable to save the original crate(s) or manufacturer's packaging sent by Tristan; however, if this is not possible, use the following instructions for recapping. 1. Wrap the unit in either bubble wrap or foam rubber. 2. Cover the bottom of a sturdy container with at least 8 cm of Styrofoam pellets or shredded paper. 3. Set the unit down onto the packing material and fill the rest of the container with Styrofoam or shredded paper. The unit must be completely protected by at least 8 cm of packing material on all sides. 4. The dewar must be shipped inverted. Care must be taken not to damage any of the connectors on the dewar top (Fig 2.6). If the dewar vacuum is poor, the top plate, center tubing and bottom plate (including the tail section) must be secured to avoid separation of the dewar sections or relative motion of any part of the dewar. Failure to follow these directions will void any warranty. 5. Damage indicators, such as shock watches and "tip-N-tells", should be attached to the shipping crates. 6. If you are unsure how to pack the items, contact your local Tristan representative or Tristan directly. 2.6.2 Return from Customers outside the U.S To avoid delays in Customs clearance of equipment being returned, contact the Tristan representative in your area, or the Tristan factory in San Diego, California, for complete shipping information and necessary customs requirements. Failure to do so can result in significant delays. 3 Operation 3.1 Introduction The cryogenic system consists of a fiberglass fixed tail liquid helium dewar (see Figure 2-5) containing three channels of SQUIDs and detection coils and an integral superconducting magnet. 3.2 • Initial Operation 3.2.1 Initial Cooldown Inspect dewar and verify internal cavity is free from ice, moisture, or other contaminants. Contaminants could result in incorrect measurements or dewar/sensor damage! Model 5700 Biosusceptometer page 16 of 76 3.2.1.1 Liquid nitrogen precool Be sure that the dewar is dry before proceeding. Water should never be allowed to collect inside the dewar. Water has a large enthalpy and will require significantly more liquid nitrogen and/or helium to precool a warm dewar that has water in the inner vessel. The system should be precooled with liquid nitrogen to ease cooling and conserve liquid helium. Ideally, liquid nitrogen should be transferred into a tilted dewar. Do not shock cool the dewar interior. The dewar's being tilted by about 3" at the edge of the base will allow the liquid to cool the belly of the dewar first and then cool the feedthrough. This minimizes the stress being placed on any vacuum connectors. The initial fill with nitrogen should take about 5 liters. The amount is chosen by watching the temperature until liquid collects and then letting the dewar warm above the liquid temperature. Do not overfill, otherwise you will have to wait until the liquid nitrogen has evaporated before proceeding to the next step. When the dewar has no liquid nitrogen it is then safe to transfer the liquid helium. This normally takes about 6 hours to cool. • • • • • • • 3.2.1.2 Initial transfer of liquid helium Verify that the liquid helium level detector is operational. Instructions on the use of the AMI model 135 can be found in its manual (separately supplied). Make sure the BMD-35M dewar is empty of liquid nitrogen. For the initial transfer, it is recommended that 100 liters of liquid helium be available. Verify the helium level in the storage dewar and the BMD-35M dewar. Open the transfer and vent ports at the top of probe. Set the AMI model 135 level detector toggle switch to UPDATE. Begin the helium transfer, observing all standard cryogenic handling and safety procedures. Unless otherwise directed by Tristan personnel, do not shock warm dewar with liquid nitrogen or helium. IMPROPER INTRODUCTION OF LIQUID NITROGEN OR HELIUM DIRECTLY INTO THE DEWAR MAY PERMANENTLY DAMAGE THE DEWAR AND WILL VOID THE WARRANTY. • • • • • • • • Cool the dewar slowly. Expected cooling time is on the order of six hours. Observe transfer levels. * Note: dewar capacity of the BMD-35M is 35 liters. When the liquid helium level meter indicates > 90% prepare to stop the transfer. In any case, do not fill the dewar above 99.9% Plug transfer and vent ports after allowing sufficient vent time. Verify all connectors at top of probe are free from moisture. Figure 3-1 shows the internal temperatures of the dewar/sensor assembly. With liquid nitrogen precooling, it takes approximately six hours to go from 80 K to < 5 K. If liquid nitrogen precooling is not used, the cooling time is significantly longer and more liquid helium will be required to cool the dewar/sensor array from room temperature to 4.2 K. In this situation, we recommend having a minimum of 200 liters of liquid helium available for the initial cool-down. Set the AMI model 135 level detector toggle switch to SAMPLE. Set the interval to 60.0 minutes (see AMI manual for instructions). Model 5700 Biosusceptometer page 17 of 76 He Xfer Nit PC 10L Cooling #5 SQUIDS OK 100 K Squid Coils OK T 4K shield T thermal post T Joint plate 10 1 0 1000 2000 3000 Minutes Figure 3-1 Dewar Initial cooling 3.2.1.3 Tuning of SQUID electronics A complete description on the Tristan iMAG® electronics and instructions on how to tune the SQUID electronics can be found in the iMAG® manual. A table of the SQUID and tuning parameters is shown below. Channel Volts p-p Bias Mod V/Φo (x100 scale) 1 2 3 Table 3-1 SQUID Tune Parameters 3.2.1.4 Charging of superconducting magnet Magnetic field is injected into the superconducting magnet by driving a current through the coils (Figure 3-2). To inject current into the magnet, it is necessary to open (drive "normal" or make non-superconducting) a small portion of the magnet coil. A region of the coil (actually a section of the magnet wiring well above the active portion of the magnet—we call this section the persistent switch) is heated up to drive the connecting section normal. In that situation, the circuit is open and current can be injected into the coil. When the desired current (and equivalent magnetic field) is achieved, the persistent switch heater is turned off and the switch cools down, becoming superconducting. The current then flows through the persistent switch section completing the circuit. At this point, the HP 6541A power supply can be turned off as the magnetic field (current) is trapped inside the coil. The relaxation time after setting (or changing) a dc field can be as long as 4 to 6 hours. Model 5700 Biosusceptometer page 18 of 76 To remove the field, it is necessary to turn on the HP power supply and drive the current up to its previous value before opening the persistent switch. To HP Power Supply To HP Power Supply Heater on Heater off Figure 3-2 Conceptual drawing of a persistent mode superconducting magnet The magnet power supply system has four heaters (one for the persistent switch and three to heat each of the SQUID sensors) and a high current Hewlett Packard model 6541A power supply. The charge circuit is shown in Figure 4-3. Figure 3-3 Heater Switch Front Panel (part of system control instrument rack) The switch heater (in Figure 4-2) is run normal by 1V (=1V/50ohms). The SQUID input heaters (SQ.1, SQ.2, SQ.3 in Figure 4-2) are also run normal by 1V. A normal charge from 0 to Imax consists of : First testing the individual functions(ohms, volts , etc). • Check the voltage, switch current and magnet current for correct resistance and grounds. • Run current in leads while monitoring the voltage • Run magnet heat switch while reading the magnet volts Then charge the magnet to full field by 1. Check the helium level and transfer if necessary 2. running the switch normal (1 V), 3. ramping the current to 10 A, Model 5700 Biosusceptometer page 19 of 76 4. run the switch (in Figure 4-3) to superconducting (0 V), 5. then ramp the current to zero. This should be done in less than 2 minutes. High current boils off helium and can heat the wire leads inside the dewar assembly to destruction. The discharge differs mainly in that the persistent current is first matched and then the switch is run normal and the current decreased to zero. 3.2.1.5 Filling of water bag system A block diagram of the water bag fill assembly was shown in Figure 2-8. This structure must be filled with water without leaks so that the entire assembly is hydraulic (and not pneumatic). All air must be removed. The most effective technique is to bleed from the top points and to use the pump to flush water plus air through the system so that the air collects at the high points. The water bag fills and empties either through the LabWindows/CVI control software or via a terminal program (19,200, 8, 1, N, none). The bottom membrane is latex. It can be very easily ruptured. 3.2.2 System Calibration The system calibration is covered in §4.1.3. The position transducer, and locator loop calibration are very essential to the system operation and accuracy of the [Fe]. The actual number that the system yields is calibrated against a plastic phantom. The system is calibrated on G20. 3.2.3 Ongoing Maintenance 3.2.3.1 Liquid helium level and flow monitoring The system use of helium must be carefully monitored. The flow meter is read by the system software and has alarms at 200 and 2000 std cc of helium gas/minute (SCCM). Per initial system designs, the level meter is not read by the software, but is manually entered. This allows for noise-free data acquisition. The helium level is read by connecting the cable at the top of the dewar, reading the level meter and then shutting the meter off and disconnecting the cable. The value read may be entered into the software at any time to estimate helium transfer time. The front panel software screen is only the estimated rate per last data entry. Note that aftet first cooling a portion reflects the increased boiloff due to the initial transfer. As the interior portions of the dewar/sensor array achieve stable temperatures, the boiloff decreases to an equilibrium value. 3.2.3.2 Low and high flow conditions The system has flow alarms set at 200 (low) and 2000 (high) SCCM of helium flow. The front panel display is not measured. It is an indicator only. • • • • • • 3.2.3.3 Liquid helium refills Verify helium level in storage dewar and dewar. Open transfer port and vent port at top of probe. Begin helium transfer observing all standard cryogenic handling and safety procedures. Observe transfer levels. * Note: Dewar capacity is 35 liters. Do not continue transferring past 99.9%. Plug transfer and vent ports after allowing sufficient vent time. Model 5700 Biosusceptometer page 20 of 76 Verify all connectors at top of probe are free from moisture. 3.2.3.4 SQUID defluxing The SQUIDs are normalized through the iMAG® software and the front panel switches. Switches 1-3 (Figure 3-3) control the flux in the input loop. The iMAG® heater controls the flux in the SQUID. Both should be normalized after a magnet charge or excessive noise is suspected (like a wrench near the bottom of the dewar). 3.2.3.5 Water Bag Maintenance The water bag maintenance is covered in a separate document. The diaphragm is very easy to rupture and care must be taken to visually observe the pressure and the degree of deflection of the bottom of the assembly. 3.2.4 Safety Precautions for handling cryogenic liquids The potential hazards of handling liquid helium stem mainly from the following properties: WARNING 1. THE LIQUID IS EXTREMELY COLD (HELIUM IS THE COLDEST OF ALL CRYOGENIC LIQUIDS). 2. THE ULTRA-LOW TEMPERATURE OF LIQUID HELIUM CAN CONDENSE AND SOLIDIFY AIR. 3. VERY SMALL AMOUNTS OF LIQUID HELIUM ARE CONVERTED INTO LARGE VOLUMES OF GAS. 4. HELIUM IS NOT LIFE SUPPORTING. Extreme Cold-- Cover Eyes and Exposed Skin Accidental contact of liquid helium or the cold gas that results from its rapid evaporation may cause a freezing injury similar to a burn. Protect your eyes and cover the skin where the possibility of contact exists. Eye protection should always be worn when transferring liquid helium. Keep Air and Other Gases Away from Liquid Helium The low temperature of liquid helium or cold gaseous helium can solidify another gas. Solidified gasses and liquid, particularly solidified air, can plug pressure-relief passages and foul relief valves. Plugged passages are hazardous because of the continual need to vent the helium gas that evolves as the liquid continuously evaporates. Therefore, always store and handle liquid helium under positive pressure and in closed systems to prevent the infiltration and solidification of air or other gases. Do not permit condensed air on transfer tubes to run down into the container opening. Keep Exterior Surfaces Clean to Prevent Combustion Atmospheric air will condense on exposed helium-cooled piping. Nitrogen, having a lower boiling point than oxygen, will evaporate first from condensed air, leaving an oxygen-enriched liquid that may drip or flow to nearby surfaces. Areas and surfaces upon which oxygen-enriched liquid can form, or come in contact with, must be cleaned to oxygen-clean standards to prevent possible ignition of grease, oil, or other combustible substances. Leak-testing solutions should be selected carefully to avoid mixtures that can leave a residue that is combustible. When combustible type foam insulation is used, it should be carefully applied to reduce the possibility of exposure to oxygen-enriched liquid that could, upon impact, cause explosive burning of the foam. Model 5700 Biosusceptometer page 21 of 76 Pressure-Relief Devices Must Be Adequately Sized While most cryogenic liquids require considerable heat for evaporation, liquid helium has a very low latent heat of vaporization. Consequently, it evaporates very rapidly when heat is introduced or when liquid helium is first transferred into warm or partially-cooled equipment. Even minor deterioration of the vacuum in the helium container can result in significant evaporation. Pressure relief devices for liquid helium equipment must, therefore, be of adequate capacity to release helium vapor resulting from such heat inputs, and thus, prevent hazard due to excessive pressure. This system has been designed to safely vent the evolving helium gas in the event of any reasonable failure mode. WARNING DO NOT MAKE ANY MODIFICATIONS TO THIS SYSTEM THAT MIGHT AFFECT ITS ABILITY TO VENT HELIUM GAS IN THE EVENT OF AN EMERGENCY SUCH AS LOSS OF VACUUM IN THE DEWAR VACUUM SPACE. If transfer lines can be closed off at both ends so that a cryogenic liquid or the related cold gas can become trapped between the closed ends, a pressure-relief device must be provided in that line to prevent excessive pressure build-up. Keep Equipment Area Well Ventilated Although helium is nontoxic, it can cause asphyxiation in a confined area without adequate ventilation. Any atmosphere which does not contain enough oxygen for breathing can cause dizziness, unconsciousness, or even death. Helium, being colorless, odorless, and tasteless cannot be detected by the human senses and will be inhaled normally as if it were air. Without adequate ventilation, the expanding helium can displace air and result in an atmosphere that is not life-supporting. The cloudy vapor that appears when liquid helium is exposed to the air is condensed moisture, not the gas itself. The issuing helium gas is invisible. Liquid containers should be stored in large, well ventilated areas. If a person becomes groggy or loses consciousness when working around helium, get them to a well ventilated area immediately. If breathing has stopped or if a person loses consciousness, apply artificial respiration and summon a physician immediately. 3.3 Normal Operation 3.3.1 SQUID Electronics See the User's Manual for iMAG® Multi-Channel SQUID System for tuning the SQUIDs. Use caution when handling the delicate fiber-optic cables connecting the Flux-locked loops and SQUID control electronics. Do not bend smaller than a 10 cm radius. 3.3.2 Handheld Controller The Hand Held Controller (HHC) shown below controls all of the motion of the bed, data acquisition, and water bag functions. The signals to the bed are digital enables and voltages to the motor controller. The control to the water bag is via RS-232 commands. The commands are self explanatory. It is important to remember that not all of the buttons work in all of the software screens. The control was purposely limited, but can be expanded as required. Model 5700 Biosusceptometer page 22 of 76 FAST SPEED SLOW RESET UP FILL BED WATER DOWN EMPTY NEXT START BACK STOP Figure 3-4 Hand Held Controller (HCC) 3.3.3 Magnet Power Supply The magnet power supply system of a low power current supply for the heat switch, a voltmeter, and a second high current supply. (Three similar low power heaters are used for warming the SQUID circuitry to remove trapped flux.) The charge circuit is shown below in Figure 4-3. The switch heater is run normal by charging the circuit to 1 volt (1V/50 ohm). The SQUID input heaters are also run normal by 1 volt. During a normal charge, the individual functions are first tested. The current (and polarity) of the last magnet charge must be matched (unless the magnet has lost persistence), the switch heater powered on (2 series switches) and then the new current applied, switches off, and current deceased to zero. This should be done in less than 2 minutes. High current boils off helium and can heat the wire leads inside the dewar assembly leading to potential damage. 3.3.4 Dewar and Sensor Assembly The dewar and sensor are described elsewhere. The dewar keeps the sensor cold and the magnetic field in the magnet. 3.3.5 Patient Bed The Patient bed lifts and lowers the subject and reports the bed Z position and also has emergency shut-offs for clockwise and counter-clockwise limits and if a person puts a hand between the lowering surfaces. Model 5700 Biosusceptometer page 23 of 76 3.3.6 Water Bag The water bag fills and empties either through the LabWindows/CVI control software or via a terminal program (19,200, 8, 1, N, none). The bottom membrane is latex. 3.3.7 Computers The computers and data acquisition are described in §1.8.7. and shown in the system schematic. One computer is for acquisition and the second is for analysis. The computer interfaces with 2 National Instruments I/O cards and 3 serial ports. A printer and a flat panel monitor are also provided. 3.4 Liquid Helium Level Meter The system includes a 14” superconductive filament liquid helium level sensor (schematic diagram is shown in Figure 3-5). The sensor uses a single filament of NbTi as the level sensing element. To activate the sensors a small constant current (approximately I = 70 mA) is applied to the filament forcing the portion of the filament which is in the helium gas to become resistive. The portion of the filament in the liquid remains superconductive. By reading the voltage across the filament one can determine the length of filament which is resistive. Leads Heater 15 Ohm 4.6 Ohm +I 15 Ohm +V S.C. Filament R=121.4 Ohm 15 Ohm -I 15 Ohm -V Figure 3-5 Liquid helium level meter block-diagram DO NOT LEAVE LEVEL METER IN THE CONTINUOUS POSITION When turned on, the level detector passes a ~75 mA current though a thin superconducting wire. When immersed in liquid helium, the wire remains superconducting. Any portion of the wire not in liquid does not have sufficient cooling to remain superconducting and becomes resistive with a resistance of 4.5 Ω/cm length. Since the active length of the sensor installed on this probe is 30 cm, a 67% full reading is equivalent to 20 cm being superconducting and 10 cm being normal with a resistance of 45 Ω. With a 75 mA current, this generates 250 mW, equivalent to a boiloff of an additional 8.4 liters/day of liquid helium. Leaving the level meter in the continuous position with a 0% reading will generate heat equivalent to an additional 25 liters/day helium boiloff. Instead, switch the model 135 meter toggle switch to INTERVAL. Below is presented a wiring diagram and pin assignment for the level meter connector. Model 5700 Biosusceptometer page 24 of 76 Figure 3-6 Helium level meter connector 3.5 Taking the System Out of Service 3.5.1 Removing field from the magnet The removal of the field from the magnet must be done by matching the current already existing in the magnet and then running the magnet heat switch normal (NOTICE --one switch and one connector). The field must be decreased in < 2 minutes to avoid excessive helium usage and potential damage to the wire leads inside the dewar/sensor assembly. DO NOT HEAT THE SWITCH WITHOUT MATCHING THE CURRENT (unless internal field lost). 3.5.2 Warming up the dewar Prior to warming up the dewar, ensure that no current is trapped in the superconducting magnet (§3.6.1). Failure to remove the field from the magnet will damage the magnet and void any warranty or service contract. Fiberglass dewars such as the BMD-35M supplied with this system should NEVER be allowed to warm up by simply letting all the helium evaporate. If this is allowed to happen and the inside fiberglass warms to near room temperature, helium gas will diffuse through the dewar walls and soften the vacuum space of the dewar. To prevent this, you should wait for about one to four hours AFTER the helium level has reached 0% and then backfill with nitrogen gas. Then let the dewar warm up to room temperature. If this procedure is used, it will be necessary to make sure that any water which condenses in the dewar is removed prior to using the system again. This can be done by blowing dry room temperature air into the tail of the dewar. WARNING DO NOT BLOW HOT AIR INTO THE DEWAR AS THIS MAY CAUSE FAILURE OF THE EPOXIED JOINTS. 3.5.3 Removing dewar from Gantry The dewar can be removed from the gantry by reverse of the above procedure. Make sure that the dewar lifting straps are securely attached and that there is a safety and multiple spotters. 4 Theory of Operation Model 5700 Biosusceptometer page 25 of 76 4.1 Principles of biosusceptometry 4.1.1 Magnetic Susceptibility All materials are influenced by magnetic fields. How the materials respond to applied magnetic fields determines their magnetic properties. Ferromagnetic materials such as iron act to strongly concentrate magnetic flux and are greatly attracted to an induced magnetic field. In addition, the response is highly non-linear and hysteretic. Paramagnetic substances (metals other than iron, cobalt or nickel, gases like oxygen and some organic materials) are weakly attracted to an induced magnetic field. Diamagnetic materials (H2O and some organic materials) are very weakly repelled by an induced field. Finally superconductors are diamagnetic, but strongly repelled by an induced magnetic field. The response of paramagnetic and diamagnetic materials are linear and non-hysteretic. Mathematically, we can represent the magnetic interactions by the following equation: B=χH eq. 4.1 where B is the magnetization of the object, H is the applied magnetic field and χ is the object's magnetic susceptibility. Material response χ (SI units) Ferromagnetic Paramagnetic Diamagnetic Superconductor 1 ~ 100's 10-4 -10-6 -1/4π Non-linear & hysteretic Linear & Non-hysteretic Linear & Non-hysteretic Linear & Non-hysteretic Table 4-1 Table of Susceptibilities Although contaminants in the lung can be ferromagnetic (e.g., inhaled dust from welding), no known human tissues are ferromagnetic. Iron storage molecules such as ferritin and hemosiderin are paramagnetic with χ ~ 10-4. This paramagnetic response is directly proportional to the number of iron atoms present in these iron storage molecules. Thus a magnetic susceptibility measurement can directly determine the iron concentration. In reality, if there are diamagnetic or other paramagnetic materials present in the sample being measured, they must be accounted for. Fortunately, other than iron storage molecules, the human body does not contain other naturally occurring paramagnetic substances in measurable quantity. While not paramagnetic, body tissue is diamagnetic with χ ≈ -9·10-6, quite close to that of water. By taking into account the diamagnetic background contribution of body tissue (and ignoring the insignificant contribution from molecular oxygen, trace metals and deoxyhemoglobin), magnetic susceptibility measurements can be used to produce direct in-vivo measurements of hepatic iron concentration. 4.1.2 Theory of Biomagnetic Susceptibility The response of a magnetic susceptometer is given by the size of the magnetic flux change (∆Φ) produced at the pickup coil due to the presence of the object whose susceptibility is being measured. The flux change is calculated from the following volume integral: ∆Φ = (µo Id)-1 ∫v χ(r) Bf(r).Bd(r) d3r eq. 4.2 where χ(r) is the magnetic susceptibility of the test object, Bf(r) is the magnetizing field, and Bd(r) is the reciprocal flux density of the detector coil (i.e., flux density generated by a current of Id in the detector coil). In our case, Bd(r) is provided by a first-order gradient field coil which is Model 5700 Biosusceptometer page 26 of 76 coaxial with the detector coil set. The fields Bd and Bf are determined by the geometry of the coils which generate them, and the response flux ∆Φ can be calculated by numerical integration for a particular distribution of tissue of known susceptibility. The field at off-axis points values of Bf were computed numerically. The radial and axial components of the magnetic flux density produced by a simple circular loop of wire of radius r, carrying a current I are given by the usual equations involving elliptic integrals. The detector coil reciprocal field Bd was found simply by summing the contribution of each individual turn. The voltage response of the SQUID detector is directly proportional to the flux change through the detection coil. For a homogeneous object with cylindrical symmetry, the integral, ∫v Bd(q,z) Bf(q,z) q dqdz eq. 4.3 carried out over the volume of the test object, is proportional to the magnetometer response. This function, which we call the flux integral, was calculated numerically using a parabolic approximation to the field integrals. The q and z ranges were each divided into intervals, with size increasing with distance from the axis and origin. The liver was modeled as a hemisphere and a cylinder coaxial with the detector coils. The change of flux associated with lowering the liver from a distance d to infinity was calculated for a range of starting distances representative of real measurements. By fitting the output voltage V(z) of the SQUID detection circuitry as a function of depth (z) beneath the dewar tail, the susceptibility (χ) can be determined. To calculate iron concentration, some assumptions need to be made. The easiest is to assume that the susceptibility of the liver is much less than that of the surrounding tissue, e.g., skin, fat, muscle, ribs, etc. In this situation, χliver << χtissue. Additionally, we assume that the thickness of the overlying tissue (between the skin and liver is not excessive, i.e., the patient is not obese) and that the iron stores are homogeneous. While small variations in spatial distributions will not affect the quantitative measurements, significant inhomogenieties (on cm scales) may give rise to errors. First Order Approximation: to 1st order, the voltage output is given by V(z) = C ∆χliver Φ + ∆Vsystem(z) + Vo eq.4.4 where z is the distance of the skin beneath the dewar tail, C is a constant determined by the system calibration, Φ is the flux integral (eq. 4.3), ∆Vsystem(z) is the contribution from the locator loops, and Vo is the voltage at the start of the measurement Inaccuracies can result these conditions are not met. For example, an obese patient with a known normal [295 µg/g] iron concentration can measure significantly higher [~1500 µg/g] if the added distance of the overlying tissue is not taken into consideration. Second Order Approximation: a more accurate determination of iron concentration can be made using a second order fit by taking into account the contributions of the surrounding tissue. This is especially important in obese patients and situations where χtissue > χliver /10. Here V(z) = C {∆χtissue Φtissue(z) + ∆χliver Φliver(z + zliver)} + ∆Vsystem(z) + Vo + O3(z) eq. 4.5 where ∆χtissue and Φtissue is the susceptibility and flux integral of the overlying tissue respectively, zliver is the depth of the liver beneath the skin and O3 is the error associated with higher order effects. A multiple linear regression can be used to determine relative to the reference medium (water). Deviations from this model are included in a usually small linear error term (O3(z) −> 0). The liver iron concentration is then calculated as cFe = ∆χliver/ξ with the volume susceptibility, ξFe = 1600·10-6 SI units for the paramagnetic hemosiderin/ferritin complex. See §6.1 for additional information. Model 5700 Biosusceptometer page 27 of 76 4.1.3 Calibration To determine the actual (equivalent) iron concentration, a linear fit between the actual Biosusceptometer system response at a depth and the calculated response of the system to a theoretical model at the same depth was performed. The depth is derived from the voltages generated by the locator loop, which has previously been calibrated against the position transducer. The slope of the linear fit between system response and the calculated response yields [Fe], the iron concentration. The software is capable of subtracting a uniform drift or background measurement response (i.e. locator loop), changing the reference analysis shape, and overlying tissue thickness. The calibration is done on gain G20. 4.1.4 Detection Coils The cryogenic sensor was constructed with a single magnetizing field and three detection coils. The magnetizing field was deliberately chosen to be a first order gradient configuration for noise reduction purposes and to reduce the signal from the lung or the gut. The sensor assembly comprises three detection coils [two 2nd order gradiometers of different radii and a third 1st order radial gradiometer] along with a 1st order persistent-current superconducting magnetic field coil. The field coil generates a magnetic field strength of 34 mtesla/amp at the skin surface. The SQUID detection coils were balanced with respect to the magnets to < 1% and to external fields. A radiofrequency low-pass filter transformer was installed in the input to reduce the system response to rfi signals over few tens of kHz. The detection coil assembly is shown below. Figure 4-1 Detection Coil Assembly 4.1.5 SQUID Circuitry The SQUID input circuit has two sections that must be separately normalized. The circuit centers around a transformer for stripping high frequencies from the SQUID input and allowing the injection of AC signals (external feedback) into the detection input. These lines are accessible inside the dewar. Model 5700 Biosusceptometer page 28 of 76 Figure 4-2 SQUID input Schematic Figure 4-3 Magnet Schematic The magnet has 6 leads (Figure 4-3) relative to its function. The voltage leads measure the voltage across the superconducting magnet. During regular superconducting operation there is no voltage. The heater drives the magnet switch normal so that current can be trapped in the magnet (§3.2.1.4). The magnet current must be driven through the currents leads only. These leads are connected with large bolts at the top of the dewar. As these leads carry significant currents (10 A), do not allow them to be shorted, grounded or touched. 4.1.6 Magnet Field Plots Figure 4-4 shows the on-axis field strength of the magnetic as a function of distance beneath the tail section of the dewar. It should be noted that the 5 gauss line is about 14 cm (5½") below the dewar tail. Model 5700 Biosusceptometer page 29 of 76 Magnetic field (in gauss) 1000 100 10 1 0 cm 2 cm 4 cm 6 cm 8 cm 10 cm Distance Beneath Dewar Tail 12 cm Figure 4-4 Magnetic Field Profile 5 Principle of the clinical method (BLS) The noninvasive method of Biomagnetic Liver Susceptometry (BLS) exploits different effects of superconductivity. Magnetic fields of 0 - 20 millitesla within the body tissue generated by an external superconducting field magnet (within the instrument) are measured by means of a SQUID magnetometer. SQUIDs are highly sensitive to the magnetic flux generated by moving a patient within the magnetic field, thus allowing the measurement of extremely small magnetic fields changes (in the range of 10-9 to 10-12 Tesla). For comparison, the magnetic field of the earth is ~ 5·10-5 T; the magnetic field generated by the heart (the cardiomagnetic field) is a million times weaker (~ 5·10-11T ). The in-vivo liver iron concentration of large near surface organs can be measured by means of the magnetic volume susceptibility of the respective tissue as long as the usually paramagnetic iron contribution (ferritin and hemosiderin iron) overwhelms the usually diamagnetic biological tissue contribution (water, skin, muscle, connective tissue, fat). The iron concentration cFe is related to the relative magnetic volume susceptibility ∆χ by cFe = ∆χ /χftn with the specific susceptibility χftn = 1600·10-6 SI·(µg/gtissue)-1 for the paramagnetic hemosiderin or ferritin iron complex. In contrast, the magnetic volume susceptibilities of most biological tissue is similar to that of water, i. e. χwater = -9.032·10-6 SI. The measurement is performed versus a water reference medium (water bag) covering the upper body with the advantage of reducing perturbation effects from the body surface and its tissue. Thus, to 1st approximation, one has to consider a magnetized organ moving in a nonhomogeneous magnetic field within a water surrounding. To date, the method can be applied only to organs such as livers and enlarged spleens (>300 ml) with a total error of σFe = 50 - 400 µg/gtissue. This replaces the biopsy with quantitative physicochemical estimation of the iron content. Model 5700 Biosusceptometer page 30 of 76 5.1.1 Typical Applications The most relevant applications of this method are related to iron overload diseases such as genetic hemochromatosis and siderosis caused by blood transfusions. The following main applications have been established so far: • monitoring iron overload in patients with transfusional siderosis (genetic ß-thalassemia major and sickle cell disease, or other transfusion dependent anemias) for the onset or intensification of chelation therapy and during this therapy, • assessing iron overload in ß-thalassemics scheduled for bone marrow transplantation (BMT) or monitoring iron overload in ex-ß-thalassemics after BMT scheduled for iron depletion therapy, • assessment of iron overload in patients scheduled for interferon therapy in liver diseases, • assessment of the long-term efficacy of different iron chelators under study, • diagnosis of genetic hemochromatosis (GHC) and assessment of the degree of iron overload in known GHC, • monitoring liver iron concentration in the initial and preservating phlebotomy therapy of GHC. 5.1.2 What type of patients can be measured In principle, nearly all kinds of patients between three and ninety years old with the ability to lie 30 minutes on a bed can be measured. In practice, there will be some difficulties with certain patients and some precautions have to be taken: • patients with large ferromagnetic contaminants such as pacemakers or ferromagnetic dust in the lungs (some welders) can not be measured, • measurements in patients with smaller magnetic contaminants such as dental clips, stainless steel screws and nails in bones and joints can be corrected for this far-field contribution, • no influence has been observed from port-a-caths, but active perfusion pumps have to be deactivated, • patients with a latex allergy may run a risk from skin irritation by the latex foil of the water coupling membrane, • children between three and five years old can often be measured in most cases without sedation after some time of accustoming to the procedure. This will be facilitated by the novel smaller water bag. Moreover, less precise measurements (σFe = 4-600 µg/g) versus air reference can be tried in children less than three years old, • measurements in adult obese patients with body mass index > 29 kg/m² are less precise (σFe = 3 - 500 µg/g) due to the large influence from fat in the overlying thorax tissue. Due to a better spatial resolution in the model 5700 SQUID biosusceptometer, the influence of the overlying thorax tissue will be better discriminated versus the liver and this error will become smaller. 5.1.3 Clinical data needed for evaluation of body iron stores Data such as Hb, serum ferritin, transferrin saturation (SI / TIBC), NTBI and serum vitamin concentrations (C, E) may be determined from a blood sample taken at the day of performing BLS after overnight fasting and discontinuing of any chelation therapy for 12 hours. Other data depend on the documentation protocol of the patient’s health care center, with the following priority: Model 5700 Biosusceptometer page 31 of 76 • • • • • • • representative iron transfusion rate or accumulated iron until date of BLS or last annually transfused iron (actual and year before), effective chelation rate = compliance · prescribed rate (actual and year before), serum ALT (GPT) and other liver function parameters, HCV positive or negative, HCV-RNA activity vitamin substitution (C, E), urinary iron excretion (UIE), LVEF or arrhythmia's for patients with cardiomyopathy. 6 Patient Measurements 6.1 Introduction This section gives a basic step-by-step introduction to the measurement procedure. It is recommended to use this information as a starting point for developing a patient measurement protocol. Figure 6-1 Software Introduction Screen 6.2 The Method of Patient Measurement 6.2.1 Patient pre-information Prior to the measurement, the patient should be informed about the non-invasive character of this type of measurement (no radiation, no MRI) and the underlying principle (change of magnetization is proportional to the degree of liver iron concentration). Additionally, the patient should be informed about some surprising or curious effects: • the feeling of the water bag may be compared with a baby of 8 kg, • the water coupling membrane could break (very rare event) with the effect of a small warm shower bath, • if possible, breath should be held (usually exhaled, seldom inhaled) for 10 seconds with priority to the first few seconds. At the end of the whole procedure, it is recommended that the patient be informed about the result directly in front of the data screen. Especially in thalassemics, this could improve Model 5700 Biosusceptometer page 32 of 76 compliance with the chelation therapy. However, this should be done with some care for the special psychological situation of certain patients. 6.2.2 Positioning and Measurement During the whole procedure, the patient (especially children) should be continuously informed about the different steps of the procedure. An overview should be given of the three main steps (positioning with sonography, BLS, liver volume estimation) and time duration (30 - 40 minutes) in their native language. They have to be asked before for their voluntary participation. In small children (less than seven years old), the whole procedure should be accelerated to the debit of precision in the measurement, because they get bored during the time of the procedure and will not sustain their position. Otherwise, one would risk the biomagnetometer measurement itself. Most lively children can be calmed down by getting them interested in the different steps of the procedure. For very anxious children, sedation may have to be envisaged. 6.2.3 Patient Preparation The patient should be undressed with no metallic objects (e.g., jewelry, watches, glasses, earrings) on his/her body. Items such as shoes, coat, pullover, trousers, bras and belts are not allowed. Cloth underwear, T-shirt, slip and socks may be left on. 6.2.4 Data needed directly prior to the measurement The patient’s name, birth date, principle diagnosis, date of splenectomy, height, weight, sex, and health care center is documented in the biomagnetometer logbook and on the biomagnetometer measurement report. Height, weight and total body fat (impedance measurement by TANITA body fat monitor/scale: mod. TBF 531) are measured, instantaneously and entered via the subject data screen (Figure 6-2). If the patient measurement is conducted via the position transducer, the "Closest Distance for the Position Transducer" is cm relative to the dewar face. After entering the patient information enter the file name to be used for the measurement. DO NOT MOVE THE BED OR WATER BAG DURING THE FILE NAMING. Figure 6-2 Subject Data Input Screen 6.2.5 Positioning of the patient After undressing, the patient is placed in supine position with the right side turned upwards on an evacuatable cushion of the biomagnetometer bed. The bed should be placed with its wheels’ Model 5700 Biosusceptometer page 33 of 76 placed on pre-positioned marks on the floor. For female patients with a full chest, this position should be turned more to the left, the right arm may be laid around the head, and with the hip position less prominent. These efforts result in an outstretched and horizontal thorax position, with a maximum organ volume on top. Optimum positioning can be facilitated by aid of small pillows, especially, under the waist in the case of spleen measurements. Figure 6-3 Subject Location Only a careful positioning guarantees a good quality of measurement. Positioning is adjusted under sonographic control and laser cross alignment with respect to maximum organ volume on top, minimum skin-organ distance, absence of any visible lung influence in the window of the 10 cm linear ultrasound probe and minimization of air influence within the intestine. After readjustment, the appropriate position is “frozen” under laser cross alignment by evacuation of the patient cushion. For precise measurements, a bedside procedure is mandatory, i. e., positioning under ultrasound imager control and biosusceptometry have to take place on the instrument’s patient bed in the same room. Moreover, only an ideal patient position (see §5.2.7) guarantees a correct distance measurement by the locator loop without any displacement under the water bag and a geometry approximation that fits to the analysis model. 6.2.6 Assessment of geometry parameters by sonography Under laser alignment control, four ultrasound images are performed at the measurement position. From the sagittal and transversal images the shape of the organ is determined by the three half-axes of an ellipsoid, especially, fitted to the upper contour of the organ (liver, spleen). In case of the spleen, the main axis would be in the longitudinal direction instead of sagittal. Two further images in the diagonal directions are performed and from all four images the mean skinorgan distance ± SD (standard deviation) is determined. Finally, a subcostal image is taken, typically documenting the hepatic tissue appearance contrasting with the kidney tissue. All sonographic positioning work should be recorded on video tape for later inspection in case of doubts about certain parameters. After finalizing sonography, the position is marked instantaneously by an adhesive electrode ring for taking up the locator loop at the measurement position. A preliminary curvature of the thorax is assessed by aid of the novel “thorax radius ruler” tool. Finally, a Polaroid picture is taken from the position spot in comparison to typical body stigmata and the position of the arms at a close Model 5700 Biosusceptometer page 34 of 76 distance (0.6 m). For reproducing this position in further measurements, the position is cartooned by at least one distance to a body mark on the Polaroid picture. Special care has to be undertaken to avoid any change of this position, especially in children! 6.2.7 Positioning of the patient under the biomagnetometer After the positioning and ultrasound procedure, the bed is moved from its sonography position to the measurement position marked again on the floor. After entering the patient information enter the file name to be used for the measurement. DO NOT MOVE THE BED OR WATER BAG DURING THE FILE NAMING. Before reaching this final bed position, the locator loop is fixed on the adhesive electrode ring. The patient is moved upwards by means of the bed’s motor to some mm below the closest distance under the side laser control. In order to enable the measurement without the waterbag system use, do a CNTRL A on this screen. A check indicates that the water bag will not be used. The distance shown on this screen for the locator loop is relative to the coil location. Figure 6-4 Input Screen and Locator Loops The horizontal position is now software controlled by the locator loop on the x-y screen of the biomagnetometer monitor. For the center position, a final readjustment is usually necessary in both horizontal directions (if this is more than ± 1 cm, the patient has changed his position and the positioning procedure may be repeated). For moving the patient to the closest distance under the water bag load later on, it could be practical to keep in mind the respective bed’s z-position given by the position transducer. After informing the patient about the next steps, the bed is raised by 0.5 to 1 cm below the endcap of the dewar and the water bag (ca. 30°C) is inflated with the center of the latex membrane touching the patient first, thereby avoiding any air folds. The bed is moved up again under software control on the central screen of the biomagnetometer monitor until the start position is reached with the following recommended values: locator loop voltage should be slightly below the closest distance equivalent voltage, and water pressure of 8 kg in the exhalation phase. This critical procedure has to be done with the necessary skills in using the 8-way button hand-held controller! The instrument and the patient will suffer from inexperienced personnel! The horizontal measurement position has to be controlled again on the x-y screen. The vertical position is documented in the biomagnetometer logbook by the locator loop voltage in the exhalation phase, and the bed position. In smaller children, it is recommended to start with measurements versus air first. Then use a lower water bag pressure (5-6 kg) and try to increase the pressure slowly from one measurement Model 5700 Biosusceptometer page 35 of 76 run to the other. Runs with water pressure below 6 kg (exhaled state) have to be discarded. Water pressure recommendations have to be revised for the smaller pediatric water bag. 6.2.8 Execution of biomagnetometer measurements by process control and data acquisition with LabWindows CVI program. In the starting position, the x-y position is controlled a final time when passing the “Locator Loop” screen. No displacement (> 0.5 cm) should be tolerated. The software is then switched to the 5-trace screen mode of the “Chart Recorder” display and the pressure trace is observed for inhalation and exhalation oscillations. Figure 6-5 Main Console and Strip Chart Screen (FP Monitor) The patient is asked to breathe in his/her normal manner and to stop breathing in the exhaled phase for 10 seconds. Figure 6-6 Strip Chart Panel Then the measurement is started under processor control. The bed then moves down dynamically by 8 cm with the water bag inflating automatically at a slightly increasing pressure. The data acquisition process takes place with 100 data points in each of the 8 channels. At the end position the water bag deflates automatically. The figure below (Figure 6-7)shows the FP display during the acqusition. The actual data is not shown to avoid timing problems. Model 5700 Biosusceptometer page 36 of 76 Figure 6-7 Measurement timeout The figure below (Figure 6-8) shows the output of the instrument after the acqusition is done. The 3 channels show can be viewed to evaluate if the data was clean. After this screen the output of the locator loop is shown (Figure 6-9). Figure 6-8 SQUID V vs. Z Raw Data Model 5700 Biosusceptometer page 37 of 76 Figure 6-9 Locator Loop Volts vs. Z Data The two 3-trace screens showing the SQUID-voltages and the locator loop voltages vs. the bed position transducer have to be passed through and be inspected carefully for any bumps (trapped magnetic flux from external sources), breathing oscillations and far-field perturbations. Any visible or suspected perturbation has to be documented in the biomagnetometer logbook. Assuming the traces are acceptable, advance to the next screen (Figure 6-10). Figure 6-10 Measurement Results Panel Examine the values generated by the measurement. If they are acceptable, check the box to the left of the measurement. Subsequent measurements will be inserted below the previous one (Figure 6-11). If the measurement just made is unsatisfactory, use the mouse to press the REDO button. This erases the data of the measurement just taken and lets you repeat the measurement. If you want to quit the measurement sequence, press the ABORT button. Now that you are ready to do the next measurement (repeating the previous steps), the motor driven bed is moved up again to the next starting position. The bed position itself is usually slightly higher due to some deformation in the preceding run. The horizontal position has to be controlled again and readjusted if necessary. The total number of measurement runs depend on the precision to be reached, on the quality of runs so far achieved, and on the endurance of the patient. A minimum of 3 runs of good quality vs. the water reference is recommended in routine measurements. Model 5700 Biosusceptometer page 38 of 76 Figure 6-11 Measurement Results Several Panel At the bottom of the measurements results panel is a calculation of the mean of the measurement runs. Only those runs (N1, N2, etc.) that are checked will be calculated. For precision measurements, sufficient time should be taken to position a patient ideally with no compromise to x-y displacement, and 5 measurements vs. water reference as well as 2 vs. air should be performed. There are different ways to regulate the patient’s breathing rhythm. This can be done with clear short commands or just observing the rhythm on the screen and stopping further breathing on command. In some patients the best liver position may be also in the inhalation phase. In some small children, the measurements have to be done without any breathing regulations. Breathing is of critical impact on the quality of the measurement and the iron quantitation. If there is any doubt about the influence of the lungs on the measurement, a control run with maximum lung contribution (inhaled) has to be performed. Measurements in small children: In small children the whole procedure of positioning, ultrasound and measurement has to be speeded up. The computer dialogue (patient information) has to be carried out in advance with estimated sonographic data. Only two ultrasound images (sagittal, transversal) should be taken. “Air runs” may be performed at first, in order to get the children used to the whole procedure and maybe to analyze these data vs. air reference later on. The water bag load should be increased slowly from run to run (from 4 - 6 kg to 7 - 8 kg). No attempt may be undertaken to hold the breath (continuous fast breathing will also do some smoothing on the response curves). An analysis with real patient information data has to be performed after the measurement. Model 5700 Biosusceptometer page 39 of 76 6.2.9 Determination of the effective thorax geometry by biomagnetometer measurements The difference of magnetic volume susceptibilities of water and air is well known, ∆χwater-air = 9.396·10-6 SI. The difference of SQUID voltages of an object measured vs. a water and air reference depends then only from its unknown geometry at the borderline between water coupling membrane and thorax surface. Thus, performing additional runs (at least one) vs. air would result in the calculation of an effective radius for the assumed simple spherical geometry of the anterior thorax shape. This calculation is straight-forward: the SQUID voltages from air measurements are fitted by 3rd order polynomials vs. distance, a polynomial made up from mean coefficients is subtracted from the SQUID voltages from water bag measurements, and the radius of an assumed hemispherical or cylindrical thorax geometry is variated for minimum chi-square (χ2) deviation from the known susceptibility difference ∆χwater-air (see above). This effective radius would count for any deviation from the ideal spherical geometry and also for problems in positioning a patient in a proper horizontal way. In small children, these “air runs” may be performed at first, in order to get the children used to the whole procedure. 6.3 Data Storage, organ volume estimation, and on-line analysis 6.3.1 Finalization of the measurement The data of the measurement runs will be stored finally on software command. The filename is typically made up by the first 3 characters of the last and the first 3 characters of the first name, patient -Id-no 5 digits, number of visit 3 digits and an extension for the organ 3 characters, e.g. Fagrob00299001.liv. Duplicate filenames will not be allowed by the system’s software check. Thereafter, the online analysis is performed after selecting suitable runs and is printed (2 times) for the clinician’s usage and for the documentation at the biosusceptometer facility. When the measurement is finished, the patient sits up. After a rest of 10 - 20 seconds sitting upright on the bed, the patient could be asked to dress again, if not continuing with sonographic organ volume estimation. It is good practice to inform the patient about the outcome of the online analysis directly in front of the biomagnetometer, although some caution may be used for psychologically sensitive patients. 6.3.2 Volume estimation by sonography (Ultrasound) Liver and spleen volumes can be measured by a sonographic scan technique under laser alignment control of the ultrasound linear probe. It is recommended to do this after obtaining the most important information on organ iron concentration. The liver is scanned by sagittal sections (the spleen by transversal sections) at a gap distance of 2 cm. For large organs, two images have to be combined with special attention of the overlay zone. It is recommended to start the scanning near the medio-clavicolar line. Special care should be devoted to a vertical position of the probe. Every image be “frozen” and written into the imager’s sine loop. The total procedure is documented in the volume estimation protocol and has to be recorded on video tape with documentation of video tape no., start address, and end address for later analysis work. Model 5700 Biosusceptometer page 40 of 76 6.3.3 On-line analysis The online analysis is performed in the 1st approximation model of biosusceptometry. The magnetic susceptibility of the overlying thorax tissue is calculated from the body mass index and a preliminary thorax geometry is assumed from the torso curvature mapping. A refinement of this model resulting in an effective thorax geometry will be established by exploiting the measurements vs. the air reference. After subtraction of the thorax contribution, the liver or spleen iron concentration is calculated from linear regression fits, independently, in all three detector channels. The mean iron concentration value is calculated from all selected runs in all independent detector channels. These online values can be evaluated as final ones if the following conditions are fulfilled: • quality of measurements is good, i.e. no contributions from magnetic contaminants, no breathing effects, no trapped flux (look for χ2-A, χ2-B, χ2-C ), • if you feel safe with the estimation of the magnetic susceptibility of the thorax tissue (look for χ2-tis), which may be the case for BMI < 25 kg/m² and percentage of total body fat as expected, • the deviation between the detector channels is less than 5 % for iron concentrations >700 µg/g (look for the ratio A/B and A/C in appendix 21.). In all other cases, a final, second order analysis (§6) has to be performed, especially, for cFe < 700 µg/g, BMI > 25 kg/m² corresponding with δχtissue > 0.2, far-field contributions, and in most spleens (lung influence!). After the data analysis is done the data is printed via the PRINT button (in Figure 6-11). The result is shown in Figure 6-12. ----------------------------------------------------------------------------------------------------------------------------------------------------------------------------Tristan Technologies Model 5700 BIOSUSCEPTOMETER Children's Hospital Oakland Department of Hematology/Oncology 747 52nd Street Oakland, CA 94609 TEL 510-428-3058 FAX 510-450-5813 Estimate of Fe by SQUID Biomagnetic Liver (Spleen) Susceptometry For: First Name Last Name Tue Feb 05 20:08:03 2002 DOB: 10/10/2000 File: c:\Patient Data\lkasjdklaj.liv Organ Type: LIVER Weight[kg] = 50.0 Height[cm] = 170.0 BMI[kg/m^2] = 0.000 System Background : LOCATOR_LOOP_AND_H2O_BAG_VS_H2O ORGAN Geometry : HEMISPHERE Z-organ[cm] = 1.00 +/- dz(0.03 ORGAN Dimensions : HEMISPHERE radius[cm] = 12.0 THORAX Geometry : HORIZONTAL CYLINDER THORAX Dimensions : HORIZONTAL CYLINDER radius[cm] = 12.0 Run No. H2O Pressure LIC-A LIC-B LIC-C [ug/g-org] [ug/g-org] [ug/g-org] [kg] Model 5700 Biosusceptometer page 41 of 76 ) Distance by : LL THORAX dX-tis[10^-6] = X^2-A X^2-B 0.000 X^2-C _______________________________________________________________________________________________________________ _ 1 LIV -3173 +/- 788 -16048 +/- 2783 992 +/- 209 0.0 0.0 0.0 0.3 --------------------------------------------------------------------------------------------------------------Mean of Runs : SQUID A ug[Fe]/g-organ SQUID B ug[Fe]/g-organ SQUID C ug[Fe]/g-organ 0 +/- 0 0 +/- 0 0 +/- 0 ug[Fe]/g-organ Total Mean and Error 0 +/- 0 ---------------------------------------------------------------------------------------------------------------------------------------------------------------------- Figure 6-12 Subject Analysis Printout 7 Final analysis The final analysis will be done on the second (data analysis) computer under the Hamburg HP Basic routines. 7.1 Simultaneous determination of iron concentration and tissue susceptibility. An effective thorax geometry estimation has to be performed first. Under ideal positioning conditions, this is some kind of internal quality control, i. e. the estimated effective cylindrical or hemispherical radius should be similar to the preliminary curvature of the thorax as assessed by aid of the “thorax radius ruler”. In a 2nd approximation model, the liver iron concentration and the magnetic thorax susceptibility are calculated by a multiple regression fit procedure. • In a 1st step, a simultaneous fit of liver iron concentration cFe and magnetic thorax tissue susceptibility χtissue could be performed in all detector channels A, B and C, independently. • Derive a reasonable mean χtissue from detector B only (most sensitive to near-field tissue!) in the 1st step, otherwise take the BMI derived χtissue from the online analysis, and fit for cFe and error terms εfar (far-field contributions and/or model deviations) in all detector channels A, B and C, independently. • In a 3rd step, take the mean error terms from step 2 and fit for cFeA = cFeC, but χtisA ≠ χtisC. If this fails, repeat step 2, but with fixed χtissueA = χtissueB = χtissueC. This results in a final iron concentration value with an estimation of the standard deviation from the variation seen in steps 1 - 3 with respect to systematic errors mainly from the assessment of the magnetic thorax tissue contribution. In the case of final analysis for spleens, χtissue is derived from biosusceptometry of the liver, and the spleen iron concentration is fitted as in step 3, however, with εfarA ≠ εfarC. 7.2 Precision of SQUID biosusceptometry The absolute error of the organ iron concentration results from the systematic imprecision of: 1. the skin-liver distance determination by sonography (mean error: ∆z = 0.5 mm), 2. the erroneous knowledge or estimation (if determined simultaneously from the measurement itself) of the magnetic thorax tissue susceptibility (mean error: ∆χ = 0.05 ·10-6 SI), and 3. the standard deviation SD-statistics from repeated measurements. Model 5700 Biosusceptometer page 42 of 76 The relative error in repeated measurements in the same patient will be lower due to smaller systematic errors (about ∆z/2, ∆χ−>0) if the measurement position can be reproduced and the subject gained no weight. Analyzing various patient measurements, total errors (SD-total) between 100 and 400 µg/g were calculated from the squared sum of the 3 main contributions: SD²-total [µg/g] = SD²(∆z, CFe) + SD²(∆χ) + SD²-stat eq. 5.1 Error functions for the systematic imprecisions ∆z and ∆χ have been parameterized with liver iron concentrations in the range of 100 - 12000 µg/g and differential tissue susceptibilities between −0.2 ·10-6 SI and +0.5 ·10-6 SI. The first contribution SD²(∆z, cFe) scales linearly by 3.5% with the liver iron concentration. The second term is a parabolic function of the magnetic thorax tissue susceptibility ∆χ with an error minimum of SD(∆χ) = 100 µg/g at ∆χ = 0 SI and SD(∆χ) = 400 µg/g at ∆χ =0.5 ·10-6 SI. A 4-dimensional functional relationship SD (z, ∆χ, CFe) may prove to be beneficial. 7.3 Total body iron stores and other related calculations After estimation of liver and spleen volumes (V) from analysis of the video tapes, total body iron stores UFe can be calculated according to UFe = (cFeliver · Vliver + cFespleen · Vspleen) / 0.8 eq. 5.2 Further meaningful parameters such as total body iron elimination rates and rate constants, chelation therapy efficacy can only be calculated and compared if the mentioned clinical data on the transfusion and chelation therapy regimen of each patient is available with sufficient precision. For comparison, in-vivo liver iron concentrations by SQUID biomagnetic liver susceptometry are given in [µg/gliver] in contrast to in-vitro LIC from biopsies in [µg/gwet weight] or in [µg/gdry weight]. One may calculate 3.5 µg/gdry weight ≈ 1 µg/gwet weight; by current experience with biopsies from thalassemics, the theoretical factor of 3.5 is justified.. 8 System Software 8.1 Introduction: Biosusceptometer Software Functionality and Flow Control The model 5700 Biosusceptometer system control, data acquisition and analysis software is written in National Instruments LabWindows CVI development environment. CVI is interactive graphical user interface development environment based on the C programming language (for more information go to the National Instruments CVI manuals, or www.natinst.com). The biosusceptometer software functionality and flow control is sketched below (Figure 8-1): When the program is started the software first reads the input files – System Parameters and Machine parameters, containing all of the system calibration parameters and the values for the hardware (the input file structure is described in details in Section 6. Second, it initializes the hardware to the required values (sets gains and filters on the SQUID controller, starts the water bag controller, sets the sine wave on the HP waveform generator, etc.). Third the user interface is started. the Main Biosusceptometer Panel is loaded when the program is first started. All the following software and system events are initiated from the user interface or by using the handheld controller (handheld controller allows to move bed up and down, water bag up and down, to advance between the software panels, to start and stop the data acquisition, to reset SQUID sensors). Model 5700 Biosusceptometer page 43 of 76 from the Main Panel the user can initiate patient measurement. The patient measurement routine is described in the §5. Sequentially, panels prompt the user to fill patient information, to position the patient using the locator loop, start the data acquisition (including start bed drop, start water bag pressure regulation, start data acquisition, and after 10 or 16 second (for the calibration runs) stop data acquisition, stop water bag, stop bed). The calibration is conducted on G20. Obtained SQUID output and Locator Loop signals are plotted vs. Position Transducer signal. On-line calculation is performed and the results are presented on the Final panel. From the Final panel the user can CONTINUE (save just acquired data to the Patient File and advance to the Locator Loop Positioning panel), REDO (discard just acquired data to the Patient File and advance to the Locator Loop Positioning panel), ABORT (discard acquired data and advance to the Main Panel), PRINT (save the just acquired data to the Patient File, print the On-line Report and advance to the Main Panel). The Main Panel contains the Menu Bars (described in the sections below), allowing the user to access routines for various hardware tests, liquid helium transfer, Data Manipulation (including Locator Loop and Background Susceptibility calibration), SQUID signal acquiring vs. time (designed to acquire signals over extended periods of time up to 24 hours) and System Help. Wake up HW Initialize Load Files Config Machine Function SW Diagram Caliibrati on Main Panel QUIT HH Controller Bed Speed Full/Half Patient Info LL Postioning Chart Recorder Start data acq Main data Acq SQUID vs Pos Plot LL vs Pos Plot Bed Up/ Down On-line calc Final data screen Cont Next/ Back Redo Print Print Report Abort Data File write Start/ Stop Measurement Measure P Start Bed ramp Start P control motor Start Acq Acq for 10(var) sec Stop Acquyisition Stop P control Stop bed etc (detect water bag off or bed off) Water bag Up/Down SQUID Reset Menu Bar Data Manipulation HW test V vs t HHC Bed Test Squid G Time Plot SQUID Chart Run LL He level measure Prompt meter on wait for end Calc refill time Calibrate locator loop Export Data Backgnd Subtract Calib Figure 8-1 Software Schematic 8.2 Software File Structure All input and output files are ASCII files. The model 5700 Biosusceptometer system is delivered with the input files, containing the factory calibration parameters and hardware setting values. Model 5700 Biosusceptometer page 44 of 76 The user is required to recalibrate the system on-site, charge the magnet, set appropriate hardware values, and then manually edit the input files (using a text editor like NotePad) and save files with appropriate names (MACHPARyy.asc and SYSPARmmyy.asc). Place the newly created file names in the SYSDAT_FF.asc file. Never change the format of the input files! It will result in system errors! On software wake up, the SYSDAT_FF.asc file is read, and the stored file names are used as Machine and System parameter files. In addition, the SYSDAT_FF.asc file contains information on the liquid helium level. Presented below are examples of required input files, and an example of the output file. The output file header consists of patient information, machine and system parameters. Measurements for one patient measurements run (and the Patient file correspondingly) can have up to 20 runs, each run consists of 100 or 160 point (for a calibration run). The calibration was conducted on G20. The following data are saved in the Patient file (17 fields): run number, SQUID A voltage output, SQUID B, SQUID C, Locator Loop voltage based on SQUID A, LL based on SQUID B, LL based on SQUID C, Position Transducer voltage, Water Presser voltage, standard deviation for SQUID A voltage readings, for SQUID B voltage readings, for SQUID C voltage readings, Fluxgate voltage reading in the X direction, in the Y direction, in the Z direction, Cardiac signal, Free channel for user defined input. The data is delimited via "spaces" and an input into Excel can be done if the space delimiter option is used. Figure 8-2 SYSDAT_FF.asc SYSDAT_FF.asc OAKLAND_SITE MACHPAR00_O.asc SYSPAR0800_O.asc Sat Jul 10 21:56:36 1999 HeLevelInfoFile.bin He Level is 68.000000 % on Mon Jan 10 14:56:09 2000 Figure 8-3 MACHPARyy.asc MACHPAR00_O.asc Z_ZERO 3.300 3.300 3.30 ; closest distance [cm] HeBoilOff 6.0 ; Helium boil-off in liters per day Prslp 1.653 ; pressure transducer coefficient [kg/V] Iprs 0.269 ; pressure intercept [kg] Vslp 3.03 ; position transducer coefficient [cm/V] Motvalu -5.0 ; Maximum voltage for the bed motor [V] Motv_spd 4.0 ; bed ramp speed time [sec] MotHighSpeedVolts 3.0 ; High speed volts for bed control MotLowSpeedVolts 2.0 ; Low speed volts for bed control Z_LL_VOLT 0.4 ; Z locator loop source voltage [V] Z_LL_FREQ 330 ; Z locator loop frequency [Hz] Z_LL_Resistor 50.00 ; to measure voltage accross [Ohm] D1_LL_VOLT 5.0 ; D1 locator loop source voltage [V] D1_LL_FREQ 200 ; for 60 Hz power line, D1 locator loop frequency [Hz], 240 Hz - for 50 Hz power line Model 5700 Biosusceptometer page 45 of 76 D2_LL_VOLT 5.0 ; D2 locator loop source voltage [V] D2_LL_FREQ 250 ; for 60 Hz power line, D2 locator loop frequency [Hz], 280 Hz - for 50 Hz power line Constmag_A 0.383 ; sensitivity constant SQUID A (=B-25) [V/mT²/cm³] Constmag_B 2.0142 ; sensitivity constant SQUID B (=Pln-2) [V/mT²/cm³] Constmag_C 2.6922 ; sensitivity constant SQUID C (=A-10) [V/mT²/cm³] Norconst_A 1.0 ; normalization constant SQUID A [SI-unit/V] Norconst_B 1.0 ; normalization constant SQUID B [SI-unit/V] Norconst_C 1.0 ; normalization constant SQUID C [SI-unit/V] Range_A 20 ; default SQUID A gain Range_B 50 ; default SQUID B gain Range_C 50 ; default SQUID C gain Multiply_500_A 0.040 ; multiplier for channel A gain 500 Multiply_500_B 0.100 ; multiplier for channel B gain 500 Multiply_500_C 0.100 ; multiplier for channel C gain 500 Multiply_200_A 0.100 ; multiplier for channel A gain 200 Multiply_200_B 0.250 ; multiplier for channel B gain 200 Multiply_200_C 0.250 ; multiplier for channel C gain 200 Multiply_100_A 0.200 ; multiplier for channel A gain 100 Multiply_100_B 0.500 ; multiplier for channel B gain 100 Multiply_100_C 0.500 ; multiplier for channel C gain 100 Multiply_50_A 0.400 ; multiplier for channel A gain 50 Multiply_50_B 1.000 ; multiplier for channel B gain 50 Multiply_50_C 1.000 ; multiplier for channel C gain 50 Multiply_20_A 1.000 ; multiplier for channel A gain 20 Multiply_20_B 2.500 ; multiplier for channel B gain 20 Multiply_20_C 2.500 ; multiplier for channel C gain 20 Multiply_10_A 2.000 ; multiplier for channel A gain 10 Multiply_10_B 5.000 ; multiplier for channel B gain 10 Multiply_10_C 5.000 ; multiplier for channel C gain 10 Multiply_5_A 4.0000 ; multiplier for channel A gain 5 Multiply_5_B 10.000 ; multiplier for channel B gain 5 Multiply_5_C 10.000 ; multiplier for channel C gain 5 Multiply_2_A 10.000 ; multiplier for channel A gain 2 Multiply_2_B 25.000 ; multiplier for channel B gain 2 Multiply_2_C 25.000 ; multiplier for channel C gain 2 Multiply_1_A 20.000 ; multiplier for channel A gain 1 Multiply_1_B 50.000 ; multiplier for channel B gain 1 Multiply_1_C 50.000 ; multiplier for channel C gain 1 Nrun 10 ; default number of runs Ndatpts 100 ; default number of data points per run Nchan 16 ; default number of data channels LinRegressionMode 2 ; 0 = std dev weighting, 1 = statistical weighting, 2 = no weighting WBC_version 2 ; WBC program version frmp1 10.0 ; Torino WBC profile parameter srmp1 28.0 ; Torino WBC profile parameter sval1 3.4 ; Torino WBC profile parameter srmp2 1.6 ; Torino WBC profile parameter BSF_LC_Freq 55.0 ; SQUID & FluxGate chan data Band Stop Filter Lower Cutoff Frequency BSF_UC_Freq 65.0 ; SQUID & FluxGate chan data Band Stop Filter Upper Cutoff Frequency Model 5700 Biosusceptometer page 46 of 76 BSF_Center_Freq 60.0 ; SQUID & FluxGate chan data Band Stop Filter Center Frequency LockInType 0 ; 0 = S/W Lock-In, 1 = H/W Lock-In WaterBagModel 1 ; 0 = Torino, 1 = Oakland WBCFirmwareVer 2.021 ; WBC Firmware Version to run WBCtimeintval1 4.0 ; Oakland WBC Time interval of bed ramp in seconds WBCvalvevalue1 0.2 ; Oakland WBC Change of valve amplitude in Timeintval1 in volts WBCtimetotal 10.0 ; Oakland WBC Total measurement time in seconds WBCvalvevalue2 0.1 ; Oakland WBC Change of valve amplitude in Timeintval2 in volts WBCvalvestart 0.63 ; Oakland WBC Valve amplitude at start in volts WBCvalverest 1.26 ; Oakland WBC Valve amplitude at rest in volts WBCKp 0.02 ; Oakland WBC Proportional factor of Pcontrolling in Volts/kg WBCKi 0.0005 ; Oakland WBC Integral factor of Icontrolling "10ms controlling loop" in Volts/kg WBCstoptime 2.0 ; Oakland WBC Time interval for opening the digital valve after stop in seconds WBCPrslp 2.876 ; Oakland WBC Pressure transducer coefficient in kg/Volts WBClprs -3.087 ; Oakland WBC Pressure intercept [kg] in kg IMAGCOMPort 5 ; IMAG_SERIAL_PORT @ COM5 HPWaveformCOMPort 2 ; HP_WAVEFORM_SERIAL_PORT @ COM2 WaterBagCOMPort 6 ; WATER_BAG_SERIAL_PORT @ COM6 free ; defaults ; defaults Figure 8-4 SYSPARmmyy.asc SYSPAR00_O.asc SYS_DATE Tue Aug 22 12:24:13 2000 ; CPU-time *** parameters at col. 25 *** MAG_CUR 10.000 ; Magnet current, A POLYNOMIAL_LL 6 ; 6-polynomial, or Sendai Function (5) Z_LL_COEF_A 2.604440 -3.778031 1.371500 2.256156 2.418397 0.712313 0.000000 ;Distance by LL, SQUID A Z_LL_COEF_B 3.082823 -1.886074 -0.083270 -0.755184 -0.091974 0.041789 0.000000 ;Distance by LL, SQUID B Z_LL_COEF_C 3.314145 -2.955371 0.368186 0.419535 1.279638 0.479962 0.000000 ;Distance by LL, SQUID C LL_CURRENT 7.068 ; mA, LL current during calibration SQ_A_RANGE_LL 20 ; SQUID A gain SQ_B_RANGE_LL 50 ; SQUID B gain SQ_C_RANGE_LL 50 ; SQUID C gain MIN_DIST_LL 1.8000 ; minimum distance for LL [cm] Model 5700 Biosusceptometer page 47 of 76 MAX_DIST_LL 16.000 ; maximum distance for LL POLYNOMIAL_LL_WTRB 5 ; 5-th order polynome (1/z) LL_WTRBAG_WATER_A 0.000000 1.63297 -13.43863 55.01294 -107.78158 81.43093 ;LL - water bag backgrnd vs water, SQ A(1/z) LL_WTRBAG_WATER_B 0.000000 0.23858 -0.98948 1.56687 0.000000 0.000000 ;LL - water bag backgrnd vs water, SQ B LL_WTRBAG_WATER_C 0.000000 -0.33478 1.28797 -0.93717 0.000000 0.000000 ;LL - water bag backgrnd vs water, SQ C SQ_A_RANGE_LL_WTRB 20 ; SQUID A gain SQ_B_RANGE_LL_WTRB 50 ; SQUID B gain SQ_C_RANGE_LL_WTRB 50 ; SQUID C gain MIN_DIST_LL_WTRB 1.8000 ; minimum distance for LL [cm] MAX_DIST_LL_WTRB 11.000 ; maximum distance for LL POLYNOMIAL_WTRB 5 ; 5-th order polynome (1/z) WTRBAG_WATER_A 0.000000 0.33634 -4.96308 28.75376 -68.74368 58.21238 ;Water bag background vs water, SQ A WTRBAG_WATER_B 0.000000 0.33634 -4.96308 28.75376 -68.74368 58.21238 ;Water bag background vs water, SQ B WTRBAG_WATER_C 0.000000 0.33634 -4.96308 28.75376 -68.74368 58.21238 ;Water bag background vs water, SQ C SQ_A_RANGE_WTRB 20 ; SQUID A gain SQ_B_RANGE_WTRB 50 ; SQUID B gain SQ_C_RANGE_WTRB 50 ; SQUID C gain MIN_DIST_WTRB 1.8000 ; minimum distance [cm] MAX_DIST_WTRB 11.000 ; maximum distance POLYNOMIAL_LL_AIR 3 ; 3-rd order polynome (1/z) LL_AIR_A 0.000000 0.194607 -0.662947 0.380440 0.000000 0.000000 0.000000 ;Locator loop background vs air, SQ A LL_AIR_B 0.000000 -0.013713 0.609183 -1.331730 0.000000 0.000000 0.000000 ;Locator loop background vs air, SQ B LL_AIR_C 0.000000 -0.046126 0.374707 -1.123400 0.000000 0.000000 0.000000 ;Locator loop background vs air, SQ C SQ_A_RANGE_LL_AIR 20 ; SQUID A gain SQ_B_RANGE_LL_AIR 50 ; SQUID B gain SQ_C_RANGE_LL_AIR 50 ; SQUID C gain MIN_DIST_LL_AIR 1.8000 ; minimum distance for LL [cm] MAX_DIST_LL_AIR 17.0000 ; maximum distance for LL AX 0.0 ; Fluxgate X coefficient for SQUID A AY 0.0 ; Fluxgate Y coefficient for SQUID A AZ 0.0 ; Fluxgate Z coefficient for SQUID A BX 0.0 ; Fluxgate X coefficient for SQUID B BY 0.0 ; Fluxgate Y coefficient for SQUID B BZ 0.0 ; Fluxgate Z coefficient for SQUID B CX 0.0 ; Fluxgate X coefficient for SQUID C CY 0.0 ; Fluxgate Y coefficient for SQUID C CZ 0.0 ; Fluxgate Z coefficient for SQUID C Figure 8-5 Sample Data File Sample data file: DateTime Last Name First Name Thu Dec 16 16:48:02 1999 Bed G20 drop Model 5700 Biosusceptometer ; $ CPU Date ; $ ; $ page 48 of 76 Visit Number Date of Birth Sex Patient ID Weight Height TBF Comuthal ID Nrun Ndatapts Nchan MACHPARyy SYSPARmmyy FREE RangeA RangeB RangeC Distsel Zclose Ptvclose LLcur FREE Organ Orgdist Orgerr Orgg Ael(or Rorg) Bel Cel Torg Tael(or Rtor) Tbel Tcel Dchitor D1 D2 FREE FREE FREE FREE FREE FREE FREE FREE FREE FREE FREE RUN SQA 0 0.380339 0 0.543428 0 0.551765 0 0.551564 0 0.551337 0 0.551771 0 0.551564 0 0.551589 0 0.551448 0 0.551496 0 0.551854 0 0.551806 0 0.551500 0 0.551815 0 0.552108 0 0.553884 0 0.557029 0 0.552282 0 0.551768 0 0.551541 0 0.551781 0 0.552162 0 0.551743 0 0.551346 0 0.551464 0 0.551417 0 0.551649 0 0.551796 0 0.551410 0 0.551485 0 0.552914 0 0.552186 0 0.550431 1 10/10/2000 MALE 1 0.000 0.000 ; $ 2 16 MACHPARyy.asc SYSPARmmyy.asc ; ; ; ; ; $ $ $ $ $ Number of actual runs <= 10 100 16 Machine Parameters file name System Parameters file name 4 4 4 PT 0.000 4.888 0.002 ; ; ; ; ; ; ; $ $ $ $ $ $ $ LL or PT(position transducer) or TM(time) Closest distance for PT Equivalent PT voltage[V] LL(z) source current at start LIVER 0.000 0.000 HEMISPHERE 12.000 ; ; ; ; ; ; ; ; ; ; ; ; ; ; $ $ $ $ $ $ $ $ $ HEMISPHERE 12.000 0.001 0.001 SQB SQC LLA 0.503267 0.054701 6.385418 0.090732 9.801740 0.112288 9.991140 0.116153 9.999325 0.116152 9.999679 0.119656 9.999694 0.118808 9.999695 0.116523 9.999695 0.119715 9.999695 0.120235 9.999695 0.121603 9.999695 0.122410 9.999695 0.123458 9.999695 0.124171 9.999695 0.124897 9.999695 0.125401 9.999695 0.126529 9.999695 0.126317 9.999695 0.126467 9.999695 0.127188 9.999695 0.127836 9.999695 0.128054 9.999695 0.129043 9.999695 0.129024 9.999695 0.129178 9.999695 0.129138 9.999695 0.129328 9.999695 0.129441 9.999695 0.129680 9.999695 0.129324 9.999695 0.129847 9.999695 0.129452 9.999695 0.129494 LLB 0.000979 0.001170 0.001047 0.001211 0.001109 0.001048 0.000860 0.001108 0.001704 0.001168 0.001272 0.002254 0.000135 0.000922 0.001212 0.001156 0.001147 0.001122 0.001243 0.001080 0.001256 0.001173 0.001046 0.001122 0.001168 0.001080 0.001233 0.001052 0.001013 0.001082 0.001157 0.001150 0.001169 LLC POS PRESS DSQA 0.081413 0.000306 4.884991 0.110657 0.000398 4.891333 0.020324 0.000271 4.900653 0.020324 0.000162 4.910071 0.020324 0.000288 4.920519 0.020324 0.000114 4.933038 0.020324 0.000152 4.947700 0.020324 0.000210 4.964764 0.020324 0.001125 4.981929 0.020324 0.000368 4.999636 0.020324 0.000795 5.019021 0.020324 0.001858 5.040915 0.020324 0.000634 5.064784 0.020324 0.000573 5.091005 0.020324 0.000235 5.116991 0.020324 0.000311 5.144237 0.020324 0.000346 5.173392 0.020324 0.000333 5.205118 0.020324 0.000019 5.238046 0.020324 0.000332 5.272636 0.020324 0.000289 5.307847 0.020324 0.000138 5.345125 0.020324 0.000334 5.384189 0.020324 0.000207 5.423605 0.020324 0.000407 5.463116 0.020324 0.000521 5.502920 0.020324 0.000463 5.542107 0.020324 0.000339 5.581644 0.020324 0.000428 5.622316 0.020324 0.000434 5.663125 0.020324 0.000348 5.702999 0.020324 0.000324 5.741829 0.020324 0.000158 5.780705 Model 5700 Biosusceptometer ; $ ; $ ; Total body fat(or im[edance) or 0 Organ(liver,spleen, heart, ...) Skin-organ distance [mm] Skin-organ distance error [mm] Organ geometry (1-13) Organ ellipsoid axis a (or spherical Radius) Organ ellipsoid axis b [cm] Organ ellipsoid axis c [cm] Thorax geometry (1-13) Thorax ellipsoid axis a (or spherical Radius) Thorax ellipsoid axis b [cm] Thorax ellipsoid axis c [cm] $ Online chi-thorax difference to water D1 coil signal reading at start of measurements D2 coil signal reading at start of measurements DSQB 0.082409 0.104030 0.114203 0.113130 0.112992 0.113685 0.114343 0.115015 0.115933 0.116140 0.116722 0.117939 0.119514 0.120933 0.120651 0.120787 0.121650 0.121890 0.122876 0.123206 0.123092 0.123357 0.124364 0.124880 0.125218 0.125443 0.125213 0.124680 0.124668 0.125676 0.126331 0.125278 0.124544 DSQC FLX-X FLX-Y FLX-Z 0.140740 0.562063 0.020665 0.007376 2.319692 0.006995 0.000136 0.167116 0.004922 0.000068 0.007222 0.001055 0.000038 0.000312 0.000847 0.000171 0.000013 0.000823 0.000243 0.000001 0.001083 0.000147 0.000000 0.000508 0.000166 0.000000 0.000773 0.000187 0.000000 0.000262 0.000039 0.000000 0.000288 0.000052 0.000001 0.000371 0.000101 0.000001 0.000104 0.000180 0.000001 0.000433 0.000074 0.000001 0.000097 0.002132 0.000001 0.000399 0.002013 0.000001 0.000145 0.000248 0.000001 0.000044 0.000320 0.000001 0.000079 0.000207 0.000001 0.000320 0.000124 0.000001 0.000092 0.000170 0.000001 0.000198 0.000282 0.000001 0.000274 0.000045 0.000001 0.000099 0.000090 0.000001 0.000111 0.000105 0.000001 0.000028 0.000235 0.000001 0.000040 0.000120 0.000001 0.000122 0.000064 0.000001 0.000090 0.000045 0.000001 0.000079 0.000979 0.000001 0.000135 0.001374 0.000001 0.000107 0.000664 0.000001 0.000186 page 49 of 76 CARD FREE 4.871118 4.855266 4.891339 4.891994 4.900467 4.900946 4.910590 4.910422 4.922241 4.921841 4.935118 4.935260 4.948296 4.948972 4.963867 4.964500 4.981789 4.981806 5.000702 5.000318 5.021095 5.020857 5.041920 5.042297 5.064328 5.065027 5.090606 5.090982 5.117168 5.116928 5.145900 5.145404 5.175080 5.174944 5.205660 5.206162 5.237832 5.238390 5.272934 5.272865 5.309181 5.308659 5.346807 5.346462 5.385043 5.385374 5.423959 5.424521 5.463112 5.463263 5.503286 5.502918 5.543522 5.543012 5.583137 5.583137 5.623306 5.623804 5.662839 5.663345 5.702930 5.702896 5.743085 5.742574 5.782949 5.782632 4.852904 4.889453 4.898636 4.908471 4.920274 4.933546 4.946782 4.962061 4.979573 4.998615 5.019292 5.040277 5.062523 5.088516 5.114973 5.143777 5.173130 5.203833 5.235834 5.270586 5.306795 5.344726 5.383284 5.421988 5.460725 5.500757 5.541232 5.581245 5.621435 5.660698 5.700475 5.740589 5.780897 4.840394 4.885103 4.891912 4.905562 4.922079 4.936298 4.944760 4.956536 4.975569 4.997703 5.021302 5.040589 5.058747 5.083230 5.111282 5.144817 5.174785 5.201247 5.229971 5.264435 5.305323 5.346285 5.383141 5.417802 5.453154 5.496096 5.541619 5.582582 5.618928 5.653454 5.694734 5.740078 5.782592 1.265223 1.218138 1.166362 1.139603 1.200010 1.257588 1.252045 1.198059 1.158184 1.198077 1.257374 1.280076 1.253299 1.205928 1.210891 1.258503 1.308618 1.319240 1.268956 1.238345 1.270702 1.342430 1.390174 1.335821 1.285032 1.308237 1.366582 1.428537 1.407894 1.366810 1.357899 1.377713 1.448060 0 0 0 0 0 0 0 0 0 0 0 0 0 0 0 0 0 0 0 0 0 0 0 0 0 0 0 0 0 0 0 0 0 0 0 0 0 0 0 0 0 0 0 0 0 0 0 0 0 0 0 0 0 0 0 0 0 0 0 0 0 0 0 0 0 0 0 1 1 1 1 1 1 1 1 1 1 1 1 1 1 1 1 1 1 1 1 1 1 1 1 1 1 1 1 1 1 1 1 1 1 1 1 1 1 1 1 1 1 1 1 1 1 1 0.518260 9.897917 0.114473 0.006075 0.077670 0.001946 5.820528 0.096883 0.043878 0.251223 0.017602 5.821642 5.821760 5.819615 5.818461 1.464133 0.178669 3.411696 -0.008370 0.002796 0.145836 0.000994 5.860789 -0.042181 0.102486 2.961867 0.038876 5.859834 5.859769 5.856767 5.850897 1.408095 0.750284 -0.449481 0.029970 0.022240 0.040666 0.003491 5.902038 0.083156 0.365147 0.388909 0.050263 5.900839 5.900590 5.897581 5.891633 1.399630 1.407732 0.327250 0.124617 0.005134 0.008674 0.000775 5.941212 0.130224 0.030944 0.067004 0.004755 5.941341 5.940504 5.937939 5.935514 1.401325 1.343250 0.251466 0.114558 0.002703 0.007354 0.000244 5.980980 0.116541 0.008179 0.070226 0.001275 5.981863 5.980896 5.978792 5.978878 1.458525 1.367118 0.567683 0.118202 0.002759 0.006852 0.000506 6.020780 0.121215 0.002927 0.096083 0.000552 6.021306 6.020777 6.018464 6.019607 1.521226 1.361147 0.983367 0.118598 0.002659 0.011399 0.000363 6.061339 0.121588 0.001112 0.149771 0.000211 6.060893 6.060967 6.058099 6.056139 1.520175 1.362810 1.548771 0.119548 0.002759 0.011232 0.000223 6.101514 0.123971 0.000429 0.166422 0.000403 6.100449 6.100496 6.097470 6.091834 1.467695 1.362937 2.097836 0.120948 0.002878 0.011228 0.000234 6.140472 0.124887 0.000172 0.153509 0.000264 6.140298 6.139840 6.137085 6.132016 1.435638 1.363605 2.612285 0.121751 0.002695 0.010515 0.000338 6.180107 0.125558 0.000114 0.139906 0.000280 6.180420 6.179458 6.177225 6.175756 1.481060 1.363911 3.056705 0.122688 0.002806 0.010251 0.000294 6.218615 0.126997 0.000111 0.119273 0.000228 6.219619 6.218855 6.216673 6.219473 1.548968 1.365104 3.454910 0.123704 0.002946 0.010434 0.000307 6.258239 0.127561 0.000782 0.113426 0.000407 6.258722 6.258668 6.256107 6.256406 1.577217 1.364674 3.838541 0.124435 0.002723 0.010724 0.000363 6.299118 0.128223 0.001072 0.105909 0.000032 6.298230 6.298544 6.295583 6.290369 1.548485 1.363294 4.200272 0.124903 0.002791 0.011023 0.000326 6.339152 0.129908 0.000594 0.102053 0.000294 6.338373 6.338295 6.335392 6.329269 1.491310 1.364908 4.528294 0.125654 0.002764 0.011091 0.000275 6.378957 0.130790 0.000180 0.088298 0.000123 6.378494 6.377714 6.375183 6.372276 1.503493 1.365236 4.822398 0.126455 0.002863 0.011564 0.000332 6.418047 0.131367 0.000395 0.084127 0.000285 6.419008 6.418136 6.415958 6.418000 1.569839 1.368130 5.131785 0.127639 0.002800 0.012403 0.000327 6.458325 0.131747 0.000690 0.093920 0.000369 6.459700 6.459341 6.457107 6.458146 1.628669 1.365436 5.435441 0.127896 0.002645 0.012092 0.000317 6.499246 0.132306 0.000847 0.076579 0.000155 6.499101 6.499292 6.496573 6.492685 1.623553 1.365012 5.674864 0.127844 0.002944 0.012620 0.000439 6.539457 0.133151 0.000233 0.067003 0.000087 6.538509 6.538605 6.535599 6.529503 1.562146 1.365565 5.919578 0.128459 0.002880 0.013101 0.000220 6.579248 0.134075 0.000084 0.072292 0.000212 6.578794 6.578365 6.575547 6.570181 1.550813 1.365952 6.154914 0.128909 0.002871 0.013468 0.000268 6.618083 0.134148 0.000222 0.063800 0.000079 6.618913 6.618081 6.615818 6.615031 1.595659 1.366346 6.379245 0.129222 0.002751 0.013737 0.000169 6.657670 0.134099 0.000064 0.066712 0.000277 6.658759 6.658123 6.656005 6.657335 1.653598 1.366337 6.612858 0.129932 0.002840 0.014124 0.000263 6.698083 0.134558 0.000111 0.067649 0.000034 6.698423 6.698352 6.695860 6.694718 1.688205 1.366609 6.827501 0.130355 0.002678 0.014223 0.000333 6.738443 0.136202 0.000063 0.054014 0.000237 6.737792 6.737958 6.735006 6.729807 1.650712 1.366737 6.998072 0.130665 0.002568 0.014880 0.000221 6.778510 0.136346 0.000131 0.048726 0.000057 6.778111 6.778008 6.775073 6.767403 1.618411 1.368132 7.173333 0.131230 0.002745 0.014839 0.000309 6.818114 0.137036 0.000684 0.049224 0.000224 6.818552 6.817872 6.815402 6.811476 1.627107 1.368362 7.324990 0.131378 0.002861 0.015386 0.000405 6.856847 0.136463 0.000234 0.041259 0.000058 6.858218 6.857343 6.855194 6.855844 1.667599 1.368245 7.477675 0.131690 0.002773 0.015587 0.000342 6.896893 0.136781 0.000392 0.044998 0.000204 6.898150 6.897828 6.895518 6.896068 1.740154 1.367473 7.623773 0.132023 0.002675 0.015759 0.000114 6.936994 0.137468 0.000078 0.041164 0.000115 6.936898 6.937115 6.934354 6.930670 1.737386 1.367576 7.780162 0.132201 0.002782 0.016396 0.000239 6.977711 0.138336 0.000039 0.048702 0.000062 6.977067 6.977223 6.974241 6.966585 1.691505 1.367719 7.947232 0.132506 0.002828 0.016499 0.000447 7.016873 0.138738 0.000153 0.045514 0.000121 7.016814 7.016359 7.013682 7.007817 1.666435 1.368227 8.085264 0.132733 0.002747 0.016772 0.000478 7.056404 0.138242 0.000083 0.036485 0.000066 7.057545 7.056652 7.054377 7.053235 1.689216 1.368145 8.212130 0.133071 0.002800 0.016864 0.000247 7.096462 0.138645 0.000063 0.036316 0.000071 7.097840 7.097256 7.095140 7.096189 1.772567 1.367271 8.336168 0.133068 0.002765 0.017055 0.000375 7.136898 0.138249 0.000253 0.035394 0.000149 7.137939 7.137959 7.135416 7.134272 1.799117 1.368269 8.456307 0.133490 0.002845 0.017362 0.000630 7.177223 0.139167 0.000347 0.032774 0.000034 7.177242 7.177541 7.174560 7.168201 1.760509 1.368433 8.573286 0.133679 0.002786 0.017843 0.000407 7.217073 0.140362 0.000072 0.038315 0.000039 7.216568 7.216508 7.213586 7.206185 1.725134 1.368810 8.707550 0.133805 0.002931 0.017949 0.000490 7.256492 0.140321 0.000131 0.035638 0.000087 7.257251 7.256658 7.254097 7.251064 1.729020 1.368697 8.825395 0.134240 0.002873 0.018215 0.000286 7.295875 0.140144 0.000113 0.033460 0.000081 7.297193 7.296469 7.294388 7.295979 1.788254 1.369131 8.939250 0.134403 0.002802 0.018200 0.000205 7.335901 0.139886 0.000069 0.032155 0.000129 7.337694 7.337372 7.335130 7.336670 1.828655 1.368986 9.038929 0.134697 0.002705 0.018399 0.000225 7.376021 0.140539 0.000032 0.024979 0.000087 7.376469 7.376687 7.373912 7.369640 1.828554 1.368885 9.123878 0.134777 0.002985 0.018688 0.000358 7.416467 0.141482 0.000093 0.026225 0.000054 7.415526 7.415761 7.412679 7.404709 1.798194 1.369122 9.218580 0.134785 0.002717 0.018718 0.000439 7.456491 0.141772 0.000138 0.026077 0.000079 7.456014 7.455738 7.452913 7.448495 1.769343 1.369030 9.301455 0.135039 0.002761 0.018988 0.000245 7.495792 0.141203 0.000141 0.022885 0.000056 7.496873 7.496121 7.493898 7.494170 1.797024 1.369363 9.386051 0.135053 0.002747 0.019160 0.000469 7.535330 0.140728 0.000187 0.024612 0.000075 7.537567 7.536984 7.534905 7.537218 1.854529 1.369247 9.456742 0.135408 0.002809 0.019238 0.000348 7.575831 0.141084 0.000040 0.017938 0.000165 7.576693 7.576706 7.574171 7.572543 1.894827 1.369277 9.537369 0.135313 0.002775 0.019443 0.000114 7.616800 0.141868 0.000089 0.028623 0.000246 7.615802 7.616151 7.613103 7.607276 1.877238 1.369242 9.620556 0.135612 0.002720 0.019710 0.000205 7.656859 0.142447 0.000090 0.017044 0.000325 7.656357 7.656316 7.653338 7.648014 1.818910 1.369446 9.675327 0.135585 0.002799 0.019581 0.000327 7.696744 0.141720 0.000026 0.017079 0.000405 7.697376 7.696711 7.694307 7.691313 1.816479 1.369468 9.729719 0.135466 0.002630 0.019717 0.000291 7.735736 0.141086 0.000191 0.013903 0.000144 7.737266 7.736529 7.734426 7.735492 1.879454 1.369704 9.777803 0.135797 0.002547 0.019930 0.000417 7.774943 0.141749 0.000148 0.014249 0.000095 7.775954 7.775628 7.773260 7.774251 1.941848 1.270241 9.134794 0.123131 0.016081 0.114440 0.002250 7.815161 0.110940 0.123656 0.864704 0.016534 7.814958 7.815115 7.812154 7.809192 1.940909 0.369712 2.452328 -0.003832 0.004271 0.096587 0.000180 7.853628 -0.035476 0.276879 2.237896 0.039812 7.852355 7.852022 7.848737 7.842336 1.843080 0.787546 -0.333600 0.107895 0.026887 0.027064 0.005736 7.896158 0.200736 0.422197 0.266591 0.089965 7.895100 7.894370 7.891364 7.885031 1.876978 1.560859 0.160772 0.281260 0.006195 0.006380 0.001140 7.935651 0.290656 0.037378 0.053339 0.009050 7.935840 7.934687 7.932052 7.931216 1.936503 1.481702 0.054611 0.264694 0.003301 0.002704 0.000682 7.974029 0.265733 0.009816 0.021937 0.002578 7.975050 7.974039 7.971456 7.973529 1.992938 1.509663 0.137019 0.270584 0.003069 0.000609 0.000722 8.014803 0.274370 0.003335 0.014781 0.001306 8.014740 8.014406 8.011406 8.010160 2.040995 1.503067 0.179173 0.269101 0.002879 0.000873 0.000765 8.054977 0.271751 0.001211 0.014555 0.000494 8.053912 8.053868 8.050557 8.044395 2.000561 1.504379 0.231935 0.269786 0.003165 0.001088 0.000593 8.095017 0.273176 0.000439 0.014915 0.000285 8.093371 8.092926 8.089625 8.081929 1.959318 1.504342 0.279154 0.269498 0.002896 0.000932 0.000451 8.135564 0.273044 0.000140 0.011171 0.000183 8.135571 8.134478 8.131569 8.128454 1.969537 1.504443 0.314160 0.269729 0.003193 0.001281 0.000722 8.175121 0.272510 0.000191 0.010905 0.000069 8.175969 8.174793 8.172227 8.173163 2.019269 1.504437 0.354913 0.269798 0.003164 0.001005 0.000483 8.214590 0.272455 0.000299 0.012018 0.000198 8.215527 8.214878 8.212186 8.211863 2.085936 1.504019 0.394847 0.269776 0.003132 0.001120 0.000573 8.254711 0.272827 0.000161 0.010953 0.000157 8.254148 8.253976 8.250757 8.246340 2.073336 1.504039 0.433234 0.269736 0.003179 0.001364 0.000758 8.294693 0.273556 0.000267 0.011223 0.000158 8.293265 8.293008 8.289535 8.281975 2.028823 1.503848 0.469937 0.269759 0.003096 0.001183 0.000767 8.334096 0.273228 0.000179 0.009978 0.000148 8.333532 8.332720 8.329593 8.323708 2.015918 1.504008 0.502310 0.269872 0.003260 0.001345 0.000432 8.373788 0.272770 0.000075 0.008835 0.000125 8.374680 8.373453 8.370825 8.369170 2.043922 1.504110 0.534732 0.269641 0.002860 0.001302 0.000459 8.413459 0.272021 0.000047 0.010159 0.000206 8.414742 8.413764 8.411229 8.411644 2.117241 1.503815 0.571328 0.269945 0.003037 0.001181 0.000468 8.453177 0.273508 0.000132 0.009972 0.000164 8.453451 8.453041 8.449986 8.448506 2.137439 -1.019462 0.010361 -0.187333 0.002866 0.000114 0.000587 3.312858 -0.266901 0.376717 0.003900 0.069241 3.303013 3.292132 3.274676 3.274342 0.794405 -1.443886 0.017560 -0.265074 0.003043 0.000162 0.000643 3.315706 -0.265582 0.015570 0.001712 0.002654 3.314906 3.314709 3.312224 3.305323 0.714462 -1.462559 0.021642 -0.268021 0.003200 0.000092 0.000601 3.323017 -0.265513 0.001132 0.000426 0.000309 3.322765 3.321997 3.319859 3.314823 0.700156 -1.464830 0.021717 -0.268829 0.002920 0.000227 0.000676 3.332522 -0.266838 0.000797 0.000161 0.000179 3.333631 3.332544 3.330851 3.330952 0.715508 -1.465583 0.022452 -0.269216 0.003148 0.000082 0.000677 3.343869 -0.268126 0.000496 0.000618 0.000091 3.345937 3.345096 3.343536 3.344810 0.766187 -1.464825 0.025349 -0.268811 0.003061 0.000168 0.000507 3.356462 -0.266891 0.000136 0.001138 0.000173 3.356965 3.356701 3.354705 3.353315 0.793183 -1.464437 0.029479 -0.268619 0.003256 0.000368 0.000804 3.370206 -0.266029 0.000047 0.000952 0.000034 3.369904 3.369858 3.367349 3.362625 0.751270 -1.464259 0.030658 -0.268463 0.003052 0.000066 0.000537 3.385992 -0.265636 0.000212 0.000146 0.000078 3.385428 3.385058 3.382663 3.376378 0.713141 -1.464587 0.029837 -0.268657 0.003152 0.000420 0.000845 3.402481 -0.266593 0.000442 0.000205 0.000138 3.402799 3.401874 3.400046 3.397570 0.712313 -1.464070 0.033845 -0.268498 0.002959 0.000150 0.000393 3.420662 -0.266776 0.000547 0.002819 0.000132 3.422061 3.421000 3.419443 3.421013 0.756806 -1.463632 0.043069 -0.268571 0.003037 0.000062 0.000770 3.439852 -0.267039 0.000316 0.001763 0.000115 3.440999 3.440411 3.438588 3.440735 0.809795 -1.463600 0.054340 -0.268211 0.003045 0.001097 0.000110 3.462012 -0.265712 0.000499 0.006706 0.000034 3.462063 3.461983 3.459632 3.457413 0.795378 -1.462234 0.081122 -0.268025 0.003126 0.000284 0.000777 3.485724 -0.265237 0.000141 0.006401 0.000131 3.484460 3.484343 3.481819 3.474454 0.748802 -1.461758 0.092853 -0.267681 0.002405 0.000391 0.001186 3.510447 -0.265205 0.000290 0.001478 0.000042 3.509772 3.509044 3.506867 3.502162 0.726198 -1.461082 0.096307 -0.267736 0.003308 0.000344 0.000373 3.535546 -0.265662 0.000035 0.000403 0.000040 3.536578 3.535362 3.533597 3.534363 0.753974 -1.460840 0.097721 -0.267523 0.002870 0.000402 0.000428 3.562736 -0.265879 0.000116 0.000916 0.000060 3.564250 3.563360 3.561684 3.564630 0.824756 -1.461256 0.101418 -0.267505 0.002944 0.000323 0.000542 3.593004 -0.265711 0.000232 0.000869 0.000056 3.593634 3.593381 3.591273 3.590855 0.841928 -1.461049 0.103129 -0.267688 0.002784 0.000105 0.000421 3.625485 -0.265391 0.000356 0.000356 0.000023 3.624500 3.624484 3.621904 3.616032 0.808680 -1.460908 0.105235 -0.267592 0.003140 0.000044 0.000712 3.657934 -0.264521 0.000345 0.000818 0.000039 3.656938 3.656422 3.653926 3.648409 0.761199 -1.460971 0.108110 -0.267592 0.002900 0.000333 0.000608 3.691579 -0.265104 0.000352 0.000934 0.000034 3.691823 3.690692 3.688653 3.686711 0.768435 -1.460698 0.111934 -0.267243 0.003013 0.000254 0.000553 3.726396 -0.265681 0.000232 0.001242 0.000142 3.727821 3.726700 3.725030 3.726455 0.843698 -1.460769 0.116802 -0.267485 0.002908 0.000199 0.000493 3.764406 -0.266002 0.000192 0.001578 0.000113 3.765901 3.765175 3.763253 3.764242 0.880555 -1.460634 0.125173 -0.267193 0.002835 0.000324 0.000634 3.803737 -0.264875 0.000113 0.003709 0.000109 3.803068 3.802874 3.800332 3.796736 0.878758 -1.461232 0.139771 -0.267560 0.002875 0.000423 0.000694 3.843225 -0.264470 0.000166 0.004144 0.000070 3.841915 3.841651 3.838981 3.833005 0.836657 -1.461319 0.157306 -0.267413 0.002957 0.000635 0.000582 3.882667 -0.264521 0.000029 0.006509 0.000059 3.882087 3.881253 3.878964 3.874215 0.816667 -1.461404 0.183109 -0.267529 0.002873 0.000785 0.000258 3.921772 -0.265970 0.000043 0.008098 0.000064 3.922581 3.921336 3.919565 3.918714 0.859718 -1.461617 0.210470 -0.267421 0.002887 0.000559 0.000405 3.960695 -0.265476 0.000058 0.007119 0.000053 3.962045 3.960974 3.959131 3.960644 0.909631 -1.461460 0.227908 -0.267371 0.002835 0.000705 0.000574 4.000471 -0.264856 0.000095 0.003243 0.000144 4.000545 4.000134 3.997819 3.996269 0.949584 -1.461524 0.241355 -0.267178 0.002866 0.000696 0.000484 4.040716 -0.264606 0.000083 0.004667 0.000167 4.039711 4.039557 4.036857 4.031032 0.919330 -1.461381 0.258084 -0.267251 0.002998 0.000560 0.000704 4.080725 -0.264472 0.000079 0.005193 0.000257 4.080266 4.079694 4.077124 4.070348 0.867236 -1.461617 0.273153 -0.266915 0.002937 0.000542 0.000594 4.120627 -0.264975 0.000084 0.002986 0.000190 4.121289 4.120069 4.118026 4.114355 0.884683 -1.461537 0.280836 -0.267392 0.003027 0.000630 0.000557 4.160076 -0.265126 0.000048 0.001877 0.000039 4.161347 4.160106 4.158237 4.158819 0.944530 -1.461752 0.287708 -0.267223 0.002964 0.000694 0.000452 4.200374 -0.265125 0.000127 0.001914 0.000068 4.201387 4.200770 4.198659 4.198896 1.011357 -1.461995 0.294448 -0.267199 0.002934 0.000538 0.000598 4.240364 -0.264979 0.000067 0.002124 0.000082 4.240065 4.239930 4.237373 4.234099 0.995556 -1.462145 0.302291 -0.267199 0.002758 0.000647 0.000613 4.280690 -0.264111 0.000046 0.002131 0.000103 4.280322 4.279953 4.277261 4.270600 0.923326 -1.461865 0.308406 -0.267024 0.002867 0.000664 0.000485 4.319509 -0.264460 0.000138 0.001647 0.000037 4.319217 4.318215 4.315879 4.309179 0.920303 -1.461785 0.313214 -0.267013 0.003064 0.000665 0.000801 4.359105 -0.264870 0.000024 0.001008 0.000017 4.360156 4.358863 4.356863 4.355571 0.978858 -1.461777 0.317329 -0.267085 0.002943 0.000678 0.000444 4.398174 -0.265028 0.000071 0.001547 0.000055 4.399326 4.398350 4.396406 4.397867 1.040994 -1.462316 0.323031 -0.267147 0.003007 0.000794 0.000641 4.438817 -0.265456 0.000197 0.001472 0.000055 4.439484 4.439142 4.436816 4.435976 1.048916 -1.462672 0.326663 -0.267196 0.002845 0.000706 0.000361 4.479137 -0.264802 0.000024 0.000801 0.000063 4.478923 4.478809 4.476067 4.470259 1.001369 -1.462592 0.330267 -0.267339 0.002829 0.000504 0.000598 4.519481 -0.264518 0.000104 0.001297 0.000079 4.518592 4.518005 4.515379 4.507924 0.981259 -1.462427 0.335670 -0.267160 0.002894 0.000675 0.000568 4.558805 -0.264331 0.000028 0.001712 0.000029 4.558935 4.557788 4.555543 4.553329 0.997576 -1.462097 0.340039 -0.267048 0.002950 0.000527 0.000631 4.598606 -0.265183 0.000103 0.001035 0.000177 4.600180 4.598968 4.597076 4.598616 1.051346 -1.462360 0.344415 -0.267089 0.002868 0.000735 0.000577 4.638925 -0.265638 0.000136 0.001265 0.000198 4.639961 4.639315 4.637270 4.638007 1.096627 -1.462862 0.347929 -0.267052 0.002864 0.000687 0.000595 4.679137 -0.264841 0.000206 0.000983 0.000143 4.679097 4.678903 4.676280 4.672489 1.079170 -1.463403 0.352127 -0.267341 0.002805 0.000685 0.000428 4.719275 -0.264130 0.000058 0.001344 0.000252 4.717839 4.717530 4.714682 4.707816 1.042862 -1.463674 0.357340 -0.267302 0.002941 0.000627 0.000819 4.758711 -0.264195 0.000101 0.001595 0.000107 4.758368 4.757500 4.754952 4.750974 1.025994 Model 5700 Biosusceptometer page 50 of 76 1 1 1 1 1 1 1 1 1 1 1 1 1 1 1 1 1 1 1 1 1 1 1 1 1 1 1 1 1 1 1 1 1 1 1 1 1 1 1 1 1 1 1 1 1 1 1 1 1 1 1 1 1 -1.463419 -1.463383 -1.463554 -1.463815 -1.463872 -1.463957 -1.464102 -1.464393 -1.464769 -1.464712 -1.464405 -1.464794 -1.464797 -1.465080 -1.465548 -1.465201 -1.465422 -1.465095 -1.465266 -1.465665 -1.465581 -1.465774 -1.465425 -1.465311 -1.465469 -1.465592 -1.465851 -1.465760 -1.465502 -1.465929 -1.465362 -1.465741 -1.465482 -1.464797 -1.465117 -1.465032 -1.465284 -1.465299 -1.464771 -1.464673 -1.464543 -1.464512 -1.465111 -1.466093 -1.466042 -1.463453 -1.464050 -1.464173 -1.463916 -1.464043 -1.463622 -1.463546 -1.463665 0.361823 0.364737 0.368121 0.369233 0.369977 0.370949 0.372758 0.373791 0.373911 0.374968 0.375444 0.376960 0.377213 0.378911 0.379475 0.380037 0.380956 0.382518 0.383216 0.383651 0.385053 0.385409 0.386411 0.386498 0.387471 0.388687 0.390038 0.390629 0.390942 0.392534 0.394021 0.395630 0.395959 0.397339 0.398088 0.399297 0.400967 0.402039 0.402596 0.403592 0.405238 0.405879 0.406497 0.407071 0.408556 0.409710 0.411045 0.411587 0.413402 0.414516 0.414770 0.415596 0.416562 -0.267447 -0.267371 -0.267208 -0.267035 -0.267284 -0.267304 -0.267396 -0.267406 -0.267245 -0.267409 -0.267301 -0.267303 -0.267396 -0.267437 -0.267359 -0.267641 -0.267326 -0.267246 -0.267394 -0.267220 -0.267521 -0.267386 -0.267501 -0.267133 -0.267337 -0.267101 -0.267298 -0.267285 -0.267466 -0.267130 -0.267282 -0.267071 -0.267012 -0.267125 -0.266860 -0.267143 -0.266967 -0.266953 -0.266726 -0.266966 -0.266594 -0.266864 -0.266776 -0.267208 -0.267143 -0.266603 -0.266282 -0.266334 -0.266470 -0.266368 -0.266517 -0.266180 -0.266396 0.002972 0.003152 0.002970 0.002950 0.003043 0.003102 0.003013 0.003090 0.002849 0.003012 0.002975 0.003039 0.002887 0.002970 0.003076 0.002901 0.002916 0.002974 0.002913 0.003127 0.002932 0.003064 0.002940 0.002871 0.003093 0.002971 0.002837 0.003018 0.003014 0.002950 0.002945 0.002990 0.003018 0.003011 0.002982 0.002995 0.002877 0.002985 0.002943 0.002936 0.002993 0.002866 0.002989 0.003014 0.003129 0.003042 0.002938 0.003038 0.002883 0.003041 0.003038 0.002944 0.002755 0.000747 0.000801 0.000816 0.000709 0.000657 0.000713 0.000753 0.000693 0.000709 0.000785 0.000685 0.000763 0.000673 0.000815 0.000755 0.000876 0.000847 0.000884 0.000627 0.000635 0.000874 0.000795 0.000754 0.000933 0.000803 0.000975 0.000804 0.000689 0.000904 0.000619 0.000732 0.000892 0.000790 0.000814 0.000837 0.000834 0.000814 0.000772 0.000765 0.000777 0.000870 0.000800 0.000834 0.000845 0.000893 0.000730 0.000754 0.000812 0.000747 0.001030 0.000947 0.000806 0.000865 0.000545 0.000305 0.000588 0.000587 0.000567 0.000543 0.000551 0.000609 0.000506 0.000322 0.000698 0.000378 0.000402 0.000582 0.000572 0.000618 0.000620 0.000528 0.000517 0.000757 0.000655 0.000416 0.000500 0.000728 0.000528 0.000500 0.000486 0.000628 0.000425 0.000466 0.000386 0.000553 0.000493 0.000612 0.000514 0.000470 0.000441 0.000669 0.000538 0.000645 0.000475 0.000622 0.000553 0.000621 0.000456 0.000524 0.000271 0.000579 0.000598 0.000551 0.000607 0.000715 0.000490 4.798418 4.838557 4.878009 4.917957 4.958853 4.998851 5.037853 5.078210 5.118828 5.159302 5.199062 5.238307 5.277882 5.318694 5.359406 5.399153 5.438066 5.477837 5.517874 5.558548 5.599312 5.639494 5.678840 5.718241 5.758153 5.798209 5.839152 5.879159 5.918212 5.957995 5.998742 6.039114 6.079103 6.117856 6.157015 6.197322 6.236608 6.277417 6.316434 6.356070 6.396024 6.436940 6.478093 6.517458 6.557232 6.596747 6.636506 6.677002 6.717487 6.757151 6.796296 6.836160 6.876817 -0.265371 -0.265070 -0.265019 -0.264403 -0.264151 -0.264865 -0.265300 -0.265298 -0.264959 -0.264461 -0.263985 -0.265027 -0.265558 -0.265640 -0.264576 -0.263541 -0.264768 -0.265486 -0.265733 -0.264284 -0.264466 -0.264409 -0.265105 -0.264982 -0.264640 -0.264577 -0.264446 -0.264550 -0.264628 -0.264945 -0.264734 -0.264510 -0.263552 -0.264500 -0.264471 -0.265103 -0.264187 -0.263491 -0.264006 -0.264740 -0.264330 -0.264204 -0.264017 -0.264546 -0.264261 -0.263606 -0.263731 -0.263442 -0.263366 -0.263060 -0.264222 -0.263902 -0.264050 0.000181 0.000152 0.000071 0.000145 0.000108 0.000076 0.000096 0.000045 0.000098 0.000112 0.000053 0.000147 0.000041 0.000168 0.000107 0.000052 0.000060 0.000075 0.000069 0.000099 0.000078 0.000099 0.000180 0.000062 0.000064 0.000019 0.000162 0.000185 0.000134 0.000152 0.000129 0.000063 0.000122 0.000179 0.000218 0.000152 0.000232 0.000175 0.000073 0.000051 0.000079 0.000272 0.000161 0.001099 0.001290 0.000189 0.000082 0.000057 0.000162 0.000198 0.000383 0.000308 0.000144 0.000871 0.001142 0.000522 0.000387 0.000068 0.000672 0.000298 0.000271 0.000133 0.000263 0.000442 0.000187 0.000504 0.000198 0.000312 0.000044 0.000593 0.000214 0.000200 0.000269 0.000320 0.000207 0.000196 0.000185 0.000246 0.000568 0.000106 0.000298 0.000106 0.000718 0.000383 0.000309 0.000253 0.000359 0.000303 0.000286 0.000720 0.000101 0.000482 0.000156 0.000618 0.000098 0.000208 0.000329 0.000362 0.000512 0.000108 0.000558 0.000296 0.000437 0.000225 0.000582 0.000195 0.000078 0.000094 0.000040 0.000083 0.000059 0.000077 0.000041 0.000069 0.000044 0.000063 0.000044 0.000033 0.000017 0.000035 0.000151 0.000151 0.000125 0.000164 0.000175 0.000146 0.000143 0.000060 0.000073 0.000082 0.000130 0.000200 0.000141 0.000166 0.000162 0.000122 0.000218 0.000208 0.000190 0.000163 0.000164 0.000150 0.000106 0.000113 0.000050 0.000077 0.000105 0.000096 0.000166 0.000153 0.000127 0.000294 0.000183 0.000152 0.000153 0.000219 0.000207 0.000295 0.000203 4.799347 4.839421 4.877891 4.917157 4.957845 4.998626 5.038643 5.079055 5.118871 5.157882 5.197694 5.238891 5.278984 5.319202 5.358713 5.397803 5.437861 5.478816 5.518726 5.557712 5.598030 5.638870 5.679992 5.719329 5.758066 5.797191 5.838242 5.879959 5.919195 5.958267 5.998867 6.038118 6.079099 6.117998 6.158268 6.197625 6.235435 6.276138 6.316640 6.357134 6.396530 6.436259 6.476633 6.517202 6.557541 6.597406 6.636422 6.675976 6.716494 6.756761 6.797133 6.836991 6.876662 4.798172 4.838522 4.877551 4.916940 4.957242 4.997463 5.037410 5.078352 5.118742 5.157581 5.196717 5.237521 5.277908 5.318734 5.358422 5.397123 5.436691 5.477502 5.517921 5.557396 5.597623 5.637822 5.678538 5.718179 5.757669 5.797027 5.837504 5.878636 5.917868 5.957507 5.998562 6.037695 6.078141 6.116685 6.157233 6.197129 6.235186 6.275394 6.315380 6.355830 6.395754 6.436054 6.476188 6.516109 6.556075 6.596199 6.635877 6.675639 6.715796 6.755445 6.795669 6.836105 6.876214 4.796120 4.836587 4.875120 4.914117 4.954532 4.995162 5.035421 5.076128 5.116006 5.154700 5.194107 5.235424 5.275910 5.316285 5.355418 5.394198 5.434385 5.475530 5.515658 5.554530 5.594606 5.635294 5.676378 5.716049 5.755006 5.794042 5.834716 5.876238 5.915695 5.955132 5.995755 6.034709 6.075444 6.114402 6.155035 6.194576 6.232197 6.272429 6.312845 6.353686 6.393366 6.433099 6.473119 6.513399 6.553833 6.593927 6.633159 6.672551 6.712829 6.752888 6.793373 6.833699 6.873339 4.795553 4.838276 4.875216 4.909215 4.948360 4.991970 5.037210 5.077955 5.112177 5.147852 5.189610 5.235835 5.277480 5.313732 5.349372 5.388255 5.431535 5.476239 5.515300 5.550426 5.587465 5.629353 5.675487 5.716234 5.752791 5.788181 5.828002 5.873306 5.915240 5.955110 5.991795 6.027135 6.070418 6.113797 6.157245 6.193140 6.225281 6.266335 6.310750 6.355047 6.393655 6.429299 6.467379 6.508536 6.553190 6.595817 6.631905 6.666434 6.705443 6.750269 6.795388 6.833851 6.868273 1.064237 1.132459 1.145696 1.113303 1.072571 1.088681 1.156687 1.190279 1.194950 1.147324 1.121987 1.173017 1.229135 1.263176 1.219316 1.181155 1.208340 1.258285 1.313098 1.305328 1.250969 1.235285 1.271243 1.348604 1.383708 1.336013 1.282569 1.292733 1.372972 1.429505 1.399017 1.351470 1.342429 1.390267 1.448725 1.460150 1.435128 1.390648 1.400563 1.466193 1.513342 1.518548 1.456111 1.431783 1.484992 1.543620 1.577487 1.533244 1.495114 1.515175 1.563465 1.626014 1.614583 8.3 Code required for a compile Below are presented the files required for the Biosusceptometer software. To create a stand alone executable, these files should be compiled inside the CVI development environment and the routine "Create Distribution Kit" should be completed (see National Instruments manuals for LabWindows CVI for more details). Model 5700 Biosusceptometer page 51 of 76 Figure 8-6 Code Compile List 8.4 Utility Screens Various useful utilities can be accessed through the menu bar on the Main Panel. Through the Hardware Test bar the user can access the following panels (see below) and test the following functionality: SQUID outputs vs. time (all the measurements in this group are done using high speed data acquisition, 10 kSamples/sec and higher) Figure 8-7 SQUID Test Panel (high frequency) Lock-in outputs vs. time (amplitude of SQUID A, B and C on the frequency corresponding to the S - Locator Loop, set by the HP waveform generator) Model 5700 Biosusceptometer page 52 of 76 Figure 8-8 Locator Loop vs. Time Position transducer voltage vs. time Figure 8-9 Position Transducer vs. Time Water pressure voltage vs. time Figure 8-10 Water Pressure vs. time Model 5700 Biosusceptometer page 53 of 76 Handheld controller test – press on the handheld controller button should cause LED indicator “on” for the corresponding button on the software test panel. Figure 8-11HHC Test Panel Bed Test allows to move the patient bed up/down through the software panel interface and cycle the bed fully up and fully down “Number of Cycles” times. Figure 8-12 Bed Cycle Test Panel SQUID Controller panel allows to change the SQUID gains and to reset SQUIDs. Figure 8-13 SQUID Range Test Panel Run Locator Loop allows to test the locator loop functionality Model 5700 Biosusceptometer page 54 of 76 Figure 8-14 Locator Loop Test Panel Time Measurement panel acquires data from SQUID channels and stores the data in the file. The routine has been designed to monitor SQUID outputs with low data acquisition rate over extended periods of time to monitor the magnetic environment. The user is allowed to choose the SQUID gain, data acquisition speed and time. In addition, this routine provides real time data display. The user can also set the display update rate which is different than the data acquisition speed, and the display multiplier. This changes the X and Y axis on the display, this does not change the actual data recorded in the file. Figure 8-15 SQUID Low Frequency Test Panel Liquid Helium Monitor routine should be always used during liquid helium transfer. This routine reads the liquid helium level and calculates helium transfer rate. It also prompts the user to input the helium level value manually and specify transferring condition. The software gives estimated liquid helium level based on the dewar boil off. Model 5700 Biosusceptometer page 55 of 76 Figure 8-16 Helium Transfer Panel Figure 8-17 Helium Set Panel Help provides information on the operating system, etc. 8.5 Utilities for Locator Loop and Background Susceptibility Calibration These routines help the user to fit the data (which were obtained by the Biosusceptometer software for the patient measurement) and extract the coefficients and errors for the corresponding fit. It is the user's responsibility to know which file is used for calibration and which runs in the file are valid. The calibration is conducted on G20. 8.5.1 Calibrate Locator Loop The purpose of the Locator Loop Calibration is to generate a depth profile of the Locator Loop signal generated on a selected SQUID channel. Follow the command buttons from top to bottom: • select data file • select runs for calibration • select the SQUID channel – default SQUID A – the software is configured at the present time to calculate distances based on the SQUID A readings. Model 5700 Biosusceptometer page 56 of 76 • select type of fit – the software allows the user to use 2 formulae to establish the relation between the voltage read by the SQUID and the absolute distance in cm between Locator Loop and the pick up coil. The first formula is a polynomial of log(Voltage): Distance = An logn(Voltage) eq. 7-1 The second formula is A3 Distance = A0 + A1 ⋅ V + A2 V + eq. 7-2 + A5 V 1 3 A4 + V Additional details on locator loops and the use of equation 7-2 can be found in R. Engelhardt, K. Vallett and R. Fischer, "Printed Circuit Locator Loop for X-Y-Positioning and Z-distance Measurements", Recent Advances in Biomagnetism, T. Yoshimoto et al, eds. (Tohoku University Press, Sendai 1999) pp. 10-98 - 1101. In the case of second formula, the user is required to input preliminary coefficient to start the fit. These coefficients should be reasonably close to the real coefficients. • start calibration Figure 8-18 Locator Loop Calibration the results of the fit and the actual data are output on the graph on the following panel as well as the coefficients and the standard deviation of the fit the user can reject current fit (previous screen pops up where different runs can be chosen and the fitting routine can be repeated) or accept the fit (in this case, the obtained coefficients are saved in a special file) Model 5700 Biosusceptometer page 57 of 76 Figure 8-19 Locator Loop Calculation Panel 8.5.2 Background Susceptibility Calibration This routine establishes contributions from the Locator Loop and/or Water Bag to the SQUID signal during Patient measurements. The calibration is conducted on G20. Follow the command buttons from top to bottom: • select data file • select the type for the background susceptibility calibration to be performed (Water bag and Locator Loop vs. water, Locator Loop vs. air, Water bag vs. water) • select runs for the background calibration (For example, to perform Locator Loop susceptibility vs. air calibration one should mount the Locator Loop on a plastic bottle, perform the Patient run measurement, then remove the Locator Loop and perform the same measurement for the plastic bottle. The plastic bottle is the background for this calibration. The Locator Loop signal is the difference between the first measurement and the second measurement (the background). • start calibration - the software performs the least square fit to a polynomial Voltage = An(1/Distance)n The output is the polynomial coefficients for SQUID A, SQUID B, SQUID C and standard deviations of fits. the user can reject current fit (reselect the runs used for background calibrations and start new fit) or accept the current fit • select runs for the susceptibility calibration (referring to the example above, these are the runs of the Locator Loop on a plastic bottle) • start the susceptibility calibration - based on the polynomial coefficients for the background obtained above , the contribution from the background is calculated and subtracted from the susceptibility runs, polynomial fit is performed on the difference. The output is the polynomial coefficients for the desired susceptibility signal vs. distance for SQUID A, SQUID B, SQUID C and standard deviations. Model 5700 Biosusceptometer page 58 of 76 The user can reject the current fit (reselect the runs used for susceptibility calibrations and start new fit) or accept the current fit (the polynomial coefficient will be saved in a special file) Figure 8-20 Susceptibility Background Input Panel Figure 8-21 Susceptibility Calculation Result Panel 8.5.3 Subtraction of Tissue and locator signal Model 5700 Biosusceptometer page 59 of 76 8.5.4 Computation and errors 9 Safety Issues The system safety relay block diagram is shown in the following section (Figure 9-1 System Safety Schematic). NI JUNCTION BOX 1 6 PUR 2 7 BRN 3 8 WHT BRN 4 9 GRN ENABLE PIN ? VOLTAGE PIN ? READ 5 Alarm to Waterbag Power Supply (12VDC - 40mA) PNK Alarm from Waterbag (12VDC - 40mA) 1 2 6 7 - + J5 Connector on KXA Amp BLK 1413 1 GRY 9 8 TO WATERBAG Relay (NO) 2 3 Dewar Lift SW (NC) Gantry Mount YEL PIN ? WATER WARN BLK PIN ? 7 - RED ORN BLK 8 7 6 1 2 3 GND 9 8 ENABLE WHT DK BLU 4 ORN Bed Kill SW (NC) Panel Mount Z-UPPER LIMIT SW (NO) Bed Mount BLK 1 2 6 7 + 1 2 6 7 + - 1413 - 9 8 TAPESWITCH Relay (NC) 1413 9 10 GRN 5 FROM WATERBAG Relay (NC) PIN 24 GND 8 RED 1413 PIN 25 6 6 7 + DAQ ENABLE 5 LT BLU 1 2 PIN 34 +5V POWER PIN 33 GND 4 40 oz ACTIVATION TAPESWITCH (NO) 11 GND 12 CW 13 GND CCW 14 15 16 17 18 Z-LOWER LIMIT SW (NO) Bed Mount 9 8 Digital Relay (NC DURING DAQ) KXA AUX 5V + - Bed & Dewar Safety Switches TI (AND) GATE: P/N SN75451BD (TRISTAN P/N 03-0034) CP CLAIRE REED RELAY: P/N PRMA1C05B 2047 - Torino Liver Fe SIZE Date DWG NO 28 June 99 2047-E16 Tony Ewing SHEET REV 1 OF 1 Figure 9-1 System Safety Schematic 9.1 Bed Motion: The bed should never be raised such that any object touches to bottom of the dewar or water bag or damages the dewar tail. Model 5700 Biosusceptometer page 60 of 76 Care should be taken not to trap the patient between the bed and dewar tail. There are emergency stops for the bed and water bag on the gantry. If there is any indication of potential injury, these stops will interrupt the bed motion. The Emergency Stop (a large RED button)is interlocked so that when it is mechanically reset, power is not restored to the bed. There is a reset on the power interruptor that must be activated in order to restore power to the bed. (This prevents the bed from powering up immediately after the Emergency Stop is reset). When measuring patients, the bed should not be raised as to lift the patient into the dewar tail. If the patient complains or indicates significant discomfort due to pressure against the dewar tail, the measurement should be interrupted. To prevent injury, the dewar is held in the gantry by gravity; there is a limit switch that will cut off the bed motion if sufficient force is placed on the dewar tail to begin to lift it. The bed has skirts around it to prevent non-qualified personnel from accessing the bed motion apparatus. Additionally, one should not place extremities near or in the skirts when the bed is being raised or lowered. There is a bed trapping switch that stops the z-axis motor if an object is trapped between the box and bed bottom. In the case of a power failure or emergency switch actuation, the bed may be manually lowered. To do this, open the side doors on the bed. Manually move the drive belt in the direction indicated by the arrow until there is sufficient clearance to remove the patient or object. When the patient (or object) has been removed, close the doors. The bed table need not be returned to its prior position—the Z-position transducer will automatically indicate to the control system the new position of the bed table. 9.2 Water Bag The bottom of the water bag bellows is a latex product. Appropriate caution should be taken with patients who have a latex allergy. Do not allow sharp objects to contact the water bag. They could tear the thin material and cause the water bag to spill water on either the bed or patient Depending on the stage of the measurement, the water bag contains from tens of milliliters to a few liters of water. Over pressurization of the water bag can cause discomfort in patients. The water bag pressure should not exceed and equivalent force of 20-30 lbs. in adults and 8 lbs. on children. The water bag temperature should be kept at 37°C In the event that water bag bursts, stop the measurement and remove the patient allowing him/her to dry off. Replace the water bag bellows (§3.2.3.5) and restart the measurement process. De-ionized water should be used in the water bag system. 9.3 Dewar Safety See §3.2.4 for safety in handling cryogenic liquids. If the liquid helium flow alarm activates, stop all measurements and remove the patient. 9.3.1 If the flow indicator indicates low flow (< 200 SCCM), 1. check the liquid helium level meter to make sure that there is liquid helium in the dewar. If the dewar is empty, refill the dewar. Model 5700 Biosusceptometer page 61 of 76 2. If there is a low flow alarm and the level meter indicates sufficient liquid helium, check to see that the hose between the dewar and the flow meter has not come loose or developed a leak. 3. If neither 1. or 2. apply, contact your Tristan representative for instructions. The model BMD-35M dewar is held together by vacuum. Should the dewar lose vacuum, contact your Tristan representative for instructions before attempting to evacuate the dewar or refill the dewar. 9.3.2 If the flow indicator indicates high flow (> 2000 SCCM), 1. check the liquid helium level meter to make sure that there is liquid helium in the dewar. If the dewar is full (>100%), liquid helium may be in the neck region of the dewar causing high boiloff. Wait until the liquid helium level is below 100%. 2. If there is a high flow alarm and the level meter indicates sufficient liquid helium, check to see that the top of the dewar is “warm” (reasonably near room temperature). 3. If there is evidence of icing, either at the top of the dewar or on the dewar tail call the compnany. Again, if these instructions apply, contact your Tristan representative. In any case, do not resume patient measurements until helium gas flow is within reasonable values. If there are indications of damage to the dewar contact your Tristan representative immediately for instructions. 9.3.3 General comments about dewar safety Helium expands ~680 times from the liquid state at 4.2 K to the gaseous state at room temperature (300 K). Theoretically, this would mean that a completely enclosed cryogenic vessel filled with liquid helium and would have an internal pressure of 680 bar (atm.) when raised to room temperature. Thus it is necessary to vent the dewar, not only during normal operation, but when warming up the dewar. No blockage of the dewar must be permitted to occur. The BMD-35M dewar used has a 3.8 cm (1½”) neck tube that allows the helium vapor to vent to atmosphere. As can be seen in Figure 2-5, a neck tube blocks atmospheric gases from entering the cryogenic vessel (via cryopumping). This is to prevent water in the atmosphere from condensing in the neck and forming an ice plug. The venting helium exits from the top of the dewar insert through tubing to a flow meter which continuously monitors the gaseous flow rate and displays it as an equivalent liquid helium consumption (or boiloff) rate. Should the rate exceed either upper or lower limits, an alarm on the helium flow meter (see above) is triggered. The upper limit would indicate excessive heat input into the system, the lower indicating either exhaustion of all liquid helium or a blockage of the neck region. In either case, operator intervention is indicated. There are two additional exhaust ports. One is for the liquid helium transfer line and is normally blocked by a 3/8” plug. This plug is held in by a rubber o-ring that would only require ~1 psi over pressure to be forced out and vent the dewar. Should both the flow meter exit port and the transfer tube port be blocked, a third port contains a Swagelock B-4CP2-DR-10 10 psi check valve. This triple combination of active flow monitoring, o-ring plug and check valve reduces the potential for an unobserved over-pressurization of the dewar. Model 5700 Biosusceptometer page 62 of 76 9.4 Magnetic field concerns The model 5700 biosusceptometer contains a superconducting magnet. While the applied field is significantly less than magnets used in MRI systems, the following precautions should be taken. THE 5 GAUSS LINE SHOULD BE ASSUMED TO BE A 30 CM (12”) DIAMETER SPHERE LOCATED AT THE BOTTOM OF THE DEWAR TAIL. NO PERSONS WITH PACEMAKERS CAN BE ALLOWED WITHIN THIS REGION. We recommend that you indicate this region on the floor below the gantry. Depending on the location, patients with metal implants may not be able to be measured with this system. While it may not be a safety issue, the presence of metallic implants can interfere with the measurement process. Ferromagnetic objects should not be brought into proximity of the tail while the magnet is charged. Allowing ferromagnetic objects to be pulled into the dewar tail could break the water bag bellows or damage the dewar tail. The superconducting magnet must be kept at liquid helium temperatures while it is charged. If the dewar is warmed up without removing the field from the magnet, it will cause the magnet to go normal (no longer remain superconducting) and liberate its stored energy (“quench”). While the energy liberated (less than a few joules) is small and in no way would cause overpressurization of the dewar, this may damage the magnet’s windings and will void any warranty or service contract. 9.5 Other items to be guarded against To prevent interruption of service, an uninteruptable power supply (UPS) could be implemented. Tristan can not be held responsible for damage or injury incurred during a power failure. To prevent ground loops, a single isolation transformer where system power can be drawn is recommended. This does not include the water bag controller, which should be on a separate power supply system. Do not modify any part of the model 5700 biosusceptometer system. Unauthorized modifications may damage the system, interfere with its measurement capabilities or permit injury or death to occur. Tristan will not be responsible for the misuse of this system. The dual cross-plane lasers used for positioning the patients are solid-state laser diodes emitting light at 660-685 nm at a power of 0.5 mW (Class II). To avoid potential eye damage, anyone using the system should not stare directly into the beams. 10 Service and Maintenance 10.1 Inspection and Cleaning The most important feature in the care of the system is regularly filling the system with liquid helium. This must be done to keep the magnet and the SQUID detection circuitry operational. In addition to this, the system must be kept magnetically clean near the tail region. Always use gloves and special care in handling the tail and the rubber bellows. 10.2 Cryogenic Dewar Maintenance 10.2.1 Vacuum In normal operation the dewar should not need pumping since the dewar has a cryopump inside. The static pressure at the start should be <200 micron for 2 minutes. Model 5700 Biosusceptometer page 63 of 76 10.2.2 Sensor Maintenance Water and ice must be kept off the sensor in order to have reliable readings. If ice forms on the electrical connectors at the top of the dewar, the readings may not be accurate. 10.3 Bed Maintenance The bed must be lubricated every three months and the belts checked for tension. Care--Watch for the pulley screw on the motor if power is applied and the motor turns. This is not recommended. Do not apply power if the sides are uncovered. 10.4 Water Bag Maintenance The water bag must be checked for leaks periodically and the system kept free of trapped air. Maintenance of the water bag is covered in a separate document. 10.5 Mechanical Pump Maintenance Check the pump for backstreaming and oil periodically. 10.6 Transfer Tube Maintenance The two piece flexible transfer tube has an evacuated region in each section between the inner tube and the outer tube which is at room temperature. If the vacuum deteriorates, then the thermal isolation between the two tubes will also deteriorate, and the outer tube will frost up along its whole length when a transfer is attempted. It is possible that it will be impossible to transfer any liquid helium. The cause of such a deterioration may be either a leak or the mistaken opening of the evacuation valve. If the problem is a leak, it must be fixed. After repair, the transfer tube vacuum space must be evacuated before the transfer tube can be used. As little as 1/2 hour of pumping with a mechanical vacuum pump should be sufficient. 11 Appendices 11.1 Hardware PC and National cards setup Channel list is shown below: Channel assignment NI 6031 (64 Ch) 100 pin Callout ribbon AI SQUID A 3-4 A0,8 1 2 SQUID B 5-6 1,9 3 SQUID C 7-8 2,10 4 H20 9-10 3,11 Pressure 5 Z Position 11-12 4,12 6 Cardiac 13-14 5,13 7 X fluxgate 15-16 6,14 8 Y fluxgate 17-18 7,15 Model 5700 Biosusceptometer page 64 of 76 7/3/99 9 10 11 12 13 AO Z fluxgate Spare LL current Level Meter Flow Meter D1 D2 51-52 53-54 55-56 57-58 59-60 61-62 63-64 23-20 23-21 16,24 17,25 18,26 19,27 20,28 21,29 22,30 DAC0 DAC1 (23gd) Dig In/Out (24) NI 6025 (16Ch) AI AO None Motor Dig In/Out (8) Ground H2O FILL BED SPEED HI MISC. TOP H20 EMPTY BED UP MISC. BOTTOM NEXT BED DOWN 5 BACK START RESET 7 STOP Green STROBE 1 STROBE 0 black +5V Motor Enable Model 5700 Biosusceptometer 100 pin ribbon S100breakout 23-20 DAC0 (23gd) 75 73 PB3 PB4 79 77 PB1 PB2 83 81 PA7 PB0 87 85 PA5 PA6 91 89 95 93 98 97 57 PA3 PA4 PA1 PA2 Gd, PA0 PC4 61 33 34 25 (24gd) PC2 DGND +5V DIO0 page 65 of 76 Motor Fault sense Motor Diode fault Bed Relay Bed Relay Power Power PCI-2321 (all 10pin connectors) Com 1 Com 3 COM6 isolated (or COM 4 direct) 24 25 33 35 DGND +5V iMAG HP generator Water bag Rack Table - PC setup re: IRQ and addresses ******************** SYSTEM SUMMARY ******************** Windows version: 4.10.2222 Computer Name: Dell System BUS Type: ISA BIOS Name: Phoenix BIOS Date: 08/30/01 BIOS Version: Phoenix ROM BIOS PLUS Version 1.10 A08 Machine Type: IBM PC/AT Processor Vendor: GenuineIntel Processor Type: x86 Family 6 Model 8 Stepping 6 Math Co-processor: Present Registered Owner: Paul Harmatz Registered Company: ******************** IRQ SUMMARY ******************** IRQ Usage Summary: 00 - System timer 01 - Standard 101/102-Key or Microsoft Natural Keyboard 02 - Programmable interrupt controller 03 - Communications Port (COM2) 04 - Communications Port (COM1) 05 - 3Com 3C920 Integrated Fast Ethernet Controller (3C905C-TX Compatible) 05 - ACPI IRQ Holder for PCI IRQ Steering 05 - PCI-6031E 06 - Standard Floppy Disk Controller 07 - ECP Printer Port (LPT1) 08 - System CMOS/real time clock 09 - Intel(R) 810e Chipset Graphics Driver (DC133 FSB133) 4.11.01.1361 09 - SCI IRQ used by ACPI bus Model 5700 Biosusceptometer page 66 of 76 09 09 10 10 10 11 11 11 11 11 11 12 13 14 14 15 15 - ACPI IRQ Holder for PCI IRQ Steering XPERT 98 PCI (English) ACPI IRQ Holder for PCI IRQ Steering Intel(r) 82801AA SMBus Controller PCI-6025E N.I. PCI-232/4 (Isolated) Communications ACPI IRQ Holder for PCI IRQ Steering N.I. PCI-232/4 (Isolated) Multi-function N.I. PCI-232/4 (Isolated) Communications N.I. PCI-232/4 (Isolated) Communications N.I. PCI-232/4 (Isolated) Communications PS2 (PS/2) Numeric data processor Primary IDE controller (dual fifo) Intel(r) 82801AA Ultra ATA Controller Secondary IDE controller (dual fifo) Intel(r) 82801AA Ultra ATA Controller Port (COM7) Parent Port (COM5) Port (COM6) Port (COM8) ******************** IO PORT SUMMARY ******************** I/O Port Usage Summary: 0000h-001Fh - Direct memory access controller 0020h-003Fh - Programmable interrupt controller 0040h-005Fh - System timer 0060h-0060h - Standard 101/102-Key or Microsoft Natural Keyboard 0061h-0061h - System speaker 0062h-0063h - System board extension for ACPI BIOS 0064h-0064h - Standard 101/102-Key or Microsoft Natural Keyboard 0065h-006Fh - System board extension for ACPI BIOS 0070h-007Fh - System CMOS/real time clock 0080h-009Fh - Direct memory access controller 00A0h-00BFh - Programmable interrupt controller 00C0h-00DFh - Direct memory access controller 00E0h-00EFh - System board extension for ACPI BIOS 00F0h-00FFh - Numeric data processor 0170h-0177h - Intel(r) 82801AA Ultra ATA Controller 0170h-0177h - Secondary IDE controller (dual fifo) 01F0h-01F7h - Primary IDE controller (dual fifo) 01F0h-01F7h - Intel(r) 82801AA Ultra ATA Controller 02F8h-02FFh - Communications Port (COM2) 0376h-0376h - Secondary IDE controller (dual fifo) 0376h-0376h - Intel(r) 82801AA Ultra ATA Controller 0378h-037Fh - ECP Printer Port (LPT1) 03B0h-03BBh - Intel(R) 810e Chipset Graphics Driver (DC133 FSB133) 4.11.01. 03C0h-03DFh - Intel(R) 810e Chipset Graphics Driver (DC133 FSB133) 4.11.01. 03F0h-03F5h - Standard Floppy Disk Controller 03F6h-03F6h - Primary IDE controller (dual fifo) 03F6h-03F6h - Intel(r) 82801AA Ultra ATA Controller 03F7h-03F7h - Standard Floppy Disk Controller 03F8h-03FFh - Communications Port (COM1) 04D0h-04D1h - Programmable interrupt controller 0778h-077Fh - ECP Printer Port (LPT1) 0800h-085Fh - System board extension for ACPI BIOS 0860h-08FFh - System board extension for ACPI BIOS 0C00h-0C7Fh - System board extension for ACPI BIOS 0CF8h-0CFFh - PCI bus DCD0h-DCDFh - Intel(r) 82801AA SMBus Controller E000h-EFFFh - Intel(r) 82801AA PCI Bridge E000h-E0FFh - XPERT 98 PCI (English) EC00h-EC7Fh - 3Com 3C920 Integrated Fast Ethernet Controller (3C905C-TX Com ECC8h-ECCFh - N.I. PCI-232/4 (Isolated) Multi-function Parent ECC8h-ECCFh - N.I. PCI-232/4 (Isolated) Communications Port (COM8) ECD8h-ECDFh - N.I. PCI-232/4 (Isolated) Communications Port (COM7) ECD8h-ECDFh - N.I. PCI-232/4 (Isolated) Multi-function Parent ECE8h-ECEFh - N.I. PCI-232/4 (Isolated) Communications Port (COM6) ECE8h-ECEFh - N.I. PCI-232/4 (Isolated) Multi-function Parent ECF8h-ECFFh - N.I. PCI-232/4 (Isolated) Multi-function Parent ECF8h-ECFFh - N.I. PCI-232/4 (Isolated) Communications Port (COM5) FFA0h-FFA7h - Primary IDE controller (dual fifo) FFA0h-FFAFh - Intel(r) 82801AA Ultra ATA Controller FFA8h-FFAFh - Secondary IDE controller (dual fifo) Model 5700 Biosusceptometer page 67 of 76 ******************** UPPER MEMORY USAGE SUMMARY ******************** Memory Usage Summary: 00000000h-0009FFFFh 000A0000h-000AFFFFh 000B0000h-000BFFFFh 000F0000h-000FFFFFh 00100000h-00FFFFFFh 01000000h-07EADFFFh F4000000h-F7FFFFFFh FC000000h-FEFFFFFFh FC000000h-FCFFFFFFh FD000000h-FD01FFFFh FD020000h-FD020FFFh FDFFB800h-FDFFB87Fh FDFFBC00h-FDFFBC7Fh FDFFC000h-FDFFCFFFh FDFFD000h-FDFFDFFFh FDFFE000h-FDFFEFFFh FDFFF000h-FDFFFFFFh FF000000h-FF07FFFFh FFB00000h-FFBFFFFFh FFC00000h-FFFFFFFFh - System board extension for ACPI BIOS Intel(R) 810e Chipset Graphics Driver (DC133 FSB133) Intel(R) 810e Chipset Graphics Driver (DC133 FSB133) System board extension for ACPI BIOS System board extension for ACPI BIOS System board extension for ACPI BIOS Intel(R) 810e Chipset Graphics Driver (DC133 FSB133) Intel(r) 82801AA PCI Bridge XPERT 98 PCI (English) XPERT 98 PCI (English) XPERT 98 PCI (English) 3Com 3C920 Integrated Fast Ethernet Controller (3C905 N.I. PCI-232/4 (Isolated) Multi-function Parent PCI-6031E PCI-6031E PCI-6025E PCI-6025E Intel(R) 810e Chipset Graphics Driver (DC133 FSB133) System board extension for ACPI BIOS System board extension for ACPI BIOS ******************** DMA USAGE SUMMARY ******************** DMA Channel Usage Summary: 02 - Standard Floppy Disk Controller 04 - Direct memory access controller ******************** MEMORY SUMMARY ******************** 640 KB Total Conventional Memory 129236 KB Total Extended Memory ******************** DISK DRIVE INFO ******************** A: Floppy Drive, 3.5" 1.44M 963 Cylinders 8 Heads 512 Bytes/Sector 32 Sectors/Track C: Fixed Disk 9982624K Total 1244 Cylinders 255 Heads 512 Bytes/Sector 63 Sectors/Track D: CD-ROM Drive 8140448K Free ******************** SYSTEM DEVICE INFO ******************** Class: Data Acquisition Devices Device: PCI-6031E Resources: IRQ: 05 MEM: FDFFD000h-FDFFDFFFh MEM: FDFFC000h-FDFFCFFFh Class: Data Acquisition Devices Device: PCI-6025E Resources: IRQ: 10 MEM: FDFFF000h-FDFFFFFFh MEM: FDFFE000h-FDFFEFFFh Class: Ports (COM & LPT) Device: N.I. PCI-232/4 (Isolated) Communications Port (COM8) Resources: IRQ: 11 I/O: ECC8h-ECCFh Class: Ports (COM & LPT) Device: N.I. PCI-232/4 (Isolated) Communications Port (COM7) Model 5700 Biosusceptometer page 68 of 76 Resources: IRQ: 11 I/O: ECD8h-ECDFh Class: Ports (COM & LPT) Device: N.I. PCI-232/4 (Isolated) Communications Port (COM6) Resources: IRQ: 11 I/O: ECE8h-ECEFh Class: Ports (COM & LPT) Device: N.I. PCI-232/4 (Isolated) Communications Port (COM5) Resources: IRQ: 11 I/O: ECF8h-ECFFh Class: Ports (COM & LPT) Device: ECP Printer Port (LPT1) Resources: IRQ: 07 I/O: 0378h-037Fh I/O: 0778h-077Fh 11.2 Water Bag Microcontroller (WBC) To start the microcontroller from a secondary terminal, use: 38400,8,1,n,n and no caching. On wake give the command start (or programming for upload) and then the program number. The normal commands shown in Figure 11-2 then apply. Figure 11-1 Water Bag Setup Screen (WBC_STARTER) Model 5700 Biosusceptometer page 69 of 76 Figure 11-2 Program Load Screen WBC (response to IN 2.021) Name ----- Description -------------------------------------------? help, <? VAR> shows variables PR prints <EXPR> STAT sends status to RS232 VER sends versiono to RS232 FI fill, opens DV2 NE neutral, close last DVn EM empty, open DV1 RE regulate ST stop ?needs params? LL list logs since <DATE> LW list warnings RD read ax-value and show it WR write ax-value TE test WRL write regulate log EP empty pulse FP fill pulse CS change screen ~OKAY **** Variable-List: Name ---------- Description -------------- Value ---- Flags DEBUG 0.00 rw--DEBUGIN 0.00 rw--BEEP 1.00 rw--LCD 1.00 rw--- Model 5700 Biosusceptometer page 70 of 76 BLANKTIME BEEPVOL LCDCONTRAST WARNTIME ALARMTIME LOGGING SERSPEED SERPORT SERHANDSHAKE MINCOUNTER MAXCOUNTER CTRLDELAY TIMEINTVAL1 TOTALTIME VALVEVALUE1 VALVEVALUE2 VALVESTART VALVEREST STOPTIME PRSLP IPRS KP KI AI_OFFSET AI_RANGE KG_OFFSET KG_FACTOR AI_ACTTEMP_SF AI_SETTEMP_SF AI_CRATETEMP_SF AI_PRESSBAG_SF AI_PRESSAIR_SF AI_P5V_SF AI_P15V_SF AI_M15V_SF AI_M12V_SF AI_P12V_SF AI_P36V_SF AI_ACTTEMP_OS AI_SETTEMP_OS AI_CRATETEMP_OS AI_PRESSBAG_OS AI_PRESSAIR_OS AI_P5V_OS AI_P15V_OS AI_M15V_OS AI_M12V_OS AI_P12V_OS AI_P36V_OS AI_ACTTEMP_LWL AI_ACTTEMP_UWL AI_ACTTEMP_LAL AI_ACTTEMP_UAL AI_SETTEMP_LWL AI_SETTEMP_UWL AI_SETTEMP_LAL AI_SETTEMP_UAL Model 5700 Biosusceptometer 300.00 3000.00 512.00 100.00 200.00 2.00 38400.00 1.00 0.00 100.00 10000.00 10.00 4.70 10.70 0.04 0.01 1.40 1.26 2.00 2.88 -3.09 0.02 0.00 0.00 5.00 0.00 0.00 10.00 10.00 10.00 15.00 91.00 1.67 0.00 0.00 4.19 4.19 12.80 0.00 0.00 0.00 5.40 0.00 0.00 0.00 0.00 0.00 0.00 0.00 0.00 0.00 0.00 0.00 0.00 0.00 0.00 0.00 page 71 of 76 rw--rw--h rw--h rw--rw--rw--rw--rw--rw--rw--rw--rw--rw--rw--rw--rw--rw--rw--rw--rw--rw--rw--rw--rw--rw--rw--rw--rw--rw--rw--rw--rw--rw--rw--rw--rw--rw--rw--rw--rw--rw--rw--rw--rw--rw--rw--rw--rw--rw--rw--rw--rw--rw--rw--rw--rw--rw--- AI_CRATETEMP_LWL AI_CRATETEMP_UWL AI_CRATETEMP_LAL AI_CRATETEMP_UAL AI_PRESSBAG_LWL AI_PRESSBAG_UWL AI_PRESSBAG_LAL AI_PRESSBAG_UAL AI_PRESSAIR_LWL AI_PRESSAIR_UWL AI_PRESSAIR_LAL AI_PRESSAIR_UAL 0.00 rw--0.00 rw--0.00 rw--0.00 rw--0.00 rw--0.00 rw--0.00 rw--0.00 rw--0.00 rw--0.00 rw--0.00 rw--0.00 rw--- ~OKAY Figure 11-3 Status Command (? And ? VAR) Model 5700 Biosusceptometer page 72 of 76 11.3 SQUID Interface Connector Pinout Figure 11-4 iFL-301 Pigtail Connector Pinout ( Face View ) Pinout 1 2 3 4 5 6 7 8 9 10 Description HEAT+ SIGNAL+ SIGNALHEATFEEDBACKFEEDBACK+ MOD+ BIAS+ BIASMOD- Table 11-1 iFL-301 Pigtail Connector Pinout ( Face View ) Note: The connector shell, twisted pair shields, and cable shield are grounded to the connector shell and a circuit board ground. Model 5700 Biosusceptometer page 73 of 76 11.4 Dewar Interface Pin Connectors INTERNAL- 19-pin connector M A L B N K P U J C V R T D S H E G F Spare Magnet Heater Magnet Heater Magnet Voltage INTERNAL WIRING Wire: 8 mil Manganin for all leads (2X.008 wire used) except Magnet Heater/Spare Magnet Heater/Spare: 8 mil Phosphor Bronze (LakeShore QL-32AWG) - 4X.008 wire used EXTERNAL- 19-pin connector M L A B N K U J P T H C V R S G D E Spare Magnet Heater (not currently on cable) F Magnet Heater (1/4" spade terminals) Magnet Voltage (BNC connector-Male) DEWAR CABLE A1 (19-PIN) 2047 - Torino Liver Fe SIZE Tony Ewing Date DWG NO 11 Aug 99 2047-E10a SHEET REV 1 OF 1 Figure 11-5 Dewar Cable A1 Model 5700 Biosusceptometer page 74 of 76 INTERNAL- Pair (each encased in fiberglass tube - grease after installation) 8 FEET I1- Si Diode #1 I1+ V1- 19-pin connector V1+ M A L K P U J I2I2+ B N C V R T D S H E G Si Diode #2 V2V2+ I3I3+ V3- See diagram below Si Diode #3 V3+ LakeShore 4-lead wire - encase in fiberglass tube - grease after installation F Spare Magnet Heater Magnet Heater Magnet Voltage (BNC connector has shield on V4-) INTERNAL WIRING Wire: 8 mil Manganin for all leads (2X.008 wire used) except Magnet Heater/Spare I+ Magnet Heater/Spare: 8 mil Phosphor Bronze (LakeShore QL-32AWG) - 4X.008 wire used + V+ Four-lead Measurement: - V- Note: see LakeShore silicon diode lead attachment instructions. I- EXTERNAL19-pin connector I1I1+ V1- I+ LEMO #1 I- V1+ M L A N K U J P T H C V R S D E G 4 I2I2+ B V2V2+ I3I3+ V3- LEMO #2 1 3 2 AS PER LTC MANUAL v- LEMO #3 v+ V3+ F BLUE Magnet Heater (1/4" spade terminals) ORNG RED Magnet Voltage BLACK DEWAR CABLE A2 (19-PIN) ADDED EXTRA MAGNET CABLE FOR DIAGNOSTICS ON 25 OCT 99 - 14 METERS 2047 - Torino Liver Fe SIZE Tony Ewing Date DWG NO 25 Oct 99 2047-E10b SHEET REV 1 OF 1 Figure 11-6 Dewar cable A2 Model 5700 Biosusceptometer page 75 of 76 INTERNAL- 8 FEET Internal Heater Coil Resistance } SQUID #1 HEATER (280.7) M A L B N K P U J C V R T S H } SQUID #2 HEATER (283.5) } SQUID #3 HEATER (283) } SPARE HEATER } SPARE HEATER B D E G INTERNAL WIRING: Pair (each encased in fiberglass tube grease after installation) WIRE: 8 mil Manganin for all leads (2X.008 wire used) Approx. 8 feet. F 19-pin connector (supplied by Precision Cryogenics) 14 meters EXTERNAL- ORANGE WHITE SQUID #1 HEATER BLACK SQUID #2 HEATER M A L B B N K P U J C V T H R S G RED SQUID #3 HEATER BLUE YELLOW D E VIOLET GRAY GREEN BROWN F SPARE HEATER SPARE HEATER DEWAR CABLE B (19-Pin) CABLE WIRE TYPE: 24 AWG 10 CONDUCTOR SHIELDED CABLE OVERALL 2047 - Torino Liver Fe SIZE Date DWG NO 28 June 99 2047-E14 Tony Ewing SHEET Figure 11-7 Dewar Cable B Model 5700 Biosusceptometer page 76 of 76 REV 1 OF 1